 Multi-family
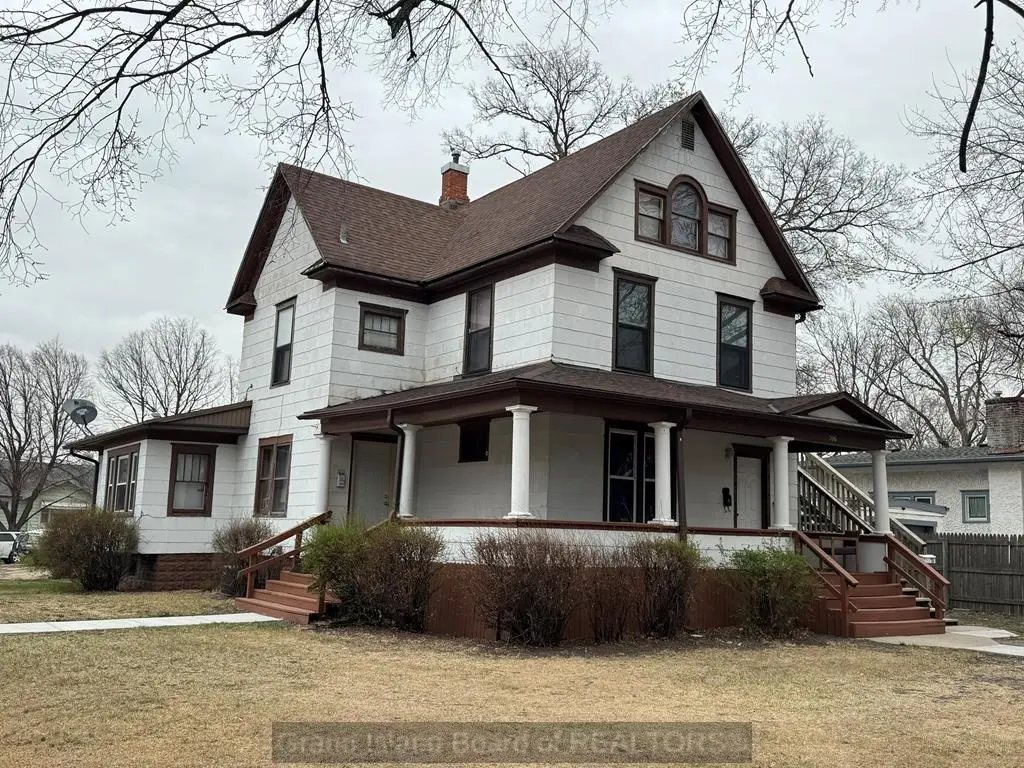
204-206- 206 1/2 E Ashton Ave · Grand Island, NE
Flood risk 1/10 · Minimal
- FEMA flood zone
- X (unshaded)
- Chance of flooding over 30 yrs
- 0.0%
- Est. flood insurance / yr
- $473 – $860
Fire risk 1/10 · Minimal
- Est. fire insurance / yr
- $1,161 – $2,155
Heat risk 3/10 · Minor
- Hot days now (above 103°F)
- 7 days/yr
- Hot days in 30 yrs
- 15 days/yr
Wind risk 2/10 · Minimal
- Chance of severe wind over 30 yrs
- —
Air-quality risk 1/10 · Minimal
- Unhealthy air days now
- 0 days/yr
- Unhealthy air days in 30 yrs
- 0 days/yr
Risk factors via First Street. Map © Google.
Why this score? — see what drove the C grade
The composite is a weighted blend of 9 inputs, each scored 0–100. Each bar is that input's sub-score; the figure is the points it added to the 100-point composite (weight × sub-score).
- Cash flow +27.1/30.0
- DSCR +9.4/10.0
- 1% rule +7.3/10.0
- Livability +4.0/5.0
- Schools +3.1/10.0
- Condition / age +2.8/5.0
- Rent growth +2.5/5.0
- ARV discount +0.2/15.0
- Appreciation +0.0/10.0
$225,000
🖨 Deal sheet 📄 Offer letter ✓ Due diligence
Multi-family units
County records classify this as Multi-Family (2-4 Unit). Listing-text estimate: 1 unit. estimate disagrees with records
Listing remarks MLS
Investment Opportunity! Completely rented with $2,425 monthly rent income. Tenants pay gas and electric. Seller pays water and sewer which averages $219.75/month & Seller pays trash, which is $118.80 every 3 months. One new furnace purchased in 2025. New concrete sidewalks last year.
Key facts
- New furnace
- 9,244 sq ft lot
- Garage
Tags
Neighborhood map
What this means for you Summary
Snapshot
- This is a 6-bed/3.0-bath multifamily listed at $225k. Condition is rated average.
Deal economics
- At list price, monthly cash flow is $637 ($8k/yr) — positive.
- The deal already cash-flows at list — no discount required.
- Meets the 1% rule at list price ($3k rent vs $225k).
- Recommended offer: $198k (12.0% below list) — sets the bar for market timing.
- Cap rate 9.7% vs local median 3.6% in Grand Island — top-decile yield for the area; either an underpriced asset or a hidden risk that comps aren't pricing in. Stress-test before assuming the spread holds.
Location & tenants
- Location reads 79/100 on livability (#43 in NE, #2,252 nationally) — a middle-class / working-renter tenant base. Strengths: cost of living A+, housing A+, health & safety A+; Watch: crime C-, schools D+, commute F.
- Grand Island Public Schools (urban): math 36% / reading 36% proficiency, ranked #102 of 111 in NE (top 92%) — families likely to look elsewhere, expect single-tenant / working-renter base with shorter leases.
- Market conditions: 160 active listings in the ZIP; 246 units permitted in Hall County in 2024 (98 in 5+ unit buildings).
- At $2,775/mo this rent would consume 52% of the median local household income ($64k/yr) (locally 895% of renters already pay >50% of income on rent) — very limited rent-growth headroom before tenants either downsize or default.
Forward outlook
- Local home prices are declining (-3.0%/yr); year-one equity from $2k of loan paydown is wiped out by about $7k of value loss. Plan a longer hold.
- Hall County population projected at +27% by 2050 — long-run rental-demand tailwind backs the buy-and-hold thesis.
- At projected returns (-3.0% appreciation + 3.0% rent growth), your $63k cash investment doubles in ~10 years — after that, you're playing with house money.
Negotiation context
- It's been on market 140 days — a 12% lower offer ($198k) is reasonable based on typical stale-listing flexibility.
Risks & watch-outs
- Watch-outs: built in 1906 — expect roof / HVAC / electrical / plumbing capex.
Questions for the listing agent
- It's been on market 140 days. Have you received any prior offers? Is the seller open to a 12% concession, seller financing, or rate buy-down credit?
- Built in 1906 — when were the roof, HVAC, electrical panel, plumbing, and water heater last replaced?
- Why hasn't it sold? Are there any deal-killer items the seller is aware of (foundation, flood, title, zoning, code violations)?
- Is there a deadline driving the sale (1031 exchange, divorce, estate, relocation)? That informs how much negotiation room exists.
- Schools are D-rated, which usually means shorter tenancies and higher turnover. Who's the typical renter profile here, and what's been the actual vacancy rate?
- What's the average days-on-market for RENTAL listings here right now (not sales)? A rising rental-DOM trend means longer vacancies and softer asking-rent achievability than the comps imply.
- What's the recent tenant-quality profile in this submarket — average credit score on applications, eviction rate, late-payment / NSF rate, and stable-employment percentage? A property-management company in the area should have these aggregated.
- How much new apartment / multifamily construction is in the pipeline within 1–3 miles? Heavy new supply (>2% of stock underway) typically softens rents 12–24 months out; light construction supports rent growth.
Investment metrics
- 1% rule
- 1.23% ✓
- Cap rate
- 9.69%
- Cash-on-cash
- 12.14%
- DSCR
- 1.54
- GRM
- 6.8
CMA / ARV
- ARV (median comp)
- $193,539
- List price
- $225,000
- Delta
- 16.26%
- Verdict
- OVERPRICED
- Comps
- 18 within 1.0 mi
Projected returns pro-forma
-3.0% appreciation · 3.0% rent growth · sell at horizon
- IRR
- 1.7%
- Equity multiple
- 1.07×
- Total profit
- $4,174
- Equity at exit
- $33,548
- IRR
- 11.3%
- Equity multiple
- 1.89×
- Total profit
- $56,073
- Equity at exit
- $19,454
Cash invested: $63,000 (down + closing). Projections, not guarantees.
Landlord ↔ Tenant lean methodology
- Overall (STATE)
- 83 Strongly Landlord-Friendly
- State Nebraska
- 83 Strongly Landlord-Friendly · R+13
- County
- — inherits STATE
- City
- — inherits STATE
ZIP-level market 68801
- Active inventory
- 160
- Price-to-rent
- 13.5×
Monthly cashflow live
- Estimated rent
- $2,775 high interval (Pro) →
- Mortgage (P&I)
- −$1,180
- Tax est. 1.5%
- −$281 /mo · $3,375/yr
- Insurance
- −$94
- HOA
- −$0
- Vacancy / Maint / Mgmt
- −$583
- Net cashflow
- $637
Break-even live
2-unit breakdown (identical units grouped — click to expand)
| Units | Beds | Baths | Est. rent |
|---|---|---|---|
| 2× units | 3 | 1 | $2,774 |
| #1 | 3 | 1 | $1,387 |
| #2 | 3 | 1 | $1,387 |
| Total (2 units) | $2,775 | ||
UW: 25.0% down · 7.5% · 30yr · 1.5% tax · 5.0% vac · 8.0% maint · 8.0% mgmt
Financing live
Cash to close
- Down payment
- $56,250
- Closing costs
- $6,750
- Reserves months
- —
- Total cash needed
- —
Loan-product check · same deal, 3 products live
Conventional
25% down · 7.5% · 30yr
- Down + closing
- —
- Monthly P&I
- —
- Monthly cashflow
- —
- DSCR
- —
- Eligible?
- —
Personal DTI + credit; lowest rate.
DSCR
20% down · 8.5% · 30yr
- Down + closing
- —
- Monthly P&I
- —
- Monthly cashflow
- —
- DSCR
- —
- Eligible?
- —
No personal income docs; deal must DSCR.
Hard money
10% down · 12.0% · 12mo
- Down + closing
- —
- Monthly P&I
- —
- Monthly cashflow
- —
- DSCR
- —
- Eligible?
- —
Short-term bridge; refi at stabilization.
Listing history 18 events
-
2026-06-19days on market $225,000 Active 140 DOM
-
2026-06-18days on market $225,000 Active 139 DOM
-
2026-06-17days on market $225,000 Active 138 DOM
-
2026-06-16days on market $225,000 Active 137 DOM
-
2026-06-15days on market $225,000 Active 136 DOM
-
2026-06-14days on market $225,000 Active 134 DOM
-
2026-06-12days on market $225,000 Active 133 DOM
-
2026-06-09days on market $225,000 Active 130 DOM
-
2026-06-09price $225,000 Active 129 DOM
-
2026-06-08days on market $230,000 Active 129 DOM
-
2026-06-07days on market $230,000 Active 128 DOM
-
2026-06-03days on market $230,000 Active 124 DOM
-
2026-06-02days on market $230,000 Active 123 DOM
-
2026-06-01days on market $230,000 Active 122 DOM
-
2026-05-31days on market $230,000 Active 121 DOM
-
2026-05-30days on market $230,000 Active 120 DOM
-
2026-04-06price $230,000 290-char remark
Show marketing remark (290 chars)
Investment Opportunity! Completely rented with $2,425 monthly rent income. Tenants pay gas and electric. Seller pays water and sewer which averages $219.75/month & Seller pays trash, which is $118.80 every 3 months. One new furnace purchased in 2025. New concrete sidewalks last year.
-
2026-01-30$235,000 Active 290-char remark
Show marketing remark (290 chars)
Investment Opportunity! Completely rented with $2,425 monthly rent income. Tenants pay gas and electric. Seller pays water and sewer which averages $219.75/month & Seller pays trash, which is $118.80 every 3 months. One new furnace purchased in 2025. New concrete sidewalks last year.
ⓘ Source: listings_history table (triggers on properties + properties_extension) + one-shot
backfill from property_details.listing_events for pre-trigger history.
Climate risk First Street
- Flood 1/10 Low FEMA zone X (unshaded) · 0% chance over 30 yrs
- Wildfire 1/10 Low
- Heat 3/10 Moderate 7 d/yr ≥103°F today · 15 d/yr by 30 yrs out
- Wind 2/10 Low
- Air quality 1/10 Low 0 unhealthy d/yr today · 0 by 30 yrs out
Nearby sold comps map
Loading sold comps map…
Walkable amenities ~0.75 mi
Loading nearby amenities…
Taxation est. · year 1
- Rental income
- $33,300
- − Mortgage interest
- −$12,603
- − Property taxes
- −$3,375
- − Insurance
- −$1,125
- − Repairs & maintenance
- −$2,664
- − Management
- −$2,664
- − Depreciation
- −$6,545
- Taxable income
- $4,323
- Est. tax owed @ 24.0%
- −$1,038
- After-tax cash flow
- $6,610/yr
For passive investors: Depreciation is non-cash, so a rental often shows a tax loss while cash-flowing — sheltering income. Rental losses are passive: they offset passive income freely, and up to $25,000/yr can offset ordinary (W-2) income if you actively participate and your MAGI is under $100k (phasing out to $0 by $150k); unused losses carry forward. On sale, claimed depreciation is recaptured at up to 25%, and gains may owe capital-gains tax (a 1031 exchange can defer both). Figures are a year-1 estimate at your 24.0% rate — not tax advice; consult a CPA.
Condition & rehab AI · 5 photos
This multi-family home is in average condition with moderate rehab needed. It has rental income and potential for increased value with exterior painting and landscaping improvements.
Repairs flagged
- Minor Paint — White siding has some discoloration
- Minor Landscaping — Bushes are overgrown
Value-add opportunities
- Both Paint exterior — Enhances curb appeal and resale value
- Both Landscaping — Improves curb appeal and rental value
Renovation cost estimate screening
| Repair item | Severity | Est. cost |
|---|---|---|
| Paint · White siding has some discoloration | Minor | $500–3,000 |
| Landscaping · Bushes are overgrown | Minor | $500–3,000 |
| Total estimated repair cost · 2 items | $1,000–6,000 |
Value-add ROI direction
- Both Paint exterior — Enhances curb appeal and resale value ↑
- Both Landscaping — Improves curb appeal and rental value ↑
ⓘ Cost ranges are severity-bucket heuristics (US national rule-of-thumb). Get contractor quotes + a written scope before underwriting a rehab budget.
Schools (NCES district)
- District
- Grand Island Public Schools
- NCES district ID
- 3100016
- Math proficiency
- 36% ▼ -5.00%
- Reading proficiency
- 36% ▼ -5.00%
- Median HH income
- $47,021
- Composite
- 30.9/100
- National rank
- #6117
- State rank
- #102 of 111 in NE
Livability — Grand Island
- Score
- 79/100
- State rank
- #43
- US rank
- #2252
Category grades
Schools grade is shown separately in the Schools card above.
Census & demographics
- Census place
- Grand Island, NE
- County
- Hall County · 56,358 people
- City population
- 56,358
- Metro
- Grand Island, NE
- Population (ZIP)
- 30,824
- Household income
- $63,617
- Rent vs Own
- Severe rent burden
- 895.0
Population outlook (Hall County) Hauer SSP2
- Today (2025)
- 68,137 people
- By 2030
- 71,543 · +5.0%
- By 2040
- 78,843 · +15.7%
- By 2050
- 86,765 · +27.3%
- By 2075
- 111,764 · +64.0%
- By 2100
- 137,991 · +102.5%
Race, ethnicity, and origin ACS 2023
- Neighborhood character
- Diverse neighborhood (Simpson 0.58)
- Race & ethnicity
- White 49% Hispanic / Latino 42% Two or more races 13% Black 5% Native American 1% Asian 1%
- Hispanic origin (detail)
- Mexican 22% Cuban 4%
- Common ancestry
- Romanian 3% Ukrainian 2% Lithuanian 1%
- Foreign-born
- 22% · Canada
- Languages at home
- 64% English-only · Spanish 32% Arabic 1% Other Asian/Pacific 1%
Political lean MEDSL · Hall
- 2024 margin
- Solid R (+37.8) · D 30.5% · R 68.3% · Other 1.2%
- 2008→2024 swing
- -13.7pp toward R · 2008: -24.1pp · 2024: -37.8pp
- All cycles
- 2024: R+37.8 2020: R+34.8 2016: R+37.5 2012: R+27.6 2008: R+24.1
Not yet ingested
- Civics
- —
Market trends
- HPI YoY
- ▼ -148.38%
- Current HPI
- 230.3861
- Rent YoY
- —
- Metro
- Grand Island, NE
- State GDP YoY
- ▲ 0.68%
- F500 in state
- 2
Industry mix (Fortune 500 HQ in NE)
| Industry | F500 HQs | Revenue |
|---|---|---|
| Conglomerate | 1 | $371B |
|
||
Price history
-2.1% since first listed2 events — show timeline
- 2026-04-06 Price Changed $230,000 GIBOR
- 2026-01-30 Listed $235,000 GIBOR
Cash-flow waterfall
monthlySold comps — $/sqft
last 12 mo · ≤1 miLoading sold comps…