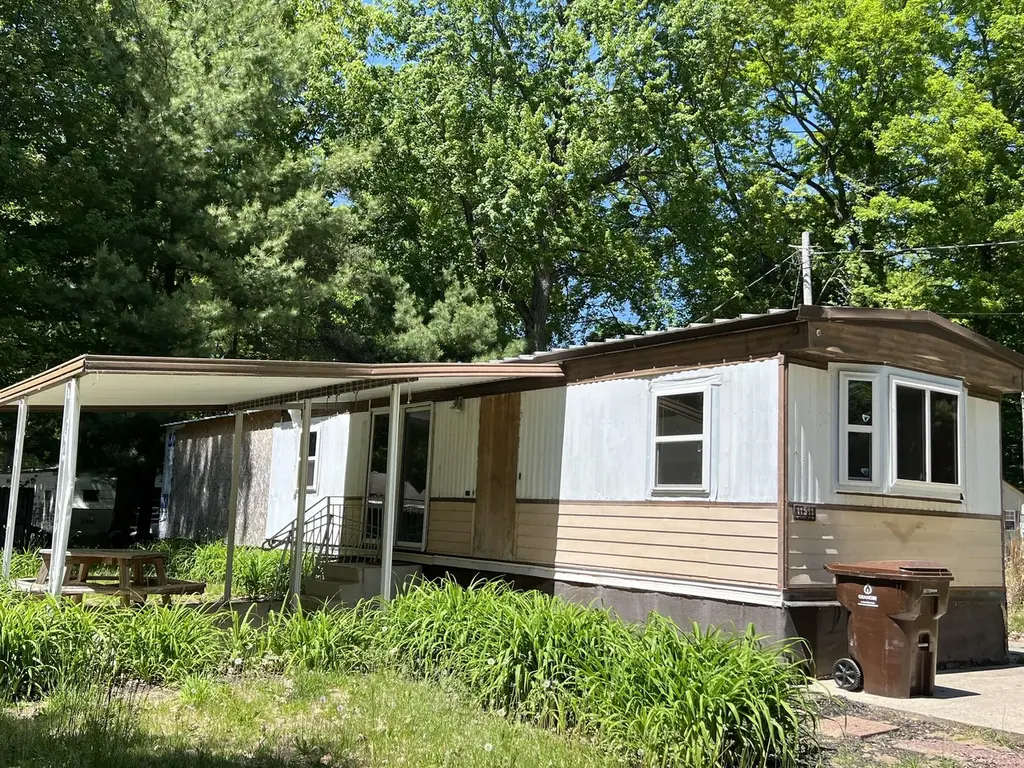
11591 Lark Dr · Belvidere, MI
Flood risk 1/10 · Minimal
- FEMA flood zone
- —
- Chance of flooding over 30 yrs
- 0.0%
- Est. flood insurance / yr
- —
Fire risk 3/10 · Minor
- Est. fire insurance / yr
- $784 – $1,456
Heat risk 2/10 · Minimal
- Hot days now (above 96°F)
- 7 days/yr
- Hot days in 30 yrs
- 14 days/yr
Wind risk 1/10 · Minimal
- Chance of severe wind over 30 yrs
- —
Air-quality risk 1/10 · Minimal
- Unhealthy air days now
- 0 days/yr
- Unhealthy air days in 30 yrs
- 0 days/yr
Risk factors via First Street. Map © Google.
Why this score? — see what drove the D grade
The composite is a weighted blend of 9 inputs, each scored 0–100. Each bar is that input's sub-score; the figure is the points it added to the 100-point composite (weight × sub-score).
- Cash flow +13.9/30.0
- ARV discount +7.5/15.0
- DSCR +4.2/10.0
- 1% rule +3.9/10.0
- Schools +3.0/10.0
- Rent growth +2.5/5.0
- Livability +2.5/5.0
- Condition / age +2.5/5.0
- Appreciation +0.0/10.0
$105,000
🖨 Deal sheet 📄 Offer letter ✓ Due diligence
Listing remarks MLS
LOOKING FOR THAT CHEAPER LAKE AREA PROPERTY? You found it! Check out this great 3 bedroom mobile home on a double lot across from SCHMIED PARK on Townline Lake in Montcalm County. This place is less then an hour from Grand Rapids. The double lot offers an EXTRA cement pad, well and septic for your motor home second summer getaway. The singlewide offers year around living if your looking for that homestead property, or use for your summer getaway. Walk across the street to Schmied Park. The park offers a beach, kids playground and basketball court. Walk a block away to the boat launch. Very quiet dead end street. The home as 3 bedrooms, kitchen with the appliances that are included, sliders open out to a covered patio and a firepit. The vacant lot also has a shed that has a hookup for a motorhome. Electric is disconnected at this time, but is shared with the home. The home as a steel roof, insulated well, and there is a newer well pump in the well pit. Immediate possession. HURRY!
Key facts
- Well and septic
- Firepit
- Cement pad
Tags
Property features AI
Exterior
- Utilities: Well water; Natural gas connected; High-speed internet available; Electric water heater
- Home design: Ranch-style single family home; One story; Built in 1973
- Construction: Aluminum siding; Metal roof
- Exterior features: Wooded, recreational lot; Paved road access
Interior
- Kitchen: Microwave; Range; Refrigerator
- Bathrooms: One full bathroom
- Heating & cooling: Forced air heating; Has cooling
- Interior features: Five total rooms; Screens on windows; Crawl space basement; Living room with sliding doors to the patio (approx. 13 x 12)
Neighborhood map
What this means for you Summary
Snapshot
- This is a 3-bed/1.0-bath manufactured listed at $105k.
Deal economics
- At list price, monthly cash flow is $12 ($143/yr) — positive.
- The deal already cash-flows at list — no discount required.
- To meet the 1% rule (rent ≥ 1% of price), the offer needs to be $93k (11.1% below list).
- Recommended offer: $93k (11.1% below list) — sets the bar for 1% rule.
Location & tenants
- Location reads: area grade D — affects rentability + tenant quality, not the cash-flow math above.
- Lakeview Community Schools (Montcalm) (rural): math 28% / reading 44% proficiency, ranked #281 of 540 in MI (top 52%) — families likely to look elsewhere, expect single-tenant / working-renter base with shorter leases.
- Market conditions: 38 active listings in the ZIP; 273 units permitted in Montcalm County in 2024 (5 in 5+ unit buildings).
Forward outlook
- Local home prices are declining (-3.0%/yr); year-one equity from $726 of loan paydown is wiped out by about $3k of value loss. Plan a longer hold.
- Montcalm County population projected at -17% by 2050 — secular population decline; favor cash flow + early exit over multi-decade hold.
Negotiation context
- It's been on market 16 days — a 2% lower offer ($103k) is reasonable based on typical stale-listing flexibility.
- 3 sale attempts with the ask held roughly flat each time — persistent listings suggest the price (not the market) is what's stuck; bring a comps-based counter.
- Current owner paid $30k; list at $105k implies a 250% gain — meaningful room to come down on a strong offer.
Questions for the listing agent
- Built in 1973 — when were the roof, HVAC, electrical panel, plumbing, and water heater last replaced?
- Is there a deadline driving the sale (1031 exchange, divorce, estate, relocation)? That informs how much negotiation room exists.
- The area grade is low — what's the realistic commute time and amenity access for the typical tenant pool here? Any planned neighborhood developments (good or bad) we should know about?
- What's the average days-on-market for RENTAL listings here right now (not sales)? A rising rental-DOM trend means longer vacancies and softer asking-rent achievability than the comps imply.
- What's the recent tenant-quality profile in this submarket — average credit score on applications, eviction rate, late-payment / NSF rate, and stable-employment percentage? A property-management company in the area should have these aggregated.
- How much new for-sale + rental construction is in the pipeline within 1–3 miles? Heavy new supply typically softens prices + rents 12–24 months out; constrained supply supports both.
Investment metrics
- 1% rule
- 0.89% ✗
- Cap rate
- 6.43%
- Cash-on-cash
- 0.48%
- DSCR
- 1.02
- GRM
- 9.4
CMA / ARV
No comps found within radius.
Projected returns pro-forma
-3.0% appreciation · 3.0% rent growth · sell at horizon
- IRR
- -15.5%
- Equity multiple
- 0.45×
- Total profit
- $-16,244
- Equity at exit
- $15,656
- IRR
- -7.0%
- Equity multiple
- 0.55×
- Total profit
- $-13,113
- Equity at exit
- $9,078
Cash invested: $29,400 (down + closing). Projections, not guarantees.
Landlord ↔ Tenant lean methodology
- Overall (STATE)
- 62 Landlord-Friendly
- State Michigan
- 62 Landlord-Friendly · EVEN
- County
- — inherits STATE
- City
- — inherits STATE
ZIP-level market 48850
- Home prices YoY
- -22.6%
- Active inventory
- 38
- Price-to-rent
- 9.4×
Monthly cashflow live
- Estimated rent
- $934 medium interval (Pro) →
- Mortgage (P&I)
- −$551
- Tax est. 1.5%
- −$131 /mo · $1,575/yr
- Insurance
- −$44
- HOA
- −$0
- Vacancy / Maint / Mgmt
- −$196
- Net cashflow
- $12
Break-even live
UW: 25.0% down · 7.5% · 30yr · 1.5% tax · 5.0% vac · 8.0% maint · 8.0% mgmt
Financing live
Cash to close
- Down payment
- $26,250
- Closing costs
- $3,150
- Reserves months
- —
- Total cash needed
- —
Loan-product check · same deal, 3 products live
Conventional
25% down · 7.5% · 30yr
- Down + closing
- —
- Monthly P&I
- —
- Monthly cashflow
- —
- DSCR
- —
- Eligible?
- —
Personal DTI + credit; lowest rate.
DSCR
20% down · 8.5% · 30yr
- Down + closing
- —
- Monthly P&I
- —
- Monthly cashflow
- —
- DSCR
- —
- Eligible?
- —
No personal income docs; deal must DSCR.
Hard money
10% down · 12.0% · 12mo
- Down + closing
- —
- Monthly P&I
- —
- Monthly cashflow
- —
- DSCR
- —
- Eligible?
- —
Short-term bridge; refi at stabilization.
Listing history 12 events
-
2026-06-18days on market $105,000 Active 16 DOM
-
2026-06-17days on market $105,000 Active 15 DOM
-
2026-06-16days on market $105,000 Active 14 DOM
-
2026-06-15days on market $105,000 Active 13 DOM
-
2026-06-14days on market $105,000 Active 11 DOM
-
2026-06-10days on market $105,000 Active 8 DOM
-
2026-06-09days on market $105,000 Active 7 DOM
-
2026-06-08days on market $105,000 Active 6 DOM
-
2026-06-07days on market $105,000 Active 5 DOM
-
2026-06-05days on market $105,000 Active 2 DOM
-
2026-06-03remarks 699-char remark
-
2026-06-03$105,000 Active 1 DOM
ⓘ Source: listings_history table (triggers on properties + properties_extension) + one-shot
backfill from property_details.listing_events for pre-trigger history.
Climate risk First Street
- Flood 1/10 Low 0% chance over 30 yrs
- Wildfire 3/10 Moderate
- Heat 2/10 Low 7 d/yr ≥96°F today · 14 d/yr by 30 yrs out
- Wind 1/10 Low
- Air quality 1/10 Low 0 unhealthy d/yr today · 0 by 30 yrs out
Nearby sold comps map
Loading sold comps map…
Walkable amenities ~0.75 mi
Loading nearby amenities…
Taxation est. · year 1
- Rental income
- $11,203
- − Mortgage interest
- −$5,882
- − Property taxes
- −$1,575
- − Insurance
- −$525
- − Repairs & maintenance
- −$896
- − Management
- −$896
- − Depreciation
- −$3,055
- Taxable loss
- −$1,626
- Est. tax savings @ 24.0%
- +$390
- After-tax cash flow
- $533/yr
For passive investors: Depreciation is non-cash, so a rental often shows a tax loss while cash-flowing — sheltering income. Rental losses are passive: they offset passive income freely, and up to $25,000/yr can offset ordinary (W-2) income if you actively participate and your MAGI is under $100k (phasing out to $0 by $150k); unused losses carry forward. On sale, claimed depreciation is recaptured at up to 25%, and gains may owe capital-gains tax (a 1031 exchange can defer both). Figures are a year-1 estimate at your 24.0% rate — not tax advice; consult a CPA.
Schools (NCES district)
- District
- Lakeview Community Schools (Montcalm)
- NCES district ID
- 2620910
- Math proficiency
- 28% ▼ -8.00%
- Reading proficiency
- 44% ▼ -5.00%
- Median HH income
- $40,513
- Composite
- 30.21/100
- National rank
- #6303
- State rank
- #281 of 540 in MI
Livability — Belvidere
No livability data for this city. (Only ~50 U.S. cities are tracked.)
Census & demographics
- Population (ZIP)
- 4,526
Population outlook (Montcalm County) Hauer SSP2
- Today (2025)
- 61,011 people
- By 2030
- 59,467 · -2.5%
- By 2040
- 55,427 · -9.2%
- By 2050
- 50,517 · -17.2%
- By 2075
- 38,731 · -36.5%
- By 2100
- 26,770 · -56.1%
Race, ethnicity, and origin ACS 2023
- Neighborhood character
- Predominantly White (86%)
- Race & ethnicity
- White 86% Black 7% Two or more races 4% Hispanic / Latino 4%
- Common ancestry
- Polish 4% Iranian 3% Lithuanian 2%
- Foreign-born
- 1% · Canada
- Languages at home
- 95% English-only · German/W. Germanic 4% Spanish 1%
Political lean MEDSL · Montcalm
- 2024 margin
- Solid R (+39.0) · D 29.8% · R 68.7% · Other 1.5%
- 2008→2024 swing
- -38.7pp toward R · 2008: -0.3pp · 2024: -39.0pp
- All cycles
- 2024: R+39.0 2020: R+37.7 2016: R+34.0 2012: R+8.6 2008: R+0.3
Not yet ingested
- Civics
- —
Market trends
- HPI YoY
- ▼ -80.28%
- Current HPI
- 275.5563
- Rent YoY
- —
- Metro
- —
- State GDP YoY
- ▲ 1.37%
- F500 in state
- 28
Industry mix (Fortune 500 HQ in MI)
| Industry | F500 HQs | Revenue |
|---|---|---|
| Automotive Parts | 3 | $48B |
|
||
| Automotive | 2 | $372B |
|
||
| Chemicals | 1 | $45B |
|
||
| Automotive Retail | 1 | $29B |
|
||
| Healthcare / Medical Devices | 1 | $23B |
|
||
| Automotive Technology | 1 | $20B |
|
||
Price history
+250.0% since first listed4 events — show timeline
- 2026-05-29 Listed $105,000 MiRealSource-MiMLS
- 2026-05-29 Listed $105,000 REALCOMP
- 2026-05-29 Listed $105,000 SW Michigan MLS
- 2018-10-11 Sold (Public Records) $30,000 Public Records
Cash-flow waterfall
monthlySold comps — $/sqft
last 12 mo · ≤1 miLoading sold comps…