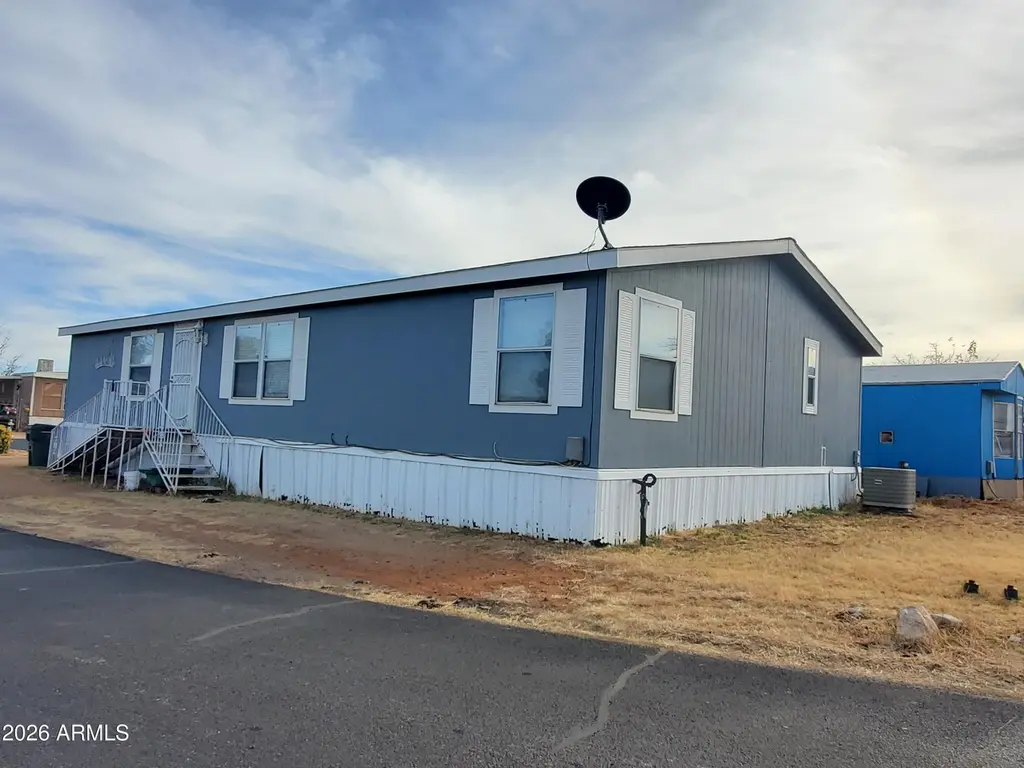
650 E Busby Dr #94 · Sierra Vista, AZ
Flood risk 1/10 · Minimal
- FEMA flood zone
- X (unshaded)
- Chance of flooding over 30 yrs
- 0.0%
- Est. flood insurance / yr
- $507 – $1,088
Fire risk 7/10 · Major
- Est. fire insurance / yr
- $610 – $1,132
Heat risk 5/10 · Moderate
- Hot days now (above 97°F)
- 7 days/yr
- Hot days in 30 yrs
- 20 days/yr
Wind risk 1/10 · Minimal
- Chance of severe wind over 30 yrs
- —
Air-quality risk 1/10 · Minimal
- Unhealthy air days now
- 0 days/yr
- Unhealthy air days in 30 yrs
- 0 days/yr
Risk factors via First Street. Map © Google.
Why this score? — see what drove the B- grade
The composite is a weighted blend of 9 inputs, each scored 0–100. Each bar is that input's sub-score; the figure is the points it added to the 100-point composite (weight × sub-score).
- Cash flow +30.0/30.0
- 1% rule +10.0/10.0
- DSCR +10.0/10.0
- ARV discount +7.5/15.0
- Livability +4.0/5.0
- Schools +2.9/10.0
- Condition / age +2.8/5.0
- Rent growth +2.5/5.0
- Appreciation +0.0/10.0
$85,000
🖨 Deal sheet 📄 Offer letter ✓ Due diligence
Key facts
- 5,445 sq ft lot
- Community pool
- Built 2010
Neighborhood map
What this means for you Summary
Snapshot
- This is a 4-bed/2.0-bath manufactured listed at $85k. Condition is rated average.
Deal economics
- At list price, monthly cash flow is $840 ($10k/yr) — positive.
- The deal already cash-flows at list — no discount required.
- Meets the 1% rule at list price ($2k rent vs $85k).
- Recommended offer: $75k (12.0% below list) — sets the bar for market timing.
- Cap rate 18.2% vs local median 4.3% in Sierra Vista — top-decile yield for the area; either an underpriced asset or a hidden risk that comps aren't pricing in. Stress-test before assuming the spread holds.
Location & tenants
- Location reads 80/100 on livability (#5 in AZ, #1,805 nationally) — a professional / high-income tenant draw. Strengths: commute A+, housing A+, health & safety A+; Watch: amenities F.
- Sierra Vista Unified District (4175) (urban): math 27% / reading 39% proficiency, ranked #93 of 249 in AZ (top 37%) — families likely to look elsewhere, expect single-tenant / working-renter base with shorter leases.
- Market conditions: Rents flat; 176 active listings in the ZIP; 1 comparable units currently listed for rent nearby; 437 units permitted in Cochise County in 2024 (6 in 5+ unit buildings).
- This rent runs 35% of the median local income ($62k/yr) — at the standard rent-burdened threshold; future hikes will face affordability resistance.
Forward outlook
- Local home prices are declining (-3.0%/yr); year-one equity from $588 of loan paydown is wiped out by about $3k of value loss. Plan a longer hold.
- Cochise County population projected at -30% by 2050 — secular population decline; favor cash flow + early exit over multi-decade hold.
- At projected returns (-3.0% appreciation + 0.0% rent growth), your $24k cash investment doubles in ~3 years — after that, you're playing with house money.
Negotiation context
- It's been on market 121 days — a 12% lower offer ($75k) is reasonable based on typical stale-listing flexibility.
- 4 sale attempts since 5y ago with the ask held roughly flat each time — persistent listings suggest the price (not the market) is what's stuck; bring a comps-based counter.
Risks & watch-outs
- Climate carrying-cost: major wildfire risk; extreme-heat days projected 7→20/yr by 2055 (HVAC capex compounding) — expect insurance premiums to compound above CPI over the hold.
Questions for the listing agent
- It's been on market 121 days. Have you received any prior offers? Is the seller open to a 12% concession, seller financing, or rate buy-down credit?
- Why hasn't it sold? Are there any deal-killer items the seller is aware of (foundation, flood, title, zoning, code violations)?
- Is there a deadline driving the sale (1031 exchange, divorce, estate, relocation)? That informs how much negotiation room exists.
- What's the average days-on-market for RENTAL listings here right now (not sales)? A rising rental-DOM trend means longer vacancies and softer asking-rent achievability than the comps imply.
- What's the recent tenant-quality profile in this submarket — average credit score on applications, eviction rate, late-payment / NSF rate, and stable-employment percentage? A property-management company in the area should have these aggregated.
- How much new for-sale + rental construction is in the pipeline within 1–3 miles? Heavy new supply typically softens prices + rents 12–24 months out; constrained supply supports both.
Investment metrics
- 1% rule
- 2.13% ✓
- Cap rate
- 18.15%
- Cash-on-cash
- 42.36%
- DSCR
- 2.88
- GRM
- 3.9
CMA / ARV
- ARV (median comp)
- $198,986
- List price
- $85,000
- Delta
- -57.28%
- Verdict
- UNDERPRICED
- Comps
- 2 within 1.0 mi
Show comp detail 1 sale within ~0.75 mi
| Address | Dist | Beds/Ba | Sqft | Sold | Price | $/sf | Match |
|---|---|---|---|---|---|---|---|
| 170 Valerie Ln | 0.26mi | 3/2.0 (-1) | 1,963 (+10%) | 2mo | $215,000 | $110 | 65 |
Match score weights: distance 35% · size 25% · config 20% · recency 20%. Top-matched comps best support the ARV.
Projected returns pro-forma
-3.0% appreciation · 0.0% rent growth · sell at horizon
- IRR
- 35.6%
- Equity multiple
- 2.45×
- Total profit
- $34,468
- Equity at exit
- $12,674
- IRR
- 40.8%
- Equity multiple
- 4.30×
- Total profit
- $78,561
- Equity at exit
- $7,349
Cash invested: $23,800 (down + closing). Projections, not guarantees.
Landlord ↔ Tenant lean methodology
- Overall (STATE)
- 87 Strongly Landlord-Friendly
- State Arizona
- 87 Strongly Landlord-Friendly · R+3
- County
- — inherits STATE
- City
- — inherits STATE
ZIP-level market 85635
- Home prices YoY
- -32.3%
- Rents YoY
- 0.0%
- Active inventory
- 176
- Price-to-rent
- 3.9×
Monthly cashflow live
- Estimated rent
- $1,807 medium interval (Pro) →
- Mortgage (P&I)
- −$446
- Tax est. 1.5%
- −$106 /mo · $1,275/yr
- Insurance
- −$35
- HOA
- −$0
- Vacancy / Maint / Mgmt
- −$379
- Net cashflow
- $840
Break-even live
UW: 25.0% down · 7.5% · 30yr · 1.5% tax · 5.0% vac · 8.0% maint · 8.0% mgmt
Financing live
Cash to close
- Down payment
- $21,250
- Closing costs
- $2,550
- Reserves months
- —
- Total cash needed
- —
Loan-product check · same deal, 3 products live
Conventional
25% down · 7.5% · 30yr
- Down + closing
- —
- Monthly P&I
- —
- Monthly cashflow
- —
- DSCR
- —
- Eligible?
- —
Personal DTI + credit; lowest rate.
DSCR
20% down · 8.5% · 30yr
- Down + closing
- —
- Monthly P&I
- —
- Monthly cashflow
- —
- DSCR
- —
- Eligible?
- —
No personal income docs; deal must DSCR.
Hard money
10% down · 12.0% · 12mo
- Down + closing
- —
- Monthly P&I
- —
- Monthly cashflow
- —
- DSCR
- —
- Eligible?
- —
Short-term bridge; refi at stabilization.
Rent comps 1 comps
| Address | Beds | Baths | Sqft | Rent | $/sqft | DOM | Units | Dist |
|---|---|---|---|---|---|---|---|---|
| 499 S Carmichael Ave Sierra Vista, AZ | 3.0–4.0 | 2.0 | 1163 | $1,699 | $1.46 | 1d | 5 | 0.43mi |
Listing history 27 events
-
2026-06-19days on market $85,000 Active 121 DOM
-
2026-06-18days on market $85,000 Active 120 DOM
-
2026-06-17days on market $85,000 Active 119 DOM
-
2026-06-16days on market $85,000 Active 118 DOM
-
2026-06-15days on market $85,000 Active 117 DOM
-
2026-06-14days on market $85,000 Active 115 DOM
-
2026-06-12days on market $85,000 Active 114 DOM
-
2026-06-09days on market $85,000 Active 111 DOM
-
2026-06-08days on market $85,000 Active 110 DOM
-
2026-06-07days on market $85,000 Active 109 DOM
-
2026-06-05days on market $85,000 Active 106 DOM
-
2026-06-03days on market $85,000 Active 105 DOM
-
2026-06-02days on market $85,000 Active 104 DOM
-
2026-06-01days on market $85,000 Active 103 DOM
-
2026-05-31days on market $85,000 Active 102 DOM
-
2026-05-30days on market $85,000 Active 101 DOM
-
2026-02-26$85,000 Active
-
2026-02-17$85,000 Active
-
2025-12-04historical
-
2025-09-03price $90,000
-
2025-06-17price $99,900
-
2024-10-22price $115,000
-
2024-09-05$129,000 Active
-
2021-06-11soldstatus $85,000 Closed
-
2021-04-27status Pending
-
2021-03-26historical Under Contract Accepting Backups
-
2021-02-13$85,000 Active
ⓘ Source: listings_history table (triggers on properties + properties_extension) + one-shot
backfill from property_details.listing_events for pre-trigger history.
Climate risk First Street
- Flood 1/10 Low FEMA zone X (unshaded) · 0% chance over 30 yrs
- Wildfire 7/10 Severe
- Heat 5/10 Major 7 d/yr ≥97°F today · 20 d/yr by 30 yrs out
- Wind 1/10 Low
- Air quality 1/10 Low 0 unhealthy d/yr today · 0 by 30 yrs out
Nearby sold comps map
Loading sold comps map…
Walkable amenities ~0.75 mi
Loading nearby amenities…
Taxation est. · year 1
- Rental income
- $21,685
- − Mortgage interest
- −$4,761
- − Property taxes
- −$1,275
- − Insurance
- −$425
- − Repairs & maintenance
- −$1,735
- − Management
- −$1,735
- − Depreciation
- −$2,473
- Taxable income
- $9,281
- Est. tax owed @ 24.0%
- −$2,227
- After-tax cash flow
- $7,854/yr
For passive investors: Depreciation is non-cash, so a rental often shows a tax loss while cash-flowing — sheltering income. Rental losses are passive: they offset passive income freely, and up to $25,000/yr can offset ordinary (W-2) income if you actively participate and your MAGI is under $100k (phasing out to $0 by $150k); unused losses carry forward. On sale, claimed depreciation is recaptured at up to 25%, and gains may owe capital-gains tax (a 1031 exchange can defer both). Figures are a year-1 estimate at your 24.0% rate — not tax advice; consult a CPA.
Condition & rehab AI · 10 photos
A mobile home with average condition, requiring minor repairs and updates to enhance its resale and rental value.
Repairs flagged
- Minor exterior siding — Slight discoloration
- Minor interior paint — Some wear
- Minor kitchen appliances — Dated design
Value-add opportunities
- Resale Paint exterior siding — Enhances curb appeal
- Rental Replace worn curtains — Improves aesthetics
- Both Update kitchen appliances — Modernizes and increases functionality
Renovation cost estimate screening
| Repair item | Severity | Est. cost |
|---|---|---|
| exterior siding · Slight discoloration | Minor | $500–3,000 |
| interior paint · Some wear | Minor | $500–3,000 |
| kitchen appliances · Dated design | Minor | $500–3,000 |
| Total estimated repair cost · 3 items | $1,500–9,000 |
Value-add ROI direction
- Resale Paint exterior siding — Enhances curb appeal ↑
- Rental Replace worn curtains — Improves aesthetics ↑
- Both Update kitchen appliances — Modernizes and increases functionality ↑
ⓘ Cost ranges are severity-bucket heuristics (US national rule-of-thumb). Get contractor quotes + a written scope before underwriting a rehab budget.
Schools (NCES district)
- District
- Sierra Vista Unified District (4175)
- NCES district ID
- 0401460
- Math proficiency
- 27% ▼ -19.00%
- Reading proficiency
- 39% ▼ -10.00%
- Median HH income
- $55,463
- Composite
- 29.17/100
- National rank
- #6573
- State rank
- #93 of 249 in AZ
Livability — Sierra Vista
- Score
- 80/100
- State rank
- #5
- US rank
- #1805
Category grades
Schools grade is shown separately in the Schools card above.
Census & demographics
- Census place
- Sierra Vista, AZ
- County
- Cochise County · 49,069 people
- City population
- 49,069
- Metro
- Sierra Vista-Douglas, AZ
- Population (ZIP)
- 34,193
- Household income
- $61,580
- Rent vs Own
- Severe rent burden
- 1129.0
Population outlook (Cochise County) Hauer SSP2
- Today (2025)
- 113,402 people
- By 2030
- 106,197 · -6.4%
- By 2040
- 92,166 · -18.7%
- By 2050
- 79,805 · -29.6%
- By 2075
- 56,831 · -49.9%
- By 2100
- 35,103 · -69.0%
Race, ethnicity, and origin ACS 2023
- Neighborhood character
- Diverse neighborhood (Simpson 0.60)
- Race & ethnicity
- White 58% Hispanic / Latino 25% Two or more races 17% Black 6% Asian 4%
- Hispanic origin (detail)
- Mexican 19% Puerto Rican 1%
- Common ancestry
- Romanian 3% Lithuanian 3% Italian 2%
- Foreign-born
- 11% · Canada, South Korea
- Languages at home
- 80% English-only · Spanish 14% Korean 2% German/W. Germanic 1%
Political lean MEDSL · Cochise
- 2024 margin
- Strong R (+23.1) · D 37.8% · R 61.0% · Other 1.2%
- 2008→2024 swing
- -2.5pp toward R · 2008: -20.7pp · 2024: -23.1pp
- All cycles
- 2024: R+23.1 2020: R+19.6 2016: R+22.6 2012: R+24.0 2008: R+20.7
Not yet ingested
- Civics
- —
Market trends
- HPI YoY
- ▼ -83.93%
- Current HPI
- 175.5821
- Rent YoY
- ▬ 0.00%
- Metro
- Sierra Vista-Douglas, AZ
- State GDP YoY
- ▲ 4.54%
- F500 in state
- 20
Industry mix (Fortune 500 HQ in AZ)
| Industry | F500 HQs | Revenue |
|---|---|---|
| Technology | 2 | $13B |
|
||
| Mining / Metals | 1 | $23B |
|
||
| Environmental Services | 1 | $16B |
|
||
| Metals / Steel | 1 | $14B |
|
||
| Technology Distribution | 1 | $9B |
|
||
| Homebuilding | 1 | $8B |
|
||
Price history
+0.0% since first listed11 events — show timeline
- 2026-02-26 Listed $85,000 MLSSAZ
- 2026-02-17 Listed $85,000 ARMLS
- 2025-12-04 Listing Removed — ARMLS
- 2025-09-03 Price Changed $90,000 ARMLS
- 2025-06-17 Price Changed $99,900 ARMLS
- 2024-10-22 Price Changed $115,000 ARMLS
- 2024-09-05 Listed $129,000 ARMLS
- 2021-06-11 Sold (MLS) $85,000 ARMLS
- 2021-04-27 Pending — ARMLS
- 2021-03-26 Contingent — ARMLS
- 2021-02-13 Listed $85,000 ARMLS
Cash-flow waterfall
monthlySold comps — $/sqft
last 12 mo · ≤1 miLoading sold comps…