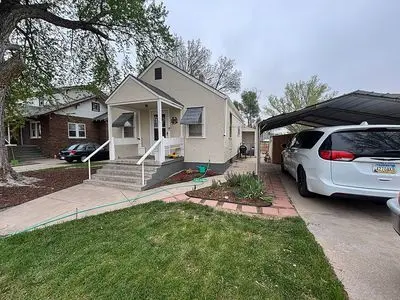
106 E Jackson St · St. Francis, KS
Flood risk 1/10 · Minimal
- FEMA flood zone
- —
- Chance of flooding over 30 yrs
- 0.0%
- Est. flood insurance / yr
- —
Fire risk 5/10 · Moderate
- Est. fire insurance / yr
- $1,154 – $2,142
Heat risk 4/10 · Minor
- Hot days now (above 99°F)
- 7 days/yr
- Hot days in 30 yrs
- 17 days/yr
Wind risk 2/10 · Minimal
- Chance of severe wind over 30 yrs
- —
Air-quality risk 1/10 · Minimal
- Unhealthy air days now
- 0 days/yr
- Unhealthy air days in 30 yrs
- 0 days/yr
Risk factors via First Street. Map © Google.
Why this score? — see what drove the C- grade
The composite is a weighted blend of 9 inputs, each scored 0–100. Each bar is that input's sub-score; the figure is the points it added to the 100-point composite (weight × sub-score).
- Cash flow +15.3/30.0
- Appreciation +9.2/10.0
- ARV discount +7.5/15.0
- DSCR +4.7/10.0
- 1% rule +3.8/10.0
- Schools +3.4/10.0
- Rent growth +2.5/5.0
- Livability +2.5/5.0
- Condition / age +2.5/5.0
$90,000
🖨 Deal sheet 📄 Offer letter ✓ Due diligence
Key facts
- Finished basement
- Built 1925
- Listed 34 days
Tags
Neighborhood map
What this means for you Summary
Snapshot
- This is a 2-bed/1.5-bath single-family listed at $90k.
Deal economics
- At list price, monthly cash flow is $33 ($400/yr) — positive.
- The deal already cash-flows at list — no discount required.
- To meet the 1% rule (rent ≥ 1% of price), the offer needs to be $79k (12.2% below list).
- Recommended offer: $79k (12.2% below list) — sets the bar for 1% rule.
Location & tenants
- Location reads: area grade C — affects rentability + tenant quality, not the cash-flow math above.
- St Francis Comm Schools (rural): math 40% / reading 35% proficiency, ranked #103 of 280 in KS (top 37%) — families likely to look elsewhere, expect single-tenant / working-renter base with shorter leases.
- Market conditions: 3 active listings in the ZIP.
Forward outlook
- In year one you build about $8k of equity ($622 loan paydown + $8k appreciation (8.4% local appreciation)).
- At projected returns (8.4% appreciation + 3.0% rent growth), your $25k cash investment doubles in ~3 years — after that, you're playing with house money.
- By year 5, paydown + projected appreciation supports a ~$37k cash-out refi (75% LTV) — recoverable capital for the next deal without selling this one.
Negotiation context
- It's been on market 35 days — a 3% lower offer ($87k) is reasonable based on typical stale-listing flexibility.
- Current owner paid $19k; list at $90k implies a 374% gain — meaningful room to come down on a strong offer.
Risks & watch-outs
- Watch-outs: built in 1925 — expect roof / HVAC / electrical / plumbing capex.
- Climate carrying-cost: moderate wildfire risk — expect insurance premiums to compound above CPI over the hold.
Questions for the listing agent
- It's been on market 35 days. Have you received any prior offers? Is the seller open to a 12% concession, seller financing, or rate buy-down credit?
- Built in 1925 — when were the roof, HVAC, electrical panel, plumbing, and water heater last replaced?
- Is there a deadline driving the sale (1031 exchange, divorce, estate, relocation)? That informs how much negotiation room exists.
- What's the average days-on-market for RENTAL listings here right now (not sales)? A rising rental-DOM trend means longer vacancies and softer asking-rent achievability than the comps imply.
- What's the recent tenant-quality profile in this submarket — average credit score on applications, eviction rate, late-payment / NSF rate, and stable-employment percentage? A property-management company in the area should have these aggregated.
- How much new for-sale + rental construction is in the pipeline within 1–3 miles? Heavy new supply typically softens prices + rents 12–24 months out; constrained supply supports both.
Investment metrics
- 1% rule
- 0.88% ✗
- Cap rate
- 6.74%
- Cash-on-cash
- 1.59%
- DSCR
- 1.07
- GRM
- 9.5
CMA / ARV
No comps found within radius.
Projected returns pro-forma
8.37% appreciation · 3.0% rent growth · sell at horizon
- IRR
- 22.0%
- Equity multiple
- 2.64×
- Total profit
- $41,350
- Equity at exit
- $70,672
- IRR
- 20.1%
- Equity multiple
- 5.70×
- Total profit
- $118,515
- Equity at exit
- $142,533
Cash invested: $25,200 (down + closing). Projections, not guarantees.
Landlord ↔ Tenant lean methodology
- Overall (STATE)
- 83 Strongly Landlord-Friendly
- State Kansas
- 83 Strongly Landlord-Friendly · R+10
- County
- — inherits STATE
- City
- — inherits STATE
ZIP-level market 67756
- Home prices YoY
- 4.0%
- Active inventory
- 3
- Price-to-rent
- 9.5×
Monthly cashflow live
- Estimated rent
- $790 medium interval (Pro) →
- Mortgage (P&I)
- −$472
- Tax from tax record
- −$82 /mo · $979/yr
- Insurance
- −$38
- HOA
- −$0
- Vacancy / Maint / Mgmt
- −$166
- Net cashflow
- $33
Break-even live
UW: 25.0% down · 7.5% · 30yr · 1.5% tax · 5.0% vac · 8.0% maint · 8.0% mgmt
Financing live
Cash to close
- Down payment
- $22,500
- Closing costs
- $2,700
- Reserves months
- —
- Total cash needed
- —
Loan-product check · same deal, 3 products live
Conventional
25% down · 7.5% · 30yr
- Down + closing
- —
- Monthly P&I
- —
- Monthly cashflow
- —
- DSCR
- —
- Eligible?
- —
Personal DTI + credit; lowest rate.
DSCR
20% down · 8.5% · 30yr
- Down + closing
- —
- Monthly P&I
- —
- Monthly cashflow
- —
- DSCR
- —
- Eligible?
- —
No personal income docs; deal must DSCR.
Hard money
10% down · 12.0% · 12mo
- Down + closing
- —
- Monthly P&I
- —
- Monthly cashflow
- —
- DSCR
- —
- Eligible?
- —
Short-term bridge; refi at stabilization.
Listing history 15 events
-
2026-06-16days on market $90,000 Active 35 DOM
-
2026-06-15days on market $90,000 Active 34 DOM
-
2026-06-13days on market $90,000 Active 32 DOM
-
2026-06-12days on market $90,000 Active 31 DOM
-
2026-06-09days on market $90,000 Active 28 DOM
-
2026-06-08days on market $90,000 Active 27 DOM
-
2026-06-07days on market $90,000 Active 26 DOM
-
2026-06-05days on market $90,000 Active 24 DOM
-
2026-06-04days on market $90,000 Active 22 DOM
-
2026-06-02days on market $90,000 Active 21 DOM
-
2026-06-01days on market $90,000 Active 20 DOM
-
2026-05-31days on market $90,000 Active 19 DOM
-
2026-05-31days on market $90,000 Active 18 DOM
-
2026-05-12$90,000 Active
-
1999-06-01soldstatus $19,000
ⓘ Source: listings_history table (triggers on properties + properties_extension) + one-shot
backfill from property_details.listing_events for pre-trigger history.
Tax reassessment forecast KS · Resets to sale price
- Current annual tax
- $979 · $82/mo
- Projected year-2 tax
- $1,269 · $106/mo
- Expected delta
- +$290/yr (+$24/mo · 29.7%)
ⓘ Screening estimate from a state-policy table — verify with the county assessor before closing.
Climate risk First Street
- Flood 1/10 Low 0% chance over 30 yrs
- Wildfire 5/10 Major
- Heat 4/10 Moderate 7 d/yr ≥99°F today · 17 d/yr by 30 yrs out
- Wind 2/10 Low
- Air quality 1/10 Low 0 unhealthy d/yr today · 0 by 30 yrs out
Nearby sold comps map
Loading sold comps map…
Walkable amenities ~0.75 mi
Loading nearby amenities…
Taxation est. · year 1
- Rental income
- $9,484
- − Mortgage interest
- −$5,041
- − Property taxes
- −$979
- − Insurance
- −$450
- − Repairs & maintenance
- −$759
- − Management
- −$759
- − Depreciation
- −$2,618
- Taxable loss
- −$1,122
- Est. tax savings @ 24.0%
- +$269
- After-tax cash flow
- $669/yr
For passive investors: Depreciation is non-cash, so a rental often shows a tax loss while cash-flowing — sheltering income. Rental losses are passive: they offset passive income freely, and up to $25,000/yr can offset ordinary (W-2) income if you actively participate and your MAGI is under $100k (phasing out to $0 by $150k); unused losses carry forward. On sale, claimed depreciation is recaptured at up to 25%, and gains may owe capital-gains tax (a 1031 exchange can defer both). Figures are a year-1 estimate at your 24.0% rate — not tax advice; consult a CPA.
Schools (NCES district)
- District
- St Francis Comm Schools
- NCES district ID
- 2011880
- Math proficiency
- 40% ▲ 10.00%
- Reading proficiency
- 35% ▲ 5.00%
- Median HH income
- $41,216
- Composite
- 34.12/100
- National rank
- #10282
- State rank
- #103 of 280 in KS
Livability — St. Francis
No livability data for this city. (Only ~50 U.S. cities are tracked.)
Census & demographics
- Census place
- St. Francis, KS
- Population (ZIP)
- 1,707
Population outlook (Cheyenne County) Hauer SSP2
- Today (2025)
- 2,625 people
- By 2030
- 2,623 · -0.1%
- By 2040
- 2,616 · -0.3%
- By 2050
- 2,671 · +1.8%
- By 2075
- 3,132 · +19.3%
- By 2100
- 3,193 · +21.6%
Race, ethnicity, and origin ACS 2023
- Neighborhood character
- Predominantly White (91%)
- Race & ethnicity
- White 91% Hispanic / Latino 5% Two or more races 5%
- Hispanic origin (detail)
- Mexican 5%
- Common ancestry
- Scotch-Irish 5% Slovak 2% Lithuanian 1%
- Foreign-born
- 3% · Canada
- Languages at home
- 95% English-only · Spanish 5%
Political lean MEDSL · Cheyenne
- 2024 margin
- Solid R (+68.8) · D 14.5% · R 83.3% · Other 2.2%
- 2008→2024 swing
- -13.8pp toward R · 2008: -55.1pp · 2024: -68.8pp
- All cycles
- 2024: R+68.8 2020: R+67.0 2016: R+69.8 2012: R+65.1 2008: R+55.1
Not yet ingested
- Civics
- —
Market trends
- HPI YoY
- ▲ 8.37%
- Current HPI
- 216.3909
- Rent YoY
- —
- Metro
- —
- State GDP YoY
- —
- F500 in state
- 0
Price history
+373.7% since first listed2 events — show timeline
- 2026-05-12 Listed $90,000 FSBO.com
- 1999-06-01 Sold (Public Records) $19,000 Public Records
Property tax history
+7.6%/yrLatest (2025): $979 · +8.8% YoY. Source: county tax records.
Cash-flow waterfall
monthlySold comps — $/sqft
last 12 mo · ≤1 miLoading sold comps…