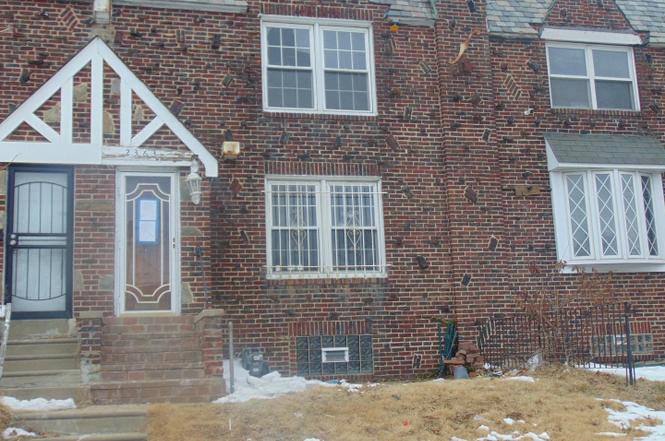
2363 Baird Blvd · Camden, NJ
Flood risk 4/10 · Minor
- FEMA flood zone
- X (shaded)
- Chance of flooding over 30 yrs
- 0.23%
- Est. flood insurance / yr
- $507 – $1,088
Fire risk 1/10 · Minimal
- Est. fire insurance / yr
- $526 – $976
Heat risk 7/10 · Major
- Hot days now (above 104°F)
- 7 days/yr
- Hot days in 30 yrs
- 15 days/yr
Wind risk 6/10 · Moderate
- Chance of severe wind over 30 yrs
- 27.0%
Air-quality risk 4/10 · Minor
- Unhealthy air days now
- 5 days/yr
- Unhealthy air days in 30 yrs
- 6 days/yr
Risk factors via First Street. Map © Google.
Why this score? — see what drove the C+ grade
The composite is a weighted blend of 9 inputs, each scored 0–100. Each bar is that input's sub-score; the figure is the points it added to the 100-point composite (weight × sub-score).
- Cash flow +24.0/30.0
- ARV discount +15.0/15.0
- DSCR +7.7/10.0
- 1% rule +6.4/10.0
- Livability +3.5/5.0
- Rent growth +2.5/5.0
- Condition / age +2.5/5.0
- Schools +0.7/10.0
- Appreciation +0.0/10.0
$174,900
🖨 Deal sheet 📄 Offer letter ✓ Due diligence
Listing remarks
Spacious 4-bedroom, 2½-bath row home located in one of the city’s most desirable neighborhoods. This property in need of some TLC, offers generous living space, featuring a bright and inviting living room, a formal dining area, and an updated kitchen with ample cabinet storage. Upstairs, you’ll find four comfortable bedrooms with great natural light, including a primary suite with its own private bath. The partially finished basement provides additional living space—perfect for a family room, home office, gym, or entertainment area—plus extra storage and utility space. Conveniently situated near shopping, dining, schools, and public transportation, this home c
Key facts
- Great natural light
- Private bath
- Formal dining area
Tags
Neighborhood map
What this means for you Summary
Snapshot
- This is a 4-bed/2.0-bath single-family listed at $175k.
Deal economics
- At list price, monthly cash flow is $341 ($4k/yr) — positive.
- The deal already cash-flows at list — no discount required.
- Meets the 1% rule at list price ($2k rent vs $175k).
- Recommended offer: $172k (1.5% below list) — sets the bar for market timing.
- Cap rate 8.6% vs local median 7.1% in Camden — meaningfully above typical; check what's discounted (condition, days-on-market, listing class) to confirm the premium yield is real.
Location & tenants
- Location reads 70/100 on livability (#262 in NJ) — a middle-class / working-renter tenant base. Strengths: amenities A+, commute A+, cost of living A; Watch: schools F, crime F, employment F.
- Camden City School District (urban): math 3% / reading 16% proficiency, ranked #472 of 472 in NJ (top 100%) — low school quality limits family demand, transient renter base, plan for 1-2y turnover; 86% free/reduced lunch — lower-income household profile, screen leases tightly.
- Market conditions: 59 active listings in the ZIP; 9 comparable units currently listed for rent nearby; rentals at typical pace (median 24d on market — plan ~3-4 weeks tenant-placement turnaround); 1,018 units permitted in Camden County in 2024 (509 in 5+ unit buildings).
Forward outlook
- Local home prices are declining (-3.0%/yr); year-one equity from $1k of loan paydown is wiped out by about $5k of value loss. Plan a longer hold.
- Camden County population projected to shrink 8% by 2050 — rents likely to lag national; underwrite the cash flow, not the appreciation.
Negotiation context
- It's been on market 29 days — a 2% lower offer ($172k) is reasonable based on typical stale-listing flexibility.
- 4 sale attempts since 16y ago with the ask held roughly flat each time — persistent listings suggest the price (not the market) is what's stuck; bring a comps-based counter.
- Current owner paid $31k; list at $175k implies a 466% gain — meaningful room to come down on a strong offer.
Risks & watch-outs
- Watch-outs: built in 1939 — expect roof / HVAC / electrical / plumbing capex.
- Climate carrying-cost: major wind risk, 27% chance of damaging wind over 30y; extreme-heat days projected 7→15/yr by 2055 (HVAC capex compounding) — expect insurance premiums to compound above CPI over the hold.
Questions for the listing agent
- Built in 1939 — when were the roof, HVAC, electrical panel, plumbing, and water heater last replaced?
- Is there a deadline driving the sale (1031 exchange, divorce, estate, relocation)? That informs how much negotiation room exists.
- Schools are F-rated, which usually means shorter tenancies and higher turnover. Who's the typical renter profile here, and what's been the actual vacancy rate?
- Crime grade is F in this area — have there been break-ins, vandalism, or insurance claims at this property in the last 3 years? What carrier currently insures it and at what premium?
- What's the average days-on-market for RENTAL listings here right now (not sales)? A rising rental-DOM trend means longer vacancies and softer asking-rent achievability than the comps imply.
- What's the recent tenant-quality profile in this submarket — average credit score on applications, eviction rate, late-payment / NSF rate, and stable-employment percentage? A property-management company in the area should have these aggregated.
- How much new for-sale + rental construction is in the pipeline within 1–3 miles? Heavy new supply typically softens prices + rents 12–24 months out; constrained supply supports both.
Investment metrics
- 1% rule
- 1.14% ✓
- Cap rate
- 8.63%
- Cash-on-cash
- 8.36%
- DSCR
- 1.37
- GRM
- 7.3
CMA / ARV
- ARV (on-the-fly)
- $241,604
- Comps found
- 12
Show comp detail 12 sales within ~0.75 mi
| Address | Dist | Beds/Ba | Sqft | Sold | Price | $/sf | Match |
|---|---|---|---|---|---|---|---|
| 6814 Waldorf Ave | 0.49mi | 3/2.5 (-1) | 1,320 (+2%) | 2mo | $364,900 | $276 | 65 |
| 6842 Waldorf Ave | 0.48mi | 4/2.0 | 1,211 (-6%) | 3mo | $230,000 | $190 | 65 |
| 520 Beacon Ave | 0.57mi | 3/2.0 (-1) | 1,289 (-0%) | 6mo | $269,950 | $209 | 63 |
| 6804 Waldorf Ave | 0.49mi | 3/2.5 (-1) | 1,320 (+2%) | 8mo | $350,000 | $265 | 60 |
| 420 Boyd St | 0.21mi | 3/1.0 (-1) | 1,415 (+10%) | 7mo | $265,000 | $187 | 60 |
| 128 N 28th St | 0.49mi | 5/1.5 (+1) | 1,349 (+4%) | 11mo | $250,000 | $185 | 54 |
| 308 Morse St | 0.11mi | 3/1.0 (-1) | 1,484 (+15%) | 11mo | $180,000 | $121 | 52 |
| 6827 Highland Ave | 0.58mi | 3/2.0 (-1) | 1,188 (-8%) | 11mo | $320,000 | $269 | 45 |
| 2825 Thompson St | 0.66mi | 3/2.0 (-1) | 1,144 (-12%) | 8mo | $150,000 | $131 | 39 |
| 1553 Wildwood Ave | 0.69mi | 3/2.0 (-1) | 1,440 (+12%) | 10mo | $128,000 | $89 | 36 |
| 1243 Magnolia Ave | 0.74mi | 3/1.0 (-1) | 1,460 (+13%) | 6mo | $115,000 | $79 | 30 |
| 1460 Belleview Ave | 0.73mi | 3/1.0 (-1) | 1,483 (+15%) | 12mo | $194,000 | $131 | 22 |
Match score weights: distance 35% · size 25% · config 20% · recency 20%. Top-matched comps best support the ARV.
Projected returns pro-forma
-3.0% appreciation · 3.0% rent growth · sell at horizon
- IRR
- -3.6%
- Equity multiple
- 0.87×
- Total profit
- $-6,558
- Equity at exit
- $26,078
- IRR
- 6.1%
- Equity multiple
- 1.46×
- Total profit
- $22,461
- Equity at exit
- $15,122
Cash invested: $48,972 (down + closing). Projections, not guarantees.
Landlord ↔ Tenant lean methodology
- Overall (STATE)
- 21 Tenant-Leaning
- State New Jersey
- 21 Tenant-Leaning · D+6
- County
- — inherits STATE
- City
- — inherits STATE
ZIP-level market 08105
- Home prices YoY
- -30.6%
- Active inventory
- 59
- Price-to-rent
- 7.3×
Monthly cashflow live
- Estimated rent
- $1,991 high interval (Pro) →
- Mortgage (P&I)
- −$917
- Tax from tax record
- −$241 /mo · $2,898/yr
- Insurance
- −$73
- HOA
- −$0
- Vacancy / Maint / Mgmt
- −$418
- Net cashflow
- $341
Break-even live
UW: 25.0% down · 7.5% · 30yr · 1.5% tax · 5.0% vac · 8.0% maint · 8.0% mgmt
Financing live
Cash to close
- Down payment
- $43,725
- Closing costs
- $5,247
- Reserves months
- —
- Total cash needed
- —
Loan-product check · same deal, 3 products live
Conventional
25% down · 7.5% · 30yr
- Down + closing
- —
- Monthly P&I
- —
- Monthly cashflow
- —
- DSCR
- —
- Eligible?
- —
Personal DTI + credit; lowest rate.
DSCR
20% down · 8.5% · 30yr
- Down + closing
- —
- Monthly P&I
- —
- Monthly cashflow
- —
- DSCR
- —
- Eligible?
- —
No personal income docs; deal must DSCR.
Hard money
10% down · 12.0% · 12mo
- Down + closing
- —
- Monthly P&I
- —
- Monthly cashflow
- —
- DSCR
- —
- Eligible?
- —
Short-term bridge; refi at stabilization.
Rent comps 9 comps
| Address | Beds | Baths | Sqft | Rent | $/sqft | DOM | Units | Dist |
|---|---|---|---|---|---|---|---|---|
| 2752 Mickle St Camden, NJ | 3.0 | 1.0 | 1450 | $1,850 | $1.28 | 16d | 1 | 0.35mi |
| 324 S 27th St Camden, NJ | 3.0 | 1.0 | 1152 | $1,900 | $1.65 | 24d | 1 | 0.37mi |
| 1455 Wildwood Ave Camden, NJ | 3.0 | 1.5 | 1353 | $1,900 | $1.40 | 10d | 1 | 0.81mi |
| 1055 Kenwood Ave Camden, NJ | 4.0 | 1.0 | 1088 | $1,875 | $1.72 | 24d | 1 | 0.93mi |
| 106 N 34th St Unit B Camden, NJ | 3.0 | 2.0 | 900 | $1,950 | $2.17 | 24d | 1 | 0.96mi |
| 4621 Woodland Ave Pennsauken, NJ | 3.0 | 1.5 | 1148 | $2,200 | $1.92 | 24d | 1 | 1.13mi |
| 708 Royden St Camden, NJ | 3.0 | 1.0 | 1113 | $1,595 | $1.43 | 17d | 1 | 1.39mi |
| 5122 Garfield Ave Pennsauken, NJ | 3.0 | 1.0 | 1308 | $2,500 | $1.91 | 24d | 1 | 1.44mi |
| 221 Haddon Ave Collingswood, NJ | 4.0 | 2.0 | 1744 | $3,100 | $1.78 | 3d | 1 | 1.48mi |
Listing history 12 events
-
2026-04-02status Pending
-
2026-03-04$174,900 Active
-
2022-05-16status Pending
-
2022-05-13historical
-
2022-05-13historical
-
2022-05-03$104,995 Active
-
2011-07-31historical
-
2011-01-21$95,000
-
2010-12-21historical
-
2010-07-01$103,990
-
1986-12-11soldstatus $30,900
-
1983-10-01soldstatus $20,350
ⓘ Source: listings_history table (triggers on properties + properties_extension) + one-shot
backfill from property_details.listing_events for pre-trigger history.
Tax reassessment forecast NJ · Partial reset (capped growth)
- Current annual tax
- $2,898 · $241/mo
- Projected year-2 tax
- $3,626 · $302/mo
- Expected delta
- +$729/yr (+$61/mo · 25.1%)
ⓘ Screening estimate from a state-policy table — verify with the county assessor before closing.
Climate risk First Street
- Flood 4/10 Moderate FEMA zone X (shaded) · 23% chance over 30 yrs
- Wildfire 1/10 Low
- Heat 7/10 Severe 7 d/yr ≥104°F today · 15 d/yr by 30 yrs out
- Wind 6/10 Major 27% chance of damaging wind over 30 yrs
- Air quality 4/10 Moderate 5 unhealthy d/yr today · 6 by 30 yrs out
Nearby sold comps map
Loading sold comps map…
Walkable amenities ~0.75 mi
Loading nearby amenities…
Taxation est. · year 1
- Rental income
- $23,892
- − Mortgage interest
- −$9,797
- − Property taxes
- −$2,898
- − Insurance
- −$874
- − Repairs & maintenance
- −$1,911
- − Management
- −$1,911
- − Depreciation
- −$5,088
- Taxable income
- $1,412
- Est. tax owed @ 24.0%
- −$339
- After-tax cash flow
- $3,757/yr
For passive investors: Depreciation is non-cash, so a rental often shows a tax loss while cash-flowing — sheltering income. Rental losses are passive: they offset passive income freely, and up to $25,000/yr can offset ordinary (W-2) income if you actively participate and your MAGI is under $100k (phasing out to $0 by $150k); unused losses carry forward. On sale, claimed depreciation is recaptured at up to 25%, and gains may owe capital-gains tax (a 1031 exchange can defer both). Figures are a year-1 estimate at your 24.0% rate — not tax advice; consult a CPA.
Schools (NCES district)
- District
- Camden City School District
- NCES district ID
- 3402640
- Math proficiency
- 3% ▼ -6.00%
- Reading proficiency
- 16% ▬ 0.00%
- Median HH income
- $25,845
- Composite
- 6.85/100
- National rank
- #9981
- State rank
- #472 of 472 in NJ
Livability — Camden
- Score
- 70/100
- State rank
- #262
- US rank
- #7721
Category grades
Schools grade is shown separately in the Schools card above.
Census & demographics
- Census place
- Camden, NJ
- City population
- 20,865
- Population (ZIP)
- 26,681
Population outlook (Camden County) Hauer SSP2
- Today (2025)
- 507,964 people
- By 2030
- 502,182 · -1.1%
- By 2040
- 485,602 · -4.4%
- By 2050
- 465,630 · -8.3%
- By 2075
- 419,986 · -17.3%
- By 2100
- 369,492 · -27.3%
Race, ethnicity, and origin ACS 2023
- Neighborhood character
- Predominantly Hispanic (71%)
- Race & ethnicity
- Hispanic / Latino 71% Black 24% Two or more races 11% Asian 2% White 1% Native American 1%
- Hispanic origin (detail)
- Mexican 9% Puerto Rican 33% Dominican 20%
- Common ancestry
- Russian 1%
- Foreign-born
- 28% · Canada, Vietnam
- Languages at home
- 36% English-only · Spanish 59% French/Haitian/Cajun 2% Vietnamese 1%
Political lean MEDSL · Camden
- 2024 margin
- Strong D (+27.4) · D 63.0% · R 35.5% · Other 1.5%
- 2008→2024 swing
- -8.8pp toward R · 2008: 36.2pp · 2024: 27.4pp
- All cycles
- 2024: D+27.4 2020: D+33.5 2016: D+32.4 2012: D+36.6 2008: D+36.2
Not yet ingested
- Civics
- —
Market trends
- HPI YoY
- ▼ -130.41%
- Current HPI
- 295.6492
- Rent YoY
- —
- Metro
- —
- State GDP YoY
- ▲ 2.05%
- F500 in state
- 34
Industry mix (Fortune 500 HQ in NJ)
| Industry | F500 HQs | Revenue |
|---|---|---|
| Consumer Goods | 3 | $31B |
|
||
| Pharmaceuticals | 2 | $153B |
|
||
| Technology | 2 | $21B |
|
||
| Insurance | 2 | $20B |
|
||
| Healthcare | 2 | $19B |
|
||
| Financial Services | 1 | $70B |
|
||
Price history
+759.5% since first listed12 events — show timeline
- 2026-04-02 Pending — BRIGHT MLS
- 2026-03-04 Listed $174,900 BRIGHT MLS
- 2022-05-16 Pending — BRIGHT MLS
- 2022-05-13 Listing Removed — BRIGHT MLS
- 2022-05-13 Listing Removed — BRIGHT MLS
- 2022-05-03 Listed $104,995 BRIGHT MLS
- 2011-07-31 Listing Removed — BRIGHT MLS
- 2011-01-21 Listed $95,000 BRIGHT MLS
- 2010-12-21 Listing Removed — BRIGHT MLS
- 2010-07-01 Listed $103,990 BRIGHT MLS
- 1986-12-11 Sold (Public Records) $30,900 Public Records
- 1983-10-01 Sold (Public Records) $20,350 Public Records
Property tax history
+3.1%/yrLatest (2025): $2,898 · +4.1% YoY. Source: county tax records.
Cash-flow waterfall
monthlySold comps — $/sqft
last 12 mo · ≤1 miLoading sold comps…