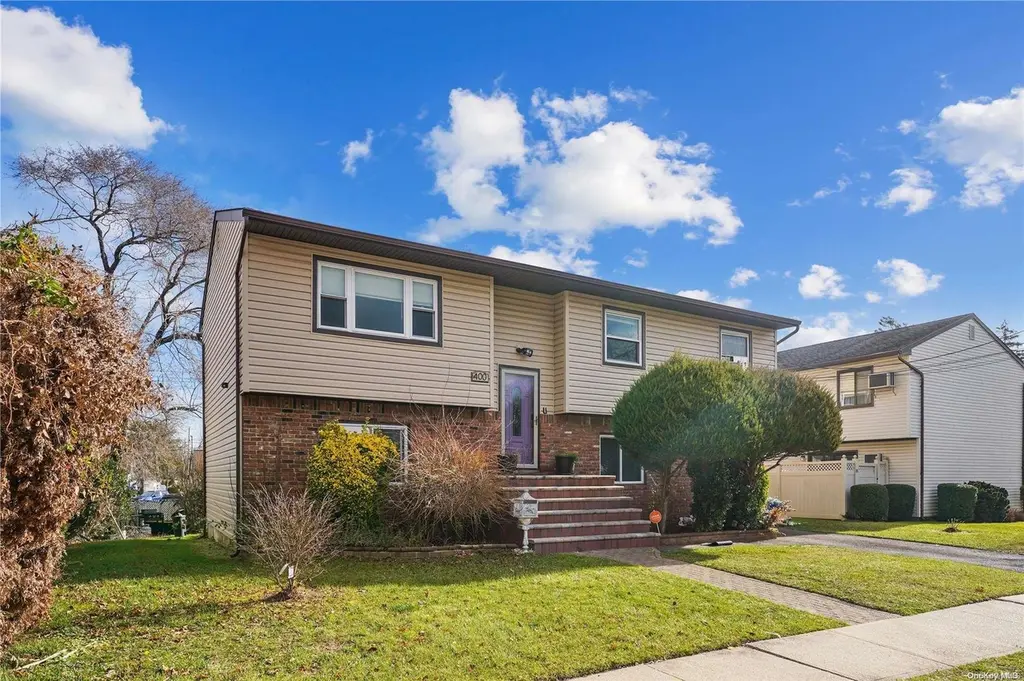
400 North Columbus A · Freeport, NY
Flood risk 1/10 · Minimal
- FEMA flood zone
- X (unshaded)
- Chance of flooding over 30 yrs
- 0.0%
- Est. flood insurance / yr
- $473 – $860
Fire risk 1/10 · Minimal
- Est. fire insurance / yr
- $691 – $1,283
Heat risk 6/10 · Moderate
- Hot days now (above 95°F)
- 7 days/yr
- Hot days in 30 yrs
- 16 days/yr
Wind risk 6/10 · Moderate
- Chance of severe wind over 30 yrs
- 72.0%
Air-quality risk 4/10 · Minor
- Unhealthy air days now
- 5 days/yr
- Unhealthy air days in 30 yrs
- 8 days/yr
Risk factors via First Street. Map © Google.
Why this score? — see what drove the D+ grade
The composite is a weighted blend of 9 inputs, each scored 0–100. Each bar is that input's sub-score; the figure is the points it added to the 100-point composite (weight × sub-score).
- ARV discount +15.0/15.0
- Cash flow +14.0/30.0
- DSCR +4.2/10.0
- Livability +4.2/5.0
- 1% rule +3.5/10.0
- Schools +3.3/10.0
- Rent growth +2.5/5.0
- Condition / age +2.5/5.0
- Appreciation +0.0/10.0
$599,999
🖨 Deal sheet (PDF) 📄 Offer letter ✓ Due diligence
Listing remarks
Take advantage of this beautiful split level mother and daughter set up. Perfectly located a few minutes the famous Nautical Mile and only 35 minutes to Penn Station and Grand Central on the LIRR. This property features 5 oversized bedrooms a wrap around kitchen, which makes it prefect when entertaining family and guest. The 2 full bath are strategically located one on each level. The half grass and half concrete back yard makes it prefect for a bbq. Looking for extra space? Check out the attic along with the garage, which has enough space for your car and storing all your tools. Take advantage of the lower rates and the shortage of properties on the market. This won't last
Key facts
- 5,841 sq ft lot
- Built 1987
- Listed 47 days
Neighborhood map
What this means for you Summary
Snapshot
- This is a 5-bed/2.0-bath single-family listed at $600k.
Deal economics
- At list price, monthly cash flow is $74 ($888/yr) — positive.
- The deal already cash-flows at list — no discount required.
- To meet the 1% rule (rent ≥ 1% of price), the offer needs to be $510k (15.0% below list).
- Recommended offer: $510k (15.0% below list) — sets the bar for 1% rule.
- Cap rate 6.4% vs local median 3.0% in Freeport — top-decile yield for the area; either an underpriced asset or a hidden risk that comps aren't pricing in. Stress-test before assuming the spread holds.
Location & tenants
- Location reads 83/100 on livability (#69 in NY, #1,033 nationally) — a professional / high-income tenant draw. Strengths: commute A+, employment A+, housing A+; Watch: cost of living F.
- Roosevelt Union Free School District (suburban): math 28% / reading 45% proficiency, ranked #529 of 590 in NY (top 90%) — families likely to look elsewhere, expect single-tenant / working-renter base with shorter leases.
- Zoned schools: Roosevelt Middle School (math 12% / reading 27%, grade F, #685 of 729 statewide, top 94%, 455 students, 0% FRL); Roosevelt High School (math 65% / reading 78%, grade B+, #698 of 1,100 statewide, top 63%, 1,075 students, 59% FRL) — zoned schools average 30% FRL vs 58% district-wide (29 pts lower); this property's tenant base skews higher-income than the district average.
- Market conditions: 199 active listings in the ZIP; 1 comparable units currently listed for rent nearby; 824 units permitted in Nassau County in 2024 (153 in 5+ unit buildings).
Forward outlook
- Local home prices are declining (-3.0%/yr); year-one equity from $4k of loan paydown is wiped out by about $18k of value loss. Plan a longer hold.
- Nassau County population projected at +7% by 2050 — modest demand growth; plan on rents tracking national, not racing it.
Negotiation context
- It's been on market 47 days — a 3% lower offer ($582k) is reasonable based on typical stale-listing flexibility.
Risks & watch-outs
- Climate carrying-cost: major wind risk, 72% chance of damaging wind over 30y; extreme-heat days projected 7→16/yr by 2055 (HVAC capex compounding) — expect insurance premiums to compound above CPI over the hold.
Questions for the listing agent
- It's been on market 47 days. Have you received any prior offers? Is the seller open to a 15% concession, seller financing, or rate buy-down credit?
- Is there a deadline driving the sale (1031 exchange, divorce, estate, relocation)? That informs how much negotiation room exists.
- Schools are B-rated — typically a magnet for longer-tenancy family renters. What's the average tenant stay here, and is there a school-zone premium baked into asking?
- The area grade is low — what's the realistic commute time and amenity access for the typical tenant pool here? Any planned neighborhood developments (good or bad) we should know about?
- What's the average days-on-market for RENTAL listings here right now (not sales)? A rising rental-DOM trend means longer vacancies and softer asking-rent achievability than the comps imply.
- What's the recent tenant-quality profile in this submarket — average credit score on applications, eviction rate, late-payment / NSF rate, and stable-employment percentage? A property-management company in the area should have these aggregated.
- How much new for-sale + rental construction is in the pipeline within 1–3 miles? Heavy new supply typically softens prices + rents 12–24 months out; constrained supply supports both.
Investment metrics
- 1% rule
- 0.85% ✗
- Cap rate
- 6.44%
- Cash-on-cash
- 0.53%
- DSCR
- 1.02
- GRM
- 9.8
CMA / ARV
- ARV (on-the-fly)
- $726,432
- Comps found
- 12
Show comp detail 12 sales within ~0.75 mi
| Address | Dist | Beds/Ba | Sqft | Sold | Price | $/sf | Match |
|---|---|---|---|---|---|---|---|
| 142 Gormley Ave | 0.33mi | 5/2.0 | 1,930 (-2%) | 6mo | $730,000 | $378 | 76 |
| 114 Frederick Ave | 0.32mi | 5/2.0 | 2,037 (+3%) | 5mo | $750,000 | $368 | 76 |
| 70 Saint Francis St | 0.14mi | 6/2.0 (+1) | 1,892 (-4%) | 10mo | $660,000 | $349 | 73 |
| 54 Westfield Ave | 0.14mi | 4/2.0 (-1) | 1,792 (-9%) | 6mo | $628,000 | $350 | 68 |
| 29 Colonial Ave | 0.34mi | 4/2.5 (-1) | 2,087 (+6%) | 0mo | $850,000 | $407 | 67 |
| 85 Bedford Ave | 0.29mi | 5/2.0 | 2,199 (+11%) | 1mo | $780,000 | $355 | 66 |
| 221 E Dean St | 0.49mi | 5/2.0 | 1,829 (-7%) | 3mo | $675,000 | $369 | 62 |
| 67 Harts Ave | 0.61mi | 5/2.0 | 2,074 (+5%) | 4mo | $735,000 | $354 | 60 |
| 8 Bainbridge St | 0.34mi | 4/2.5 (-1) | 1,852 (-6%) | 8mo | $720,000 | $389 | 60 |
| 64 W Milton St | 0.71mi | 4/2.0 (-1) | 1,922 (-3%) | 6mo | $755,000 | $393 | 53 |
| 41 W Fulton Ave | 0.58mi | 4/1.0 (-1) | 2,099 (+6%) | 2mo | $560,000 | $267 | 52 |
| 146 Lincoln Ave | 0.67mi | 5/3.0 | 2,156 (+9%) | 4mo | $735,000 | $341 | 46 |
Match score weights: distance 35% · size 25% · config 20% · recency 20%. Top-matched comps best support the ARV.
Projected returns pro-forma
-3.0% appreciation · 3.0% rent growth · sell at horizon
- IRR
- -15.5%
- Equity multiple
- 0.45×
- Total profit
- $-92,554
- Equity at exit
- $89,462
- IRR
- -7.0%
- Equity multiple
- 0.56×
- Total profit
- $-74,693
- Equity at exit
- $51,877
Cash invested: $168,000 (down + closing). Projections, not guarantees.
Landlord ↔ Tenant lean methodology
- Overall (STATE)
- 15 Strongly Tenant-Friendly
- State New York
- 15 Strongly Tenant-Friendly · D+10
- County
- — inherits STATE
- City
- — inherits STATE
ZIP-level market 11520
- Active inventory
- 199
- Price-to-rent
- 9.8×
Monthly cashflow live
- Estimated rent
- $5,100 medium interval (Pro) →
- Mortgage (P&I)
- −$3,146
- Tax from tax record
- −$559 /mo · $6,703/yr
- Insurance
- −$250
- HOA
- −$0
- Vacancy / Maint / Mgmt
- −$1,071
- Net cashflow
- $74
Break-even live
Sensitivity live
| Price | -10% $414 | -5% $244 | +0% $74 | +5% $-96 | +10% $-266 |
|---|---|---|---|---|---|
| Rent | -10% $-329 | -5% $-127 | +0% $74 | +5% $275 | +10% $477 |
| Rate | -1.0pp $376 | -0.5pp $227 | base $74 | +0.5pp $-81 | +1.0pp $-240 |
UW: 25.0% down · 7.5% · 30yr · 1.5% tax · 5.0% vac · 8.0% maint · 8.0% mgmt
Financing live
Cash to close
- Down payment
- $150,000
- Closing costs
- $18,000
- Reserves months
- —
- Total cash needed
- —
Loan-product check · same deal, 3 products live
Conventional
25% down · 7.5% · 30yr
- Down + closing
- —
- Monthly P&I
- —
- Monthly cashflow
- —
- DSCR
- —
- Eligible?
- —
Personal DTI + credit; lowest rate.
DSCR
20% down · 8.5% · 30yr
- Down + closing
- —
- Monthly P&I
- —
- Monthly cashflow
- —
- DSCR
- —
- Eligible?
- —
No personal income docs; deal must DSCR.
Hard money
10% down · 12.0% · 12mo
- Down + closing
- —
- Monthly P&I
- —
- Monthly cashflow
- —
- DSCR
- —
- Eligible?
- —
Short-term bridge; refi at stabilization.
Rent comps 1 comps
| Address | Beds | Baths | Sqft | Rent | $/sqft | DOM | Units | Dist |
|---|---|---|---|---|---|---|---|---|
| 1526 Rhode Ave Merrick, NY | 4.0 | 2.0 | 1344 | $5,100 | $3.79 | 0d | 1 | 1.03mi |
Listing history 4 events
-
2024-04-26soldstatus $625,000
-
2024-02-19status Pending
-
2024-01-03$599,999 Active
-
1996-04-10soldstatus $119,000
ⓘ Source: listings_history table (triggers on properties + properties_extension) + one-shot
backfill from property_details.listing_events for pre-trigger history.
Tax reassessment forecast NY · Partial reset (capped growth)
- Current annual tax
- $6,703 · $559/mo
- Projected year-2 tax
- $8,421 · $702/mo
- Expected delta
- +$1,719/yr (+$143/mo · 25.6%)
ⓘ Screening estimate from a state-policy table — verify with the county assessor before closing.
Climate risk First Street
- Flood 1/10 Low FEMA zone X (unshaded) · 0% chance over 30 yrs
- Wildfire 1/10 Low
- Heat 6/10 Major 7 d/yr ≥95°F today · 16 d/yr by 30 yrs out
- Wind 6/10 Major 72% chance of damaging wind over 30 yrs
- Air quality 4/10 Moderate 5 unhealthy d/yr today · 8 by 30 yrs out
Nearby sold comps map
Loading sold comps map…
Walkable amenities ~0.75 mi
Loading nearby amenities…
Taxation est. · year 1
- Rental income
- $61,200
- − Mortgage interest
- −$33,609
- − Property taxes
- −$6,703
- − Insurance
- −$3,000
- − Repairs & maintenance
- −$4,896
- − Management
- −$4,896
- − Depreciation
- −$17,455
- Taxable loss
- −$9,358
- Est. tax savings @ 24.0%
- +$2,246
- After-tax cash flow
- $3,134/yr
For passive investors: Depreciation is non-cash, so a rental often shows a tax loss while cash-flowing — sheltering income. Rental losses are passive: they offset passive income freely, and up to $25,000/yr can offset ordinary (W-2) income if you actively participate and your MAGI is under $100k (phasing out to $0 by $150k); unused losses carry forward. On sale, claimed depreciation is recaptured at up to 25%, and gains may owe capital-gains tax (a 1031 exchange can defer both). Figures are a year-1 estimate at your 24.0% rate — not tax advice; consult a CPA.
Schools (NCES district)
- District
- Roosevelt Union Free School District
- NCES district ID
- 3624990
- Math proficiency
- 28% ▼ -4.00%
- Reading proficiency
- 45% ▲ 6.00%
- Median HH income
- $69,717
- Composite
- 33.41/100
- National rank
- #5472
- State rank
- #529 of 590 in NY
Livability — Freeport
- Score
- 83/100
- State rank
- #69
- US rank
- #1033
Category grades
Schools grade is shown separately in the Schools card above.
Census & demographics
- Census place
- Freeport, NY
- City population
- 44,873
- Population (ZIP)
- 44,873
Population outlook (Nassau County) Hauer SSP2
- Today (2025)
- 1,409,302 people
- By 2030
- 1,431,482 · +1.6%
- By 2040
- 1,471,607 · +4.4%
- By 2050
- 1,502,845 · +6.6%
- By 2075
- 1,575,403 · +11.8%
- By 2100
- 1,554,356 · +10.3%
Race, ethnicity, and origin ACS 2023
- Neighborhood character
- Diverse neighborhood (Simpson 0.67)
- Race & ethnicity
- Hispanic / Latino 43% Black 33% White 19% Two or more races 17% Asian 2%
- Hispanic origin (detail)
- Puerto Rican 4% Dominican 15%
- Common ancestry
- Hispanic 5% Scotch-Irish 1% Romanian 1%
- Foreign-born
- 34% · Canada, Jamaica, Guatemala
- Languages at home
- 55% English-only · Spanish 38% French/Haitian/Cajun 3% Other Indo-European 1%
Political lean MEDSL · Nassau
- 2024 margin
- Toss-up / Even · D 47.9% · R 52.1%
- 2008→2024 swing
- -12.6pp toward R · 2008: 8.4pp · 2024: -4.2pp
- All cycles
- 2024: R+4.2 2020: D+9.5 2016: D+5.3 2012: D+6.7 2008: D+8.4
Not yet ingested
- Civics
- —
Market trends
- HPI YoY
- ▼ -721.06%
- Current HPI
- 317.6076
- Rent YoY
- —
- Metro
- —
- State GDP YoY
- ▲ 2.60%
- F500 in state
- 92
Industry mix (Fortune 500 HQ in NY)
| Industry | F500 HQs | Revenue |
|---|---|---|
| Financial Services | 10 | $950B |
|
||
| Consumer Goods | 9 | $162B |
|
||
| Insurance | 4 | $225B |
|
||
| Telecommunications | 2 | $144B |
|
||
| Pharmaceuticals | 2 | $112B |
|
||
| Media / Entertainment | 2 | $69B |
|
||
Price history
+425.2% since first listed4 events — show timeline
- 2024-04-26 Sold (Public Records) $625,000 Public Records
- 2024-02-19 Pending — OneKey® MLS as Distributed by MLS Grid
- 2024-01-03 Listed $599,999 OneKey® MLS as Distributed by MLS Grid
- 1996-04-10 Sold (Public Records) $119,000 Public Records
Property tax history
+2.1%/yrLatest (2024): $6,703 · +6.8% YoY. Source: county tax records.
Cash-flow waterfall
monthlySold comps — $/sqft
last 12 mo · ≤1 miLoading sold comps…