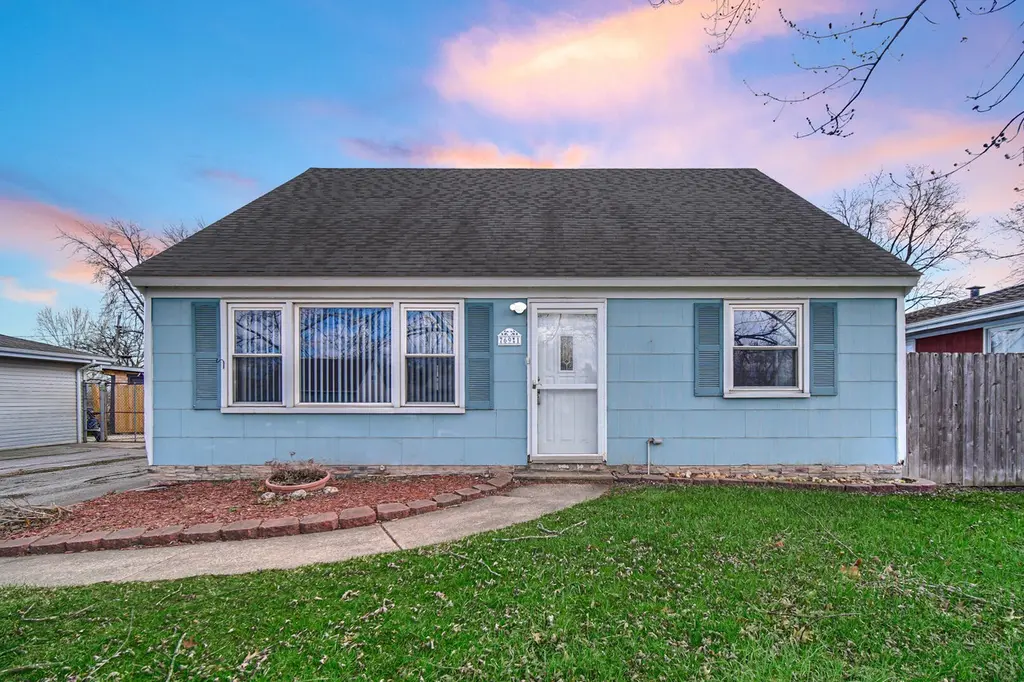
769-1 Juniper Rd · South Haven, IN
Flood risk 1/10 · Minimal
- FEMA flood zone
- X (unshaded)
- Chance of flooding over 30 yrs
- 0.0%
- Est. flood insurance / yr
- $507 – $1,088
Fire risk 1/10 · Minimal
- Est. fire insurance / yr
- $717 – $1,331
Heat risk 2/10 · Minimal
- Hot days now (above 101°F)
- 7 days/yr
- Hot days in 30 yrs
- 15 days/yr
Wind risk 2/10 · Minimal
- Chance of severe wind over 30 yrs
- —
Air-quality risk 2/10 · Minimal
- Unhealthy air days now
- 1 days/yr
- Unhealthy air days in 30 yrs
- 2 days/yr
Risk factors via First Street. Map © Google.
Why this score? — see what drove the D+ grade
The composite is a weighted blend of 9 inputs, each scored 0–100. Each bar is that input's sub-score; the figure is the points it added to the 100-point composite (weight × sub-score).
- Cash flow +18.3/30.0
- ARV discount +9.3/15.0
- DSCR +5.8/10.0
- 1% rule +3.9/10.0
- Livability +3.6/5.0
- Schools +2.7/10.0
- Rent growth +2.5/5.0
- Condition / age +2.5/5.0
- Appreciation +0.0/10.0
$227,900
🖨 Deal sheet 📄 Offer letter ✓ Due diligence
Listing remarks MLS
Welcome home to this charming 1 1/2 story residence offering comfort and character throughout. Featuring 2 bathrooms and a convenient 1-car detached garage, this home provides a perfect blend of functionality and cozy living. A wonderful opportunity to make it your own!
Key facts
- 6,500 sq ft lot
- Garage
- Built 1965
Neighborhood map
What this means for you Summary
Snapshot
- This is a 4-bed/1.5-bath single-family listed at $228k.
Deal economics
- At list price, monthly cash flow is $210 ($3k/yr) — positive.
- The deal already cash-flows at list — no discount required.
- To meet the 1% rule (rent ≥ 1% of price), the offer needs to be $204k (10.6% below list).
- Recommended offer: $204k (10.6% below list) — sets the bar for 1% rule.
Location & tenants
- Location reads 72/100 on livability (#119 in IN) — a middle-class / working-renter tenant base. Strengths: cost of living A+, housing A+, health & safety A; Watch: amenities F, commute F.
- Portage Township Schools (suburban): math 26% / reading 36% proficiency, ranked #221 of 301 in IN (top 73%) — families likely to look elsewhere, expect single-tenant / working-renter base with shorter leases.
- Market conditions: 375 active listings in the ZIP; solid renter incomes; 542 units permitted in Porter County in 2024 (0 in 5+ unit buildings).
Forward outlook
- Local home prices are declining (-3.0%/yr); year-one equity from $2k of loan paydown is wiped out by about $7k of value loss. Plan a longer hold.
- Porter County population projected at +6% by 2050 — modest demand growth; plan on rents tracking national, not racing it.
Negotiation context
- It's been on market 84 days — a 6% lower offer ($214k) is reasonable based on typical stale-listing flexibility.
- 2 sale attempts since 13y ago with the ask held roughly flat each time — persistent listings suggest the price (not the market) is what's stuck; bring a comps-based counter.
- Current owner paid $70k; list at $228k implies a 226% gain — meaningful room to come down on a strong offer.
Questions for the listing agent
- It's been on market 84 days. Have you received any prior offers? Is the seller open to a 11% concession, seller financing, or rate buy-down credit?
- Built in 1965 — when were the roof, HVAC, electrical panel, plumbing, and water heater last replaced?
- Why hasn't it sold? Are there any deal-killer items the seller is aware of (foundation, flood, title, zoning, code violations)?
- Is there a deadline driving the sale (1031 exchange, divorce, estate, relocation)? That informs how much negotiation room exists.
- The area grade is low — what's the realistic commute time and amenity access for the typical tenant pool here? Any planned neighborhood developments (good or bad) we should know about?
- What's the average days-on-market for RENTAL listings here right now (not sales)? A rising rental-DOM trend means longer vacancies and softer asking-rent achievability than the comps imply.
- What's the recent tenant-quality profile in this submarket — average credit score on applications, eviction rate, late-payment / NSF rate, and stable-employment percentage? A property-management company in the area should have these aggregated.
- How much new for-sale + rental construction is in the pipeline within 1–3 miles? Heavy new supply typically softens prices + rents 12–24 months out; constrained supply supports both.
Investment metrics
- 1% rule
- 0.89% ✗
- Cap rate
- 7.40%
- Cash-on-cash
- 3.94%
- DSCR
- 1.18
- GRM
- 9.3
CMA / ARV
- ARV (median comp)
- $237,348
- List price
- $227,900
- Delta
- -3.98%
- Verdict
- FAIR
- Comps
- 20 within 1.0 mi
Show comp detail 12 sales within ~0.75 mi
| Address | Dist | Beds/Ba | Sqft | Sold | Price | $/sf | Match |
|---|---|---|---|---|---|---|---|
| 756 Imperial Rd | 0.05mi | 4/2.0 | 2,184 (+3%) | 1mo | $239,000 | $109 | 90 |
| 397 W Millport Dr | 0.36mi | 4/2.5 | 2,088 (-1%) | 3mo | $267,900 | $128 | 75 |
| 753 Imperial Rd | 0.09mi | 4/2.0 | 1,920 (-9%) | 5mo | $226,000 | $118 | 75 |
| 726 Fremont Rd | 0.32mi | 4/2.0 | 2,236 (+6%) | 1mo | $225,000 | $101 | 73 |
| 765 Governor Rd | 0.19mi | 4/2.0 | 1,920 (-9%) | 2mo | $239,900 | $125 | 72 |
| 734 1 Juniper Rd | 0.24mi | 4/2.0 | 1,920 (-9%) | 3mo | $210,000 | $109 | 69 |
| 388 Sycamore Dr | 0.27mi | 3/2.5 (-1) | 2,000 (-5%) | 6mo | $265,000 | $133 | 64 |
| 746-1 Capitol Rd | 0.42mi | 4/1.5 | 1,920 (-9%) | 7mo | $240,000 | $125 | 60 |
| 723 Fox River Rd | 0.42mi | 4/2.0 | 1,872 (-11%) | 2mo | $251,000 | $134 | 58 |
| 382 Pinewood Dr | 0.53mi | 4/2.0 | 1,912 (-10%) | 1mo | $285,000 | $149 | 57 |
| 392 Stonehill Dr | 0.50mi | 4/2.0 | 1,872 (-11%) | 4mo | $225,000 | $120 | 53 |
| 695 Cross Meadows Dr | 0.68mi | 4/3.0 | 2,000 (-5%) | 2mo | $360,000 | $180 | 52 |
Match score weights: distance 35% · size 25% · config 20% · recency 20%. Top-matched comps best support the ARV.
Projected returns pro-forma
-3.0% appreciation · 3.0% rent growth · sell at horizon
- IRR
- -10.2%
- Equity multiple
- 0.63×
- Total profit
- $-23,658
- Equity at exit
- $33,981
- IRR
- -0.8%
- Equity multiple
- 0.94×
- Total profit
- $-3,725
- Equity at exit
- $19,705
Cash invested: $63,812 (down + closing). Projections, not guarantees.
Landlord ↔ Tenant lean methodology
- Overall (STATE)
- 90 Strongly Landlord-Friendly
- State Indiana
- 90 Strongly Landlord-Friendly · R+11
- County
- — inherits STATE
- City
- — inherits STATE
ZIP-level market 46385
- Active inventory
- 375
- Price-to-rent
- 9.3×
Monthly cashflow live
- Estimated rent
- $2,038 medium interval (Pro) →
- Mortgage (P&I)
- −$1,195
- Tax from tax record
- −$110 /mo · $1,321/yr
- Insurance
- −$95
- HOA
- −$0
- Vacancy / Maint / Mgmt
- −$428
- Net cashflow
- $210
Break-even live
UW: 25.0% down · 7.5% · 30yr · 1.5% tax · 5.0% vac · 8.0% maint · 8.0% mgmt
Financing live
Cash to close
- Down payment
- $56,975
- Closing costs
- $6,837
- Reserves months
- —
- Total cash needed
- —
Loan-product check · same deal, 3 products live
Conventional
25% down · 7.5% · 30yr
- Down + closing
- —
- Monthly P&I
- —
- Monthly cashflow
- —
- DSCR
- —
- Eligible?
- —
Personal DTI + credit; lowest rate.
DSCR
20% down · 8.5% · 30yr
- Down + closing
- —
- Monthly P&I
- —
- Monthly cashflow
- —
- DSCR
- —
- Eligible?
- —
No personal income docs; deal must DSCR.
Hard money
10% down · 12.0% · 12mo
- Down + closing
- —
- Monthly P&I
- —
- Monthly cashflow
- —
- DSCR
- —
- Eligible?
- —
Short-term bridge; refi at stabilization.
Listing history 18 events
-
2026-06-18days on market $227,900 Active 84 DOM
-
2026-06-17days on market $227,900 Active 83 DOM
-
2026-06-16days on market $227,900 Active 82 DOM
-
2026-06-15days on market $227,900 Active 81 DOM
-
2026-06-13days on market $227,900 Active 79 DOM
-
2026-06-13days on market $227,900 Active 78 DOM
-
2026-06-09days on market $227,900 Active 75 DOM
-
2026-06-08days on market $227,900 Active 74 DOM
-
2026-06-07days on market $227,900 Active 73 DOM
-
2026-06-04days on market $227,900 Active 70 DOM
-
2026-06-03days on market $227,900 Active 69 DOM
-
2026-06-02remarks 558-char remark
-
2026-06-02pricedays on market $227,900 Active 68 DOM
-
2026-06-01days on market $229,900 Active 67 DOM
-
2026-05-31days on market $229,900 Active 66 DOM
-
2026-03-26$229,900 Active 270-char remark
Show marketing remark (270 chars)
Welcome home to this charming 1 1/2 story residence offering comfort and character throughout. Featuring 2 bathrooms and a convenient 1-car detached garage, this home provides a perfect blend of functionality and cozy living. A wonderful opportunity to make it your own!
-
2013-09-16soldstatus $70,000 517-char remark
Show marketing remark (517 chars)
MOVE IN READY! 3 bed, 1.5 bath Ranch, fenced yard, huge custom built wood shed with back room, screened in porch with patio furniture. Kitchen appliances bought 9/2009 & older washer/gas dryer all included! 25 yr. roof shingles completed in 2009, new water heater 8/2011. This home also has a 4th room which can be used multiple ways. There's a half garage off the 4th room to store your motorcycle, snow blower & Ski-doo. Friendly, established neighbors. Close to everything! Make your appointment today!
-
2013-06-21$69,900 517-char remark
Show marketing remark (517 chars)
MOVE IN READY! 3 bed, 1.5 bath Ranch, fenced yard, huge custom built wood shed with back room, screened in porch with patio furniture. Kitchen appliances bought 9/2009 & older washer/gas dryer all included! 25 yr. roof shingles completed in 2009, new water heater 8/2011. This home also has a 4th room which can be used multiple ways. There's a half garage off the 4th room to store your motorcycle, snow blower & Ski-doo. Friendly, established neighbors. Close to everything! Make your appointment today!
ⓘ Source: listings_history table (triggers on properties + properties_extension) + one-shot
backfill from property_details.listing_events for pre-trigger history.
Tax reassessment forecast IN · Partial reset (capped growth)
- Current annual tax
- $1,321 · $110/mo
- Projected year-2 tax
- $1,629 · $136/mo
- Expected delta
- +$308/yr (+$26/mo · 23.3%)
ⓘ Screening estimate from a state-policy table — verify with the county assessor before closing.
Climate risk First Street
- Flood 1/10 Low FEMA zone X (unshaded) · 0% chance over 30 yrs
- Wildfire 1/10 Low
- Heat 2/10 Low 7 d/yr ≥101°F today · 15 d/yr by 30 yrs out
- Wind 2/10 Low
- Air quality 2/10 Low 1 unhealthy d/yr today · 2 by 30 yrs out
Nearby sold comps map
Loading sold comps map…
Walkable amenities ~0.75 mi
Loading nearby amenities…
Taxation est. · year 1
- Rental income
- $24,452
- − Mortgage interest
- −$12,766
- − Property taxes
- −$1,321
- − Insurance
- −$1,140
- − Repairs & maintenance
- −$1,956
- − Management
- −$1,956
- − Depreciation
- −$6,630
- Taxable loss
- −$1,317
- Est. tax savings @ 24.0%
- +$316
- After-tax cash flow
- $2,831/yr
For passive investors: Depreciation is non-cash, so a rental often shows a tax loss while cash-flowing — sheltering income. Rental losses are passive: they offset passive income freely, and up to $25,000/yr can offset ordinary (W-2) income if you actively participate and your MAGI is under $100k (phasing out to $0 by $150k); unused losses carry forward. On sale, claimed depreciation is recaptured at up to 25%, and gains may owe capital-gains tax (a 1031 exchange can defer both). Figures are a year-1 estimate at your 24.0% rate — not tax advice; consult a CPA.
Schools (NCES district)
- District
- Portage Township Schools
- NCES district ID
- 1809150
- Math proficiency
- 26% ▼ -15.00%
- Reading proficiency
- 36% ▼ -10.00%
- Median HH income
- $53,880
- Composite
- 27.37/100
- National rank
- #6978
- State rank
- #221 of 301 in IN
Livability — South Haven
- Score
- 72/100
- State rank
- #119
- US rank
- #6424
Category grades
Schools grade is shown separately in the Schools card above.
Census & demographics
- Census place
- South Haven, IN
- County
- Porter County · 151,647 people
- Metro
- Chicago-Naperville-Elgin, IL-IN-WI
- Population (ZIP)
- 40,856
- Household income
- $98,957
- Rent vs Own
- Severe rent burden
- 304.0
Population outlook (Porter County) Hauer SSP2
- Today (2025)
- 177,804 people
- By 2030
- 181,552 · +2.1%
- By 2040
- 185,830 · +4.5%
- By 2050
- 187,498 · +5.5%
- By 2075
- 189,585 · +6.6%
- By 2100
- 183,722 · +3.3%
Race, ethnicity, and origin ACS 2023
- Neighborhood character
- Predominantly White (83%)
- Race & ethnicity
- White 83% Hispanic / Latino 9% Two or more races 7% Black 2% Asian 2%
- Hispanic origin (detail)
- Mexican 6% Puerto Rican 2%
- Common ancestry
- Romanian 9% Italian 2% Lithuanian 2%
- Foreign-born
- 3% · Canada, Philippines
- Languages at home
- 94% English-only · Spanish 2% Other Indo-European 1% Russian/Polish/Slavic 1%
Political lean MEDSL · Porter
- 2024 margin
- R (+10.5) · D 43.8% · R 54.3% · Other 1.8%
- 2008→2024 swing
- -17.7pp toward R · 2008: 7.2pp · 2024: -10.5pp
- All cycles
- 2024: R+10.5 2020: R+6.1 2016: R+6.8 2012: D+3.8 2008: D+7.2
Not yet ingested
- Civics
- —
Market trends
- HPI YoY
- ▼ -151.11%
- Current HPI
- 201.7039
- Rent YoY
- —
- Metro
- Chicago-Naperville-Elgin, IL-IN-WI
- State GDP YoY
- ▲ 2.90%
- F500 in state
- 18
Industry mix (Fortune 500 HQ in IN)
| Industry | F500 HQs | Revenue |
|---|---|---|
| Industrial Machinery | 2 | $37B |
|
||
| Healthcare | 1 | $177B |
|
||
| Pharmaceuticals | 1 | $45B |
|
||
| Metals / Steel | 1 | $18B |
|
||
| Agriculture | 1 | $17B |
|
||
| Packaging | 1 | $12B |
|
||
Price history
+228.9% since first listed3 events — show timeline
- 2026-03-26 Listed $229,900 NIRA MLS as Distributed by MLS Grid
- 2013-09-16 Sold (MLS) $70,000 NIRA MLS as Distributed by MLS Grid
- 2013-06-21 Listed $69,900 NIRA MLS as Distributed by MLS Grid
Property tax history
+6.0%/yrLatest (2024): $1,321 · +7.9% YoY. Source: county tax records.
Cash-flow waterfall
monthlySold comps — $/sqft
last 12 mo · ≤1 miLoading sold comps…