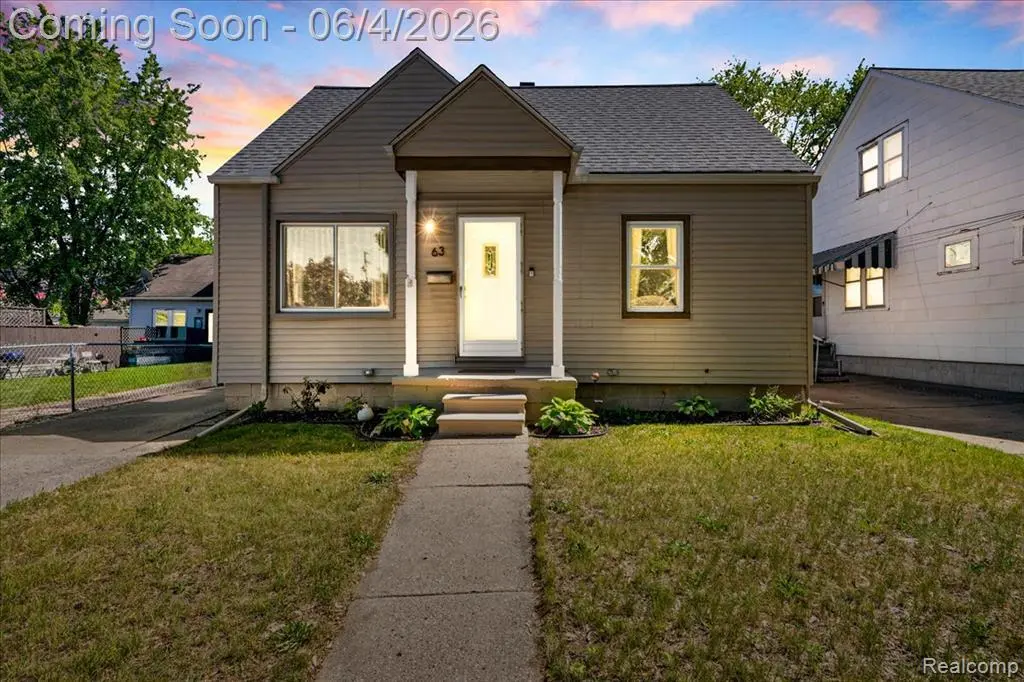
63 W Mahan Ave · Hazel Park, MI
Flood risk 1/10 · Minimal
- FEMA flood zone
- X (unshaded)
- Chance of flooding over 30 yrs
- 0.0%
- Est. flood insurance / yr
- $507 – $1,088
Fire risk 1/10 · Minimal
- Est. fire insurance / yr
- $784 – $1,456
Heat risk 3/10 · Minor
- Hot days now (above 97°F)
- 7 days/yr
- Hot days in 30 yrs
- 15 days/yr
Wind risk 2/10 · Minimal
- Chance of severe wind over 30 yrs
- —
Air-quality risk 3/10 · Minor
- Unhealthy air days now
- 3 days/yr
- Unhealthy air days in 30 yrs
- 5 days/yr
Risk factors via First Street. Map © Google.
Why this score? — see what drove the C+ grade
The composite is a weighted blend of 9 inputs, each scored 0–100. Each bar is that input's sub-score; the figure is the points it added to the 100-point composite (weight × sub-score).
- Cash flow +21.5/30.0
- ARV discount +15.0/15.0
- DSCR +6.9/10.0
- 1% rule +6.0/10.0
- Livability +4.0/5.0
- Rent growth +3.2/5.0
- Condition / age +2.5/5.0
- Schools +1.4/10.0
- Appreciation +0.0/10.0
$179,900
🖨 Deal sheet 📄 Offer letter ✓ Due diligence
Listing remarks MLS
Terrific North Hazel Park Home-- Updated 3 Bedroom Bungalow -- Light Filled Living Room & Kitchen with New Refrigerator & Stove also Dishwasher and Microwave, Generous Bedrooms, Renovated 1st Floor Full Bath and with Partially Finished Basement & Large 2 Car Garage, Garage Siding 2020 with New door and Opener. New Washer & Dryer, Laundry Tub-- Deep Basement ready to completely finish. Water Heater 2020 Make it Your Own New Home! * * Multiple offer deadline
Key facts
- 4,356 sq ft lot
- 2 garage spots
- Built 1942
Property features AI
Exterior
- Parking: Detached garage (22 x 24); Electric in garage; Garage door opener; 2 garage parking spaces
- Utilities: Public water; Natural gas service; Public sewer (implied by public water and typical utilities)
- Home design: Residential property; 1 1/2-story structure; Built in 1942; Basement foundation; Property allows pets; Subdivision: Buehler Farms; Frontage: 40 feet
- Construction: Aluminum and vinyl siding exterior
- Exterior features: Fenced yard; Patio; Paved street access
Interior
- Kitchen: Kitchen on the entry level (6 x 7); Dishwasher; Range/oven; Microwave; Refrigerator
- Bedrooms: Bedroom with 12 x 14 dimensions on the second level; Bedroom with 8 x 11 dimensions on the entry level; Bedroom (11' width) on the second level
- Flooring: Laminate in the living room; Concrete in the laundry room
- Bathrooms: One full bathroom (11 x 7) on the entry level
- Heating & cooling: Natural gas heating; Forced air heat; Ceiling fan(s) for cooling; Gas water heater
- Interior features: Total of 8 rooms; Partially finished basement
- Laundry & utility: Washer; Dryer; Basement laundry room (10 x 10) with concrete floor
Neighborhood map
What this means for you Summary
Snapshot
- This is a 3-bed/1.0-bath single-family listed at $180k.
Deal economics
- At list price, monthly cash flow is $271 ($3k/yr) — positive.
- The deal already cash-flows at list — no discount required.
- Meets the 1% rule at list price ($2k rent vs $180k).
- Cap rate 8.1% vs local median 6.2% in Hazel Park — top-decile yield for the area; either an underpriced asset or a hidden risk that comps aren't pricing in. Stress-test before assuming the spread holds.
Location & tenants
- Location reads 81/100 on livability (#65 in MI, #1,385 nationally) — a professional / high-income tenant draw. Strengths: commute A+, cost of living A+, housing A+; Watch: employment D+, schools D.
- Hazel Park School District (suburban): math 10% / reading 24% proficiency, ranked #490 of 540 in MI (top 91%) — low school quality limits family demand, transient renter base, plan for 1-2y turnover; 70% free/reduced lunch — lower-income household profile, screen leases tightly.
- Market conditions: Rents rising (+2.9%/yr); 135 active listings in the ZIP; 16 comparable units currently listed for rent nearby; rentals at typical pace (median 15d on market — plan ~3-4 weeks tenant-placement turnaround); 2,614 units permitted in Oakland County in 2024 (721 in 5+ unit buildings).
- This rent runs 35% of the median local income ($67k/yr) — at the standard rent-burdened threshold; future hikes will face affordability resistance.
Forward outlook
- Local home prices are declining (-3.0%/yr); year-one equity from $1k of loan paydown is wiped out by about $5k of value loss. Plan a longer hold.
- Oakland County population projected at +10% by 2050 — modest demand growth; plan on rents tracking national, not racing it.
Negotiation context
- Only 4 days on market — expect competitive offers; lowballing is unlikely to land.
- 11 sale attempts since 28y ago; this cycle's ask is 44% above the opening price — seller raised mid-cycle; expect resistance to lowballs.
- Current owner paid $140k; 28% above their basis — modest negotiation headroom, anchor on the comps not their cost.
Risks & watch-outs
- Watch-outs: built in 1942 — expect roof / HVAC / electrical / plumbing capex.
Questions for the listing agent
- Built in 1942 — when were the roof, HVAC, electrical panel, plumbing, and water heater last replaced?
- Is there a deadline driving the sale (1031 exchange, divorce, estate, relocation)? That informs how much negotiation room exists.
- Schools are D-rated, which usually means shorter tenancies and higher turnover. Who's the typical renter profile here, and what's been the actual vacancy rate?
- What's the average days-on-market for RENTAL listings here right now (not sales)? A rising rental-DOM trend means longer vacancies and softer asking-rent achievability than the comps imply.
- What's the recent tenant-quality profile in this submarket — average credit score on applications, eviction rate, late-payment / NSF rate, and stable-employment percentage? A property-management company in the area should have these aggregated.
- How much new for-sale + rental construction is in the pipeline within 1–3 miles? Heavy new supply typically softens prices + rents 12–24 months out; constrained supply supports both.
Investment metrics
- 1% rule
- 1.10% ✓
- Cap rate
- 8.10%
- Cash-on-cash
- 6.46%
- DSCR
- 1.29
- GRM
- 7.6
CMA / ARV
- ARV (on-the-fly)
- $222,504
- Comps found
- 12
Show comp detail 12 sales within ~0.75 mi
| Address | Dist | Beds/Ba | Sqft | Sold | Price | $/sf | Match |
|---|---|---|---|---|---|---|---|
| 568 E Coy Ave | 0.33mi | 3/2.5 | 1,466 (-4%) | 2mo | $302,000 | $206 | 70 |
| 561 Andresen Ct | 0.43mi | 3/2.0 | 1,483 (-3%) | 2mo | $219,900 | $148 | 70 |
| 644 E Brickley Ave | 0.39mi | 2/1.0 (-1) | 1,422 (-7%) | 0mo | $155,000 | $109 | 66 |
| 2406 Brickley St | 0.46mi | 3/1.0 | 1,392 (-9%) | 1mo | $220,000 | $158 | 64 |
| 2298 Browning St | 0.51mi | 4/2.0 (+1) | 1,557 (+2%) | 0mo | $185,000 | $119 | 63 |
| 550 E Mapledale Ave | 0.36mi | 3/1.0 | 1,703 (+12%) | 6mo | $249,000 | $146 | 59 |
| 2333 Barrett Ave | 0.56mi | 3/2.0 | 1,420 (-7%) | 2mo | $350,000 | $246 | 57 |
| 23776 Vassar Ave | 0.71mi | 3/1.0 | 1,432 (-6%) | 2mo | $191,750 | $134 | 55 |
| 975 E Barrett Ave | 0.63mi | 3/2.0 | 1,360 (-11%) | 4mo | $195,000 | $143 | 46 |
| 2309 Dallas Ave | 0.63mi | 3/2.0 | 1,743 (+14%) | 7mo | $227,250 | $130 | 37 |
| 3323 Kenwood St | 0.74mi | 2/1.0 (-1) | 1,711 (+12%) | 7mo | $140,000 | $82 | 34 |
| 804 E Lincoln Ave | 0.69mi | 4/2.0 (+1) | 1,346 (-12%) | 7mo | $250,000 | $186 | 34 |
Match score weights: distance 35% · size 25% · config 20% · recency 20%. Top-matched comps best support the ARV.
Projected returns pro-forma
-3.0% appreciation · 2.9% rent growth · sell at horizon
- IRR
- -6.4%
- Equity multiple
- 0.76×
- Total profit
- $-12,031
- Equity at exit
- $26,824
- IRR
- 3.1%
- Equity multiple
- 1.22×
- Total profit
- $11,167
- Equity at exit
- $15,554
Cash invested: $50,372 (down + closing). Projections, not guarantees.
Landlord ↔ Tenant lean methodology
- Overall (STATE)
- 62 Landlord-Friendly
- State Michigan
- 62 Landlord-Friendly · EVEN
- County
- — inherits STATE
- City
- — inherits STATE
ZIP-level market 48030
- Rents YoY
- 2.9%
- Active inventory
- 135
- Price-to-rent
- 7.6×
Monthly cashflow live
- Estimated rent
- $1,970 high interval (Pro) →
- Mortgage (P&I)
- −$943
- Tax from tax record
- −$267 /mo · $3,206/yr
- Insurance
- −$75
- HOA
- −$0
- Vacancy / Maint / Mgmt
- −$414
- Net cashflow
- $271
Break-even live
UW: 25.0% down · 7.5% · 30yr · 1.5% tax · 5.0% vac · 8.0% maint · 8.0% mgmt
Financing live
Cash to close
- Down payment
- $44,975
- Closing costs
- $5,397
- Reserves months
- —
- Total cash needed
- —
Loan-product check · same deal, 3 products live
Conventional
25% down · 7.5% · 30yr
- Down + closing
- —
- Monthly P&I
- —
- Monthly cashflow
- —
- DSCR
- —
- Eligible?
- —
Personal DTI + credit; lowest rate.
DSCR
20% down · 8.5% · 30yr
- Down + closing
- —
- Monthly P&I
- —
- Monthly cashflow
- —
- DSCR
- —
- Eligible?
- —
No personal income docs; deal must DSCR.
Hard money
10% down · 12.0% · 12mo
- Down + closing
- —
- Monthly P&I
- —
- Monthly cashflow
- —
- DSCR
- —
- Eligible?
- —
Short-term bridge; refi at stabilization.
Rent comps 16 comps
| Address | Beds | Baths | Sqft | Rent | $/sqft | DOM | Units | Dist |
|---|---|---|---|---|---|---|---|---|
| 322 Jeff Keeton Dr Hazel Park, MI | 2.0 | 2.5 | 1334 | $2,350 | $1.76 | 1d | 1 | 0.45mi |
| 691 E Mapledale Ave Hazel Park, MI | 2.0 | 1.0 | 1333 | $1,500 | $1.13 | 10d | 1 | 0.46mi |
| 959 E Shevlin Ave Hazel Park, MI | 3.0 | 1.0 | 1419 | $1,750 | $1.23 | 14d | 1 | 0.52mi |
| 2420 Woodward Hts Ferndale, MI | 3.0 | 1.0 | 1316 | $2,200 | $1.67 | 24d | 1 | 0.56mi |
| 2181 Coy St Ferndale, MI | 3.0 | 1.0 | 1050 | $1,995 | $1.90 | 10d | 1 | 0.59mi |
| 2186 Garfield St Ferndale, MI | 3.0 | 1.0 | 1300 | $1,750 | $1.35 | 24d | 1 | 0.60mi |
| 23400 Reynolds Ave Hazel Park, MI | 3.0 | 1.0 | 1305 | $1,900 | $1.46 | 4d | 1 | 0.74mi |
| 1816 Guthrie Ave Royal Oak, MI | 3.0 | 1.0 | 1100 | $1,800 | $1.64 | 4d | 1 | 0.83mi |
| 23304 Cayuga Ave Hazel Park, MI | 4.0 | 2.0 | 1540 | $2,150 | $1.40 | 24d | 1 | 0.92mi |
| 25151 Dequindre Rd Madison Heights, MI | 3.0 | 2.0 | 1088 | $1,279 | $1.18 | 23d | 1 | 1.04mi |
| 1201 Woodward Hts Ferndale, MI | 2.0 | 2.0 | 1200 | $2,045 | $1.70 | 24d | 1 | 1.06mi |
| 2803 Grayson St Ferndale, MI | 3.0 | 2.0 | 1274 | $2,000 | $1.57 | 43d | 1 | 1.08mi |
| 1820 E Troy St Ferndale, MI | 3.0 | 1.0 | 1167 | $1,500 | $1.29 | 4d | 1 | 1.08mi |
| 1414 Owana Ave Royal Oak, MI | 3.0 | 1.0 | 1489 | $1,675 | $1.12 | 21d | 1 | 1.17mi |
| 2705 Inman St Ferndale, MI | 3.0 | 2.5 | 1429 | $3,195 | $2.24 | 1d | 1 | 1.26mi |
| 1600 E 4th St Royal Oak, MI | 3.0 | 1.0 | 1166 | $3,200 | $2.74 | 12d | 1 | 1.30mi |
Listing history 5 events
-
2026-06-08status $179,900 Pending 4 DOM
-
2026-06-07days on market $179,900 Active 4 DOM
-
2026-06-04status $179,900 Active 1 DOM
-
2026-06-02remarks 699-char remark
-
2026-06-02$179,900 Coming Soon 1 DOM
ⓘ Source: listings_history table (triggers on properties + properties_extension) + one-shot
backfill from property_details.listing_events for pre-trigger history.
Tax reassessment forecast MI · Partial reset (capped growth)
- Current annual tax
- $3,206 · $267/mo
- Projected year-2 tax
- $3,206 · $267/mo
- Expected delta
- $0/yr ($0/mo · 0.0%)
ⓘ Screening estimate from a state-policy table — verify with the county assessor before closing.
Climate risk First Street
- Flood 1/10 Low FEMA zone X (unshaded) · 0% chance over 30 yrs
- Wildfire 1/10 Low
- Heat 3/10 Moderate 7 d/yr ≥97°F today · 15 d/yr by 30 yrs out
- Wind 2/10 Low
- Air quality 3/10 Moderate 3 unhealthy d/yr today · 5 by 30 yrs out
Nearby sold comps map
Loading sold comps map…
Walkable amenities ~0.75 mi
Loading nearby amenities…
Taxation est. · year 1
- Rental income
- $23,644
- − Mortgage interest
- −$10,077
- − Property taxes
- −$3,206
- − Insurance
- −$900
- − Repairs & maintenance
- −$1,892
- − Management
- −$1,892
- − Depreciation
- −$5,233
- Taxable income
- $445
- Est. tax owed @ 24.0%
- −$107
- After-tax cash flow
- $3,146/yr
For passive investors: Depreciation is non-cash, so a rental often shows a tax loss while cash-flowing — sheltering income. Rental losses are passive: they offset passive income freely, and up to $25,000/yr can offset ordinary (W-2) income if you actively participate and your MAGI is under $100k (phasing out to $0 by $150k); unused losses carry forward. On sale, claimed depreciation is recaptured at up to 25%, and gains may owe capital-gains tax (a 1031 exchange can defer both). Figures are a year-1 estimate at your 24.0% rate — not tax advice; consult a CPA.
Schools (NCES district)
- District
- Hazel Park School District
- NCES district ID
- 2618030
- Math proficiency
- 10% ▼ -2.00%
- Reading proficiency
- 24% ▲ 1.00%
- Median HH income
- $36,181
- Composite
- 14.05/100
- National rank
- #9466
- State rank
- #490 of 540 in MI
Livability — Hazel Park
- Score
- 81/100
- State rank
- #65
- US rank
- #1385
Category grades
Schools grade is shown separately in the Schools card above.
Census & demographics
- Census place
- Hazel Park, MI
- County
- Oakland County · 1,009,092 people
- City population
- 14,963
- Metro
- Detroit-Warren-Dearborn, MI
- Population (ZIP)
- 14,963
- Household income
- $67,073
- Rent vs Own
- Severe rent burden
- 432.0
Population outlook (Oakland County) Hauer SSP2
- Today (2025)
- 1,335,747 people
- By 2030
- 1,375,100 · +2.9%
- By 2040
- 1,435,385 · +7.5%
- By 2050
- 1,469,250 · +10.0%
- By 2075
- 1,531,946 · +14.7%
- By 2100
- 1,450,485 · +8.6%
Race, ethnicity, and origin ACS 2023
- Neighborhood character
- Predominantly White (74%)
- Race & ethnicity
- White 74% Two or more races 10% Black 10% Hispanic / Latino 6% Asian 1%
- Hispanic origin (detail)
- Mexican 3% Puerto Rican 2%
- Common ancestry
- Romanian 11% Slovak 3% Lithuanian 2%
- Foreign-born
- 5% · Canada
- Languages at home
- 92% English-only · Spanish 5% Arabic 1% Russian/Polish/Slavic 1%
Political lean MEDSL · Oakland
- 2024 margin
- D (+10.6) · D 54.4% · R 43.8% · Other 1.9%
- 2008→2024 swing
- -3.9pp toward R · 2008: 14.5pp · 2024: 10.6pp
- All cycles
- 2024: D+10.6 2020: D+14.1 2016: D+8.1 2012: D+8.1 2008: D+14.5
Not yet ingested
- Civics
- —
Market trends
- HPI YoY
- ▼ -184.32%
- Current HPI
- 285.5923
- Rent YoY
- ▲ 2.90%
- Metro
- Detroit-Warren-Dearborn, MI
- State GDP YoY
- ▲ 1.37%
- F500 in state
- 28
Industry mix (Fortune 500 HQ in MI)
| Industry | F500 HQs | Revenue |
|---|---|---|
| Automotive Parts | 3 | $48B |
|
||
| Automotive | 2 | $372B |
|
||
| Chemicals | 1 | $45B |
|
||
| Automotive Retail | 1 | $29B |
|
||
| Healthcare / Medical Devices | 1 | $23B |
|
||
| Automotive Technology | 1 | $20B |
|
||
Price history
+822.6% since first listed33 events — show timeline
- 2026-06-02 Coming Soon $179,900 MiRealSource-MiMLS
- 2021-05-11 Sold (Public Records) $140,000 Public Records
- 2021-04-28 Sold (MLS) $140,000 MiRealSource-MiMLS
- 2021-04-28 Sold (MLS) $140,000 REALCOMP
- 2021-03-23 Pending — MiRealSource-MiMLS
- 2021-03-23 Pending — REALCOMP
- 2021-03-17 Listed $124,500 MiRealSource-MiMLS
- 2021-03-17 Listed $124,500 REALCOMP
- 2014-10-03 Sold (MLS) $850 MiRealSource-MiMLS
- 2014-09-17 Listing Removed — MiRealSource-MiMLS
- 2014-05-07 Listed $850 MiRealSource-MiMLS
- 2007-07-30 Listing Removed — REALCOMP
- 2007-07-30 Listing Removed — MiRealSource-MiMLS
- 2007-05-07 Listing Removed — REALCOMP
- 2007-05-07 Listing Removed — MiRealSource-MiMLS
- 2007-05-07 Listed $109,850 REALCOMP
- 2007-05-07 Listed $109,850 MiRealSource-MiMLS
- 2006-12-14 Listed $118,500 REALCOMP
- 2006-12-14 Listed $118,500 MiRealSource-MiMLS
- 2004-02-06 Sold (Public Records) $110,300 Public Records
- 2004-01-12 Sold (MLS) $111,000 REALCOMP
- 2004-01-12 Sold (MLS) $111,000 MiRealSource-MiMLS
- 2004-01-05 Listing Removed — MiRealSource-MiMLS
- 2003-10-07 Listed $109,900 REALCOMP
- 2003-10-07 Listed $109,900 MiRealSource-MiMLS
- 2003-10-06 Listing Removed — REALCOMP
- 2003-08-25 Listed $119,900 REALCOMP
- 1998-10-07 Sold (MLS) $84,000 MiRealSource-MiMLS
- 1998-10-06 Listing Removed — MiRealSource-MiMLS
- 1998-08-20 Sold (Public Records) $86,000 Public Records
- 1998-04-13 Listed $85,000 MiRealSource-MiMLS
- 1994-03-14 Sold (Public Records) $49,000 Public Records
- 1973-10-01 Sold (Public Records) $19,500 Public Records
Property tax history
+5.7%/yrLatest (2025): $3,206 · +1.9% YoY. Source: county tax records.
Cash-flow waterfall
monthlySold comps — $/sqft
last 12 mo · ≤1 miLoading sold comps…