 Triplex
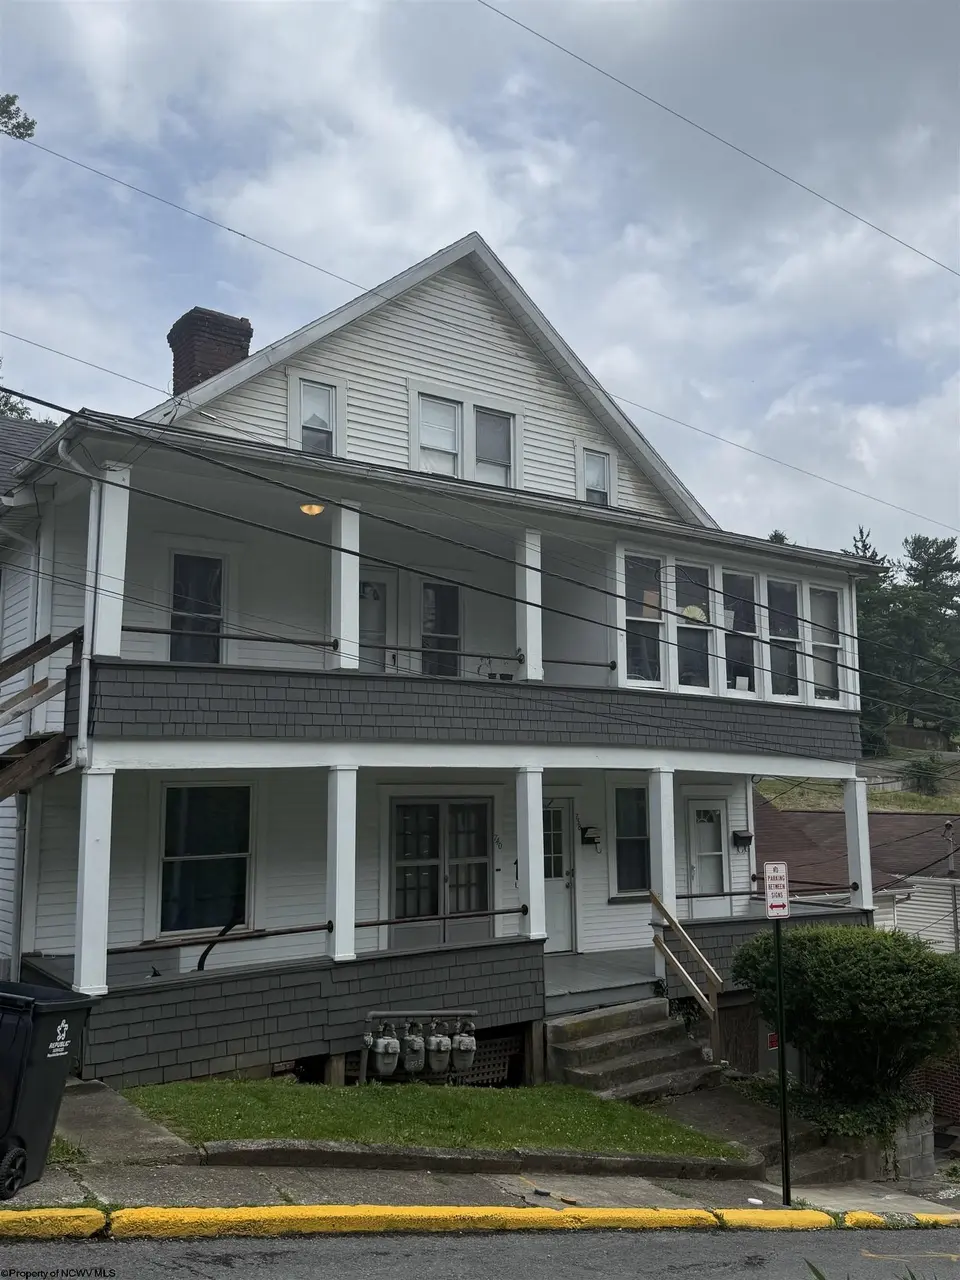
740 Weaver St · Morgantown, WV
Flood risk 10/10 · Severe
- FEMA flood zone
- X (unshaded)
- Chance of flooding over 30 yrs
- 0.99%
- Est. flood insurance / yr
- $473 – $860
Fire risk 1/10 · Minimal
- Est. fire insurance / yr
- $787 – $1,461
Heat risk 4/10 · Minor
- Hot days now (above 97°F)
- 7 days/yr
- Hot days in 30 yrs
- 19 days/yr
Wind risk 1/10 · Minimal
- Chance of severe wind over 30 yrs
- —
Air-quality risk 2/10 · Minimal
- Unhealthy air days now
- 1 days/yr
- Unhealthy air days in 30 yrs
- 2 days/yr
Risk factors via First Street. Map © Google.
Why this score? — see what drove the C+ grade
The composite is a weighted blend of 9 inputs, each scored 0–100. Each bar is that input's sub-score; the figure is the points it added to the 100-point composite (weight × sub-score).
- Cash flow +25.1/30.0
- DSCR +8.2/10.0
- ARV discount +7.4/15.0
- 1% rule +5.8/10.0
- Livability +4.2/5.0
- Schools +4.1/10.0
- Rent growth +3.9/5.0
- Condition / age +2.5/5.0
- Appreciation +0.0/10.0
$350,000
🖨 Deal sheet (PDF) 📄 Offer letter ✓ Due diligence
Multi-family units
County records classify this as Multi-Family (2-4 Unit). Listing-text estimate: 3 units. confirmed
Listing remarks
Exceptional income-producing multifamily investment opportunity just steps from downtown and campus! This well-maintained property offers four separate rental units with private entrances, providing flexibility for investors and strong appeal for student housing. Featuring a total of 8 bedrooms, 5 bathrooms, approximately 2,983 square feet of living space, and built in 1925, this property combines historic character with modern updates. Currently, 3 of the 4 units are leased, providing immediate rental income with additional upside potential. The shared basement includes washer and dryer facilities for tenant convenience. There is a large parking area to the left of the house allowing 3-6 p
Key facts
- Private entrances
- Large parking area
- Minutes from campus
Tags
Property features AI
Exterior
- Parking: On-street parking; no dedicated off-street parking listed
- Security: Smoke detectors
- Utilities: Public water; Public sewer; Cable available
- Home design: Multi-family residential income property; 2-story building; 2-4 family configuration; Zoned for apartment residential
- Construction: Frame construction with wood siding; Slab foundation
- Exterior features: Balcony; Porch; Shingle roof
Interior
- Kitchen: Range; Microwave; Refrigerator; Dishwasher not listed
- Bedrooms: One 1-bedroom unit (x2); One 2-bedroom unit; One 4+-bedroom unit
- Flooring: Ceramic tile; Laminate; Tile; Vinyl; Wood
- Bathrooms: Five full bathrooms
- Heating & cooling: Hot water heating; Ceiling fan(s); Window unit(s)
- Interior features: Appliances include dryer, refrigerator, microwave, range, and washer; Unfinished basement; Ceiling fans and window units for cooling; Hot water heating
- Laundry & utility: Washer and dryer included
Neighborhood map
What this means for you Summary
Snapshot
- This is a 3 × 3-bed/?-bath units multifamily listed at $350k.
Deal economics
- At list price, monthly cash flow is $721 ($9k/yr) — positive. Per door: $240/mo.
- The deal already cash-flows at list — no discount required.
- Meets the 1% rule at list price ($4k rent vs $350k).
- Cap rate 9.0% vs local median 3.1% in Morgantown — top-decile yield for the area; either an underpriced asset or a hidden risk that comps aren't pricing in. Stress-test before assuming the spread holds.
Location & tenants
- Location reads 84/100 on livability (#5 in WV, #674 nationally) — a professional / high-income tenant draw. Strengths: amenities A+, commute A+, cost of living A+; Watch: employment D-.
- Monongalia County Schools (urban): math 45% / reading 53% proficiency, ranked #1 of 55 in WV (top 2%) — families likely to look elsewhere, expect single-tenant / working-renter base with shorter leases.
- Zoned schools: North Elementary School (math 57% / reading 62%, grade B-, #15 of 377 statewide, top 5%, 584 students, 0% FRL); Mountaineer Middle School (math 52% / reading 60%, grade B-, #1 of 109 statewide, top 0%, 619 students, 0% FRL); Morgantown High School (math 49% / reading 73%, grade C+, #2 of 110 statewide, top 1%, 1,859 students, 0% FRL) — zoned schools average 0% FRL vs 32% district-wide (32 pts lower); this property's tenant base skews higher-income than the district average.
- Market conditions: Rents rising fast (+5.5%/yr); 119 active listings in the ZIP; 23 units permitted in Monongalia County in 2024 (15 in 5+ unit buildings).
- At $3,776/mo this rent would consume 100% of the median local household income ($46k/yr) (locally 3256% of renters already pay >50% of income on rent) — very limited rent-growth headroom before tenants either downsize or default.
Forward outlook
- Local home prices are declining (-3.0%/yr); year-one equity from $2k of loan paydown is wiped out by about $10k of value loss. Plan a longer hold.
- Monongalia County population projected at +38% by 2050 — long-run rental-demand tailwind backs the buy-and-hold thesis.
- At projected returns (-3.0% appreciation + 5.5% rent growth), your $98k cash investment doubles in ~9 years — after that, you're playing with house money.
Negotiation context
- Only 8 days on market — expect competitive offers; lowballing is unlikely to land.
- Current owner paid $42k; list at $350k implies a 724% gain — meaningful room to come down on a strong offer.
Risks & watch-outs
- Watch-outs: flood insurance adds $56/mo; built in 1925 — expect roof / HVAC / electrical / plumbing capex.
- Climate carrying-cost: severe flood risk — expect insurance premiums to compound above CPI over the hold.
Questions for the listing agent
- Can we see the unit-by-unit rent roll, current vacancy, and any below-market leases? What's the average tenancy length?
- What capital expenditures (roof, boiler, parking lot, exteriors) have been made in the last 5 years, and what's planned in the next 2?
- Built in 1925 — when were the roof, HVAC, electrical panel, plumbing, and water heater last replaced?
- What's the actual annual flood-insurance premium (NFIP or private), and is the property in a SFHA with mandatory coverage?
- Is there a deadline driving the sale (1031 exchange, divorce, estate, relocation)? That informs how much negotiation room exists.
- Schools are D-rated, which usually means shorter tenancies and higher turnover. Who's the typical renter profile here, and what's been the actual vacancy rate?
- What's the average days-on-market for RENTAL listings here right now (not sales)? A rising rental-DOM trend means longer vacancies and softer asking-rent achievability than the comps imply.
- What's the recent tenant-quality profile in this submarket — average credit score on applications, eviction rate, late-payment / NSF rate, and stable-employment percentage? A property-management company in the area should have these aggregated.
- How much new apartment / multifamily construction is in the pipeline within 1–3 miles? Heavy new supply (>2% of stock underway) typically softens rents 12–24 months out; light construction supports rent growth.
Investment metrics
- 1% rule
- 1.08% ✓
- Cap rate
- 8.96%
- Cash-on-cash
- 9.51%
- DSCR
- 1.42
- GRM
- 7.7
CMA / ARV
- ARV (on-the-fly)
- $349,011
- Comps found
- 6
Show comp detail 6 sales within ~0.75 mi
| Address | Dist | Beds/Ba | Sqft | Sold | Price | $/sf | Match |
|---|---|---|---|---|---|---|---|
| 728 Willey St | 0.02mi | 9/7.5 (+1) | 3,000 (+1%) | 7mo | $350,000 | $117 | 77 |
| 336-340 Willey St | 0.23mi | 9/4.5 (+1) | 2,808 (-6%) | 3mo | $525,000 | $187 | 70 |
| 746 Willey St | 0.02mi | 7/3.0 (-1) | 2,830 (-5%) | 14mo | $150,000 | $53 | 66 |
| 408 Forest | 0.29mi | 9/6.0 (+1) | 2,766 (-7%) | 12mo | $350,000 | $127 | 55 |
| 685 E Brockway Ave | 0.70mi | 8/4.0 | 3,120 (+5%) | 2mo | $350,000 | $112 | 54 |
| 321 Raymond St | 0.53mi | 7/4.0 (-1) | 2,713 (-9%) | 14mo | $10,000 | $4 | 40 |
Match score weights: distance 35% · size 25% · config 20% · recency 20%. Top-matched comps best support the ARV.
Projected returns pro-forma
-3.0% appreciation · 5.46% rent growth · sell at horizon
- IRR
- -0.3%
- Equity multiple
- 0.99×
- Total profit
- $-1,247
- Equity at exit
- $52,186
- IRR
- 11.6%
- Equity multiple
- 2.01×
- Total profit
- $99,224
- Equity at exit
- $30,262
Cash invested: $98,000 (down + closing). Projections, not guarantees.
Landlord ↔ Tenant lean methodology
- Overall (STATE)
- 83 Strongly Landlord-Friendly
- State West Virginia
- 83 Strongly Landlord-Friendly · R+22
- County
- — inherits STATE
- City
- — inherits STATE
ZIP-level market 26505
- Home prices YoY
- -31.9%
- Rents YoY
- 5.5%
- Active inventory
- 119
- Price-to-rent
- 23.2×
Monthly cashflow live
- Estimated rent
- $3,776 medium interval (Pro) →
- Mortgage (P&I)
- −$1,835
- Tax from tax record
- −$225 /mo · $2,701/yr
- Insurance
- −$146
- Flood insurance flood zone
- −$56 /mo · $666/yr
- HOA
- −$0
- Vacancy / Maint / Mgmt
- −$793
- Net cashflow
- $721
Break-even live
Sensitivity live
| Price | -10% $919 | -5% $820 | +0% $721 | +5% $622 | +10% $523 |
|---|---|---|---|---|---|
| Rent | -10% $423 | -5% $572 | +0% $721 | +5% $870 | +10% $1,019 |
| Rate | -1.0pp $897 | -0.5pp $810 | base $721 | +0.5pp $630 | +1.0pp $538 |
3-unit breakdown (identical units grouped — click to expand)
| Units | Beds | Baths | Est. rent |
|---|---|---|---|
| 3× units | 3 | — | $3,777 |
| #1 | 3 | — | $1,259 |
| #2 | 3 | — | $1,259 |
| #3 | 3 | — | $1,259 |
| Total (3 units) | $3,776 | ||
UW: 25.0% down · 7.5% · 30yr · 1.5% tax · 5.0% vac · 8.0% maint · 8.0% mgmt
Financing live
Cash to close
- Down payment
- $87,500
- Closing costs
- $10,500
- Reserves months
- —
- Total cash needed
- —
Loan-product check · same deal, 3 products live
Conventional
25% down · 7.5% · 30yr
- Down + closing
- —
- Monthly P&I
- —
- Monthly cashflow
- —
- DSCR
- —
- Eligible?
- —
Personal DTI + credit; lowest rate.
DSCR
20% down · 8.5% · 30yr
- Down + closing
- —
- Monthly P&I
- —
- Monthly cashflow
- —
- DSCR
- —
- Eligible?
- —
No personal income docs; deal must DSCR.
Hard money
10% down · 12.0% · 12mo
- Down + closing
- —
- Monthly P&I
- —
- Monthly cashflow
- —
- DSCR
- —
- Eligible?
- —
Short-term bridge; refi at stabilization.
Listing history 8 events
-
2026-06-19days on market $350,000 Active 8 DOM
-
2026-06-18days on market $350,000 Active 7 DOM
-
2026-06-17days on market $350,000 Active 6 DOM
-
2026-06-16days on market $350,000 Active 5 DOM
-
2026-06-15days on market $350,000 Active 4 DOM
-
2026-06-14days on market $350,000 Active 2 DOM
-
2026-06-13remarks 699-char remark
-
2026-06-13$350,000 Active 1 DOM
ⓘ Source: listings_history table (triggers on properties + properties_extension) + one-shot
backfill from property_details.listing_events for pre-trigger history.
Tax reassessment forecast WV · Resets to sale price
- Current annual tax
- $2,701 · $225/mo
- Projected year-2 tax
- $2,701 · $225/mo
- Expected delta
- $0/yr ($0/mo · 0.0%)
ⓘ Screening estimate from a state-policy table — verify with the county assessor before closing.
Climate risk First Street
- Flood 10/10 Extreme FEMA zone X (unshaded) · 99% chance over 30 yrs
- Wildfire 1/10 Low
- Heat 4/10 Moderate 7 d/yr ≥97°F today · 19 d/yr by 30 yrs out
- Wind 1/10 Low
- Air quality 2/10 Low 1 unhealthy d/yr today · 2 by 30 yrs out
Nearby sold comps map
Loading sold comps map…
Walkable amenities ~0.75 mi
Loading nearby amenities…
Taxation est. · year 1
- Rental income
- $45,312
- − Mortgage interest
- −$19,605
- − Property taxes
- −$2,701
- − Insurance
- −$2,416
- − Repairs & maintenance
- −$3,625
- − Management
- −$3,625
- − Depreciation
- −$10,182
- Taxable income
- $3,158
- Est. tax owed @ 24.0%
- −$758
- After-tax cash flow
- $7,896/yr
For passive investors: Depreciation is non-cash, so a rental often shows a tax loss while cash-flowing — sheltering income. Rental losses are passive: they offset passive income freely, and up to $25,000/yr can offset ordinary (W-2) income if you actively participate and your MAGI is under $100k (phasing out to $0 by $150k); unused losses carry forward. On sale, claimed depreciation is recaptured at up to 25%, and gains may owe capital-gains tax (a 1031 exchange can defer both). Figures are a year-1 estimate at your 24.0% rate — not tax advice; consult a CPA.
Schools (NCES district)
- District
- Monongalia County Schools
- NCES district ID
- 5400930
- Math proficiency
- 45% ▼ -5.00%
- Reading proficiency
- 53% ▼ -2.00%
- Median HH income
- $43,820
- Composite
- 41.34/100
- National rank
- #3503
- State rank
- #1 of 55 in WV
Livability — Morgantown
- Score
- 84/100
- State rank
- #5
- US rank
- #674
Category grades
Schools grade is shown separately in the Schools card above.
Census & demographics
- Census place
- Morgantown, WV
- County
- Monongalia County · 97,252 people
- City population
- 97,252
- Metro
- Morgantown, WV
- Population (ZIP)
- 37,492
- Household income
- $45,536
- Rent vs Own
- Severe rent burden
- 3256.0
Population outlook (Monongalia County) Hauer SSP2
- Today (2025)
- 122,188 people
- By 2030
- 131,536 · +7.7%
- By 2040
- 149,777 · +22.6%
- By 2050
- 168,245 · +37.7%
- By 2075
- 207,979 · +70.2%
- By 2100
- 239,430 · +96.0%
Race, ethnicity, and origin ACS 2023
- Neighborhood character
- Predominantly White (82%)
- Race & ethnicity
- White 82% Asian 6% Two or more races 5% Black 4% Hispanic / Latino 3%
- Common ancestry
- Romanian 5% Slovak 3% Italian 2%
- Foreign-born
- 10% · China, Canada, Vietnam
- Languages at home
- 88% English-only · Arabic 3% Other Indo-European 2% Chinese 2%
Political lean MEDSL · Monongalia
- 2024 margin
- Toss-up / Even · D 46.5% · R 50.9% · Other 2.7%
- 2008→2024 swing
- -8.2pp toward R · 2008: 3.9pp · 2024: -4.4pp
- All cycles
- 2024: R+4.4 2020: R+1.2 2016: R+10.4 2012: R+9.7 2008: D+3.9
Not yet ingested
- Civics
- —
Market trends
- HPI YoY
- ▼ -100.05%
- Current HPI
- 213.749
- Rent YoY
- ▲ 5.46%
- Metro
- Morgantown, WV
- State GDP YoY
- —
- F500 in state
- 0
Price history
+723.5% since first listed2 events — show timeline
- 2026-06-11 Listed $350,000 NCWVREIN
- 1986-04-14 Sold (Public Records) $42,500 Public Records
Property tax history
+2.0%/yrLatest (2025): $2,701 · +0.2% YoY. Source: county tax records.
Cash-flow waterfall
monthlySold comps — $/sqft
last 12 mo · ≤1 miLoading sold comps…