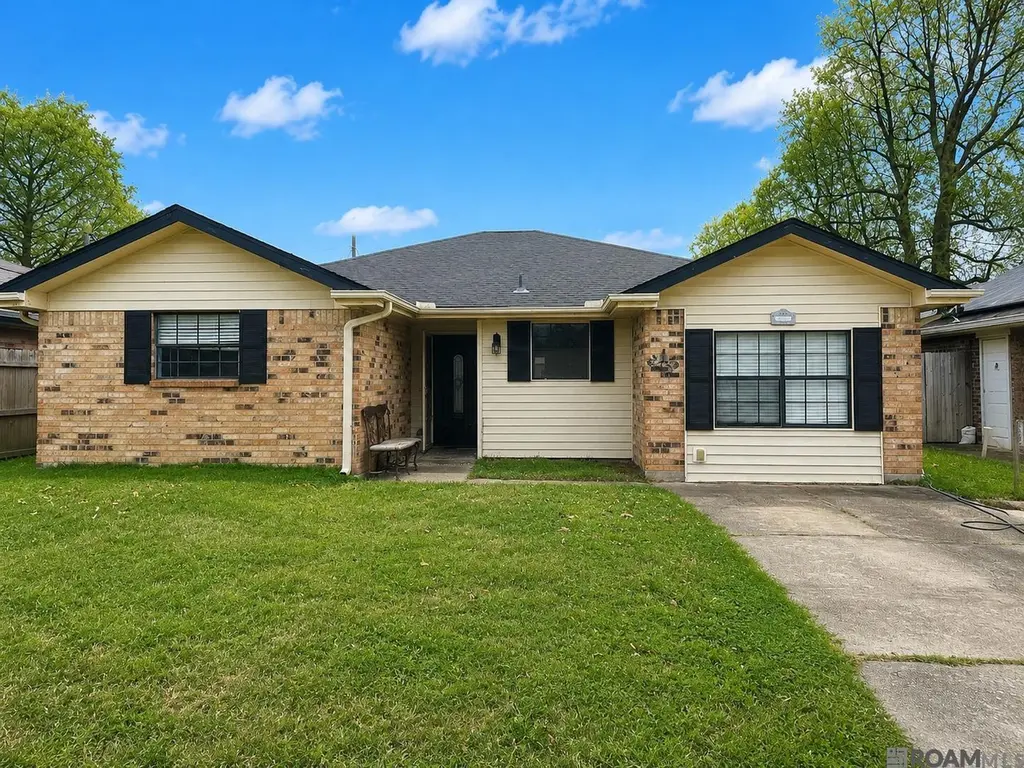
209 Janet Dr · St. Rose, LA
Flood risk 6/10 · Moderate
- FEMA flood zone
- A99
- Chance of flooding over 30 yrs
- 0.58%
- Est. flood insurance / yr
- $1,009 – $1,996
Fire risk 1/10 · Minimal
- Est. fire insurance / yr
- $1,269 – $2,357
Heat risk 9/10 · Severe
- Hot days now (above 108°F)
- 7 days/yr
- Hot days in 30 yrs
- 21 days/yr
Wind risk 10/10 · Severe
- Chance of severe wind over 30 yrs
- 99.0%
Air-quality risk 3/10 · Minor
- Unhealthy air days now
- 2 days/yr
- Unhealthy air days in 30 yrs
- 3 days/yr
Risk factors via First Street. Map © Google.
Why this score? — see what drove the C+ grade
The composite is a weighted blend of 9 inputs, each scored 0–100. Each bar is that input's sub-score; the figure is the points it added to the 100-point composite (weight × sub-score).
- Cash flow +24.2/30.0
- ARV discount +15.0/15.0
- DSCR +7.8/10.0
- 1% rule +6.1/10.0
- Schools +4.0/10.0
- Rent growth +2.5/5.0
- Livability +2.5/5.0
- Condition / age +2.5/5.0
- Appreciation +0.0/10.0
$150,000
🖨 Deal sheet 📄 Offer letter ✓ Due diligence
Listing remarks MLS
Opportunity awaits! This home has good bones with a 3 year old roof, and is ready for a new owner to add updates and personal touches. Functional layout with solid potential, perfect for a homeowner looking to customize or an investor seeking value. Located in an established area with convenient access to local amenities. A little love will go a long way.
Key facts
- 6,098 sq ft lot
- 2 parking spots
- Built 1983
Property features AI
Exterior
- Parking: Off-street parking for 2 vehicles
- Utilities: Public water service; Public sewer service
- Home design: Detached single-family residence; Residential property
- Construction: Vinyl siding and brick exterior; Slab foundation
- Exterior features: Public water; Public sewer; Lot roughly 50 x 117 (approx. 0.14 acre); Subdivision: Dianne Place
Interior
- Bathrooms: Two full bathrooms
- Heating & cooling: Central heating; Window unit cooling
- Interior features: Central heating; Window air conditioning units
Neighborhood map
What this means for you Summary
Snapshot
- This is a 4-bed/2.0-bath single-family listed at $150k.
Deal economics
- At list price, monthly cash flow is $174 ($2k/yr) — positive.
- The deal already cash-flows at list — no discount required.
- Meets the 1% rule at list price ($2k rent vs $150k).
- Recommended offer: $148k (1.5% below list) — sets the bar for market timing.
Location & tenants
- Location reads: area grade C — affects rentability + tenant quality, not the cash-flow math above.
- St. Charles Parish (suburban): math 40% / reading 51% proficiency, ranked #14 of 98 in LA (top 14%) — families likely to look elsewhere, expect single-tenant / working-renter base with shorter leases.
- Market conditions: 20 active listings in the ZIP; 74 units permitted in St. Charles Parish in 2024 (0 in 5+ unit buildings).
Forward outlook
- Local home prices are declining (-3.0%/yr); year-one equity from $1k of loan paydown is wiped out by about $4k of value loss. Plan a longer hold.
- St. Charles County population projected to shrink 7% by 2050 — rents likely to lag national; underwrite the cash flow, not the appreciation.
Negotiation context
- It's been on market 22 days — a 2% lower offer ($148k) is reasonable based on typical stale-listing flexibility.
- 8 sale attempts since 33y ago; this cycle's ask has dropped $20k (12%) from the opening price — seller is motivated, your offer sets the floor, not the list.
- Current owner paid $130k; 15% above their basis — modest negotiation headroom, anchor on the comps not their cost.
Risks & watch-outs
- Watch-outs: flood insurance adds $125/mo.
- Climate carrying-cost: in FEMA flood zone A99 (mandatory federal flood insurance); severe wind risk, 99% chance of damaging wind over 30y; extreme-heat days projected 7→21/yr by 2055 (HVAC capex compounding) — expect insurance premiums to compound above CPI over the hold.
Questions for the listing agent
- What's the actual annual flood-insurance premium (NFIP or private), and is the property in a SFHA with mandatory coverage?
- Is there a deadline driving the sale (1031 exchange, divorce, estate, relocation)? That informs how much negotiation room exists.
- What's the average days-on-market for RENTAL listings here right now (not sales)? A rising rental-DOM trend means longer vacancies and softer asking-rent achievability than the comps imply.
- What's the recent tenant-quality profile in this submarket — average credit score on applications, eviction rate, late-payment / NSF rate, and stable-employment percentage? A property-management company in the area should have these aggregated.
- How much new for-sale + rental construction is in the pipeline within 1–3 miles? Heavy new supply typically softens prices + rents 12–24 months out; constrained supply supports both.
Investment metrics
- 1% rule
- 1.11% ✓
- Cap rate
- 8.68%
- Cash-on-cash
- 8.54%
- DSCR
- 1.38
- GRM
- 7.5
CMA / ARV
- ARV (on-the-fly)
- $254,040
- Comps found
- 12
Show comp detail 12 sales within ~0.75 mi
| Address | Dist | Beds/Ba | Sqft | Sold | Price | $/sf | Match |
|---|---|---|---|---|---|---|---|
| 14 Pinto Ln | 0.48mi | 3/2.5 (-1) | 1,796 (+3%) | 3mo | $262,000 | $146 | 63 |
| 406 Saint Rose Ave | 0.23mi | 3/2.0 (-1) | 1,600 (-8%) | 11mo | $230,000 | $144 | 62 |
| 318 Saint Rose Ave | 0.34mi | 3/3.0 (-1) | 1,867 (+7%) | 3mo | $210,000 | $112 | 61 |
| 710 Oak St | 0.21mi | 3/2.0 (-1) | 1,520 (-13%) | 13mo | $263,000 | $173 | 53 |
| 16 Canyon Ln | 0.36mi | 3/2.0 (-1) | 1,855 (+7%) | 21mo | $345,000 | $186 | 50 |
| 240 Dianne Dr | 0.15mi | 3/2.0 (-1) | 1,520 (-13%) | 22mo | $205,000 | $135 | 48 |
| 221 Oak St | 0.47mi | 3/2.0 (-1) | 1,574 (-10%) | 11mo | $260,000 | $165 | 48 |
| 12 Canyon Ln | 0.38mi | 3/2.0 (-1) | 1,855 (+7%) | 22mo | $350,000 | $189 | 48 |
| 115 Riverview Dr | 0.70mi | 3/2.0 (-1) | 1,715 (-1%) | 20mo | $179,000 | $104 | 43 |
| 101 Oak St | 0.62mi | 3/3.5 (-1) | 1,602 (-8%) | 7mo | $264,900 | $165 | 41 |
| 13 Sombrero Ln | 0.51mi | 3/2.0 (-1) | 1,900 (+9%) | 23mo | $265,000 | $139 | 37 |
| 139 Riverview Dr | 0.72mi | 3/2.0 (-1) | 1,552 (-11%) | 8mo | $205,000 | $132 | 37 |
Match score weights: distance 35% · size 25% · config 20% · recency 20%. Top-matched comps best support the ARV.
Projected returns pro-forma
-3.0% appreciation · 3.0% rent growth · sell at horizon
- IRR
- -8.5%
- Equity multiple
- 0.69×
- Total profit
- $-13,169
- Equity at exit
- $22,365
- IRR
- 1.0%
- Equity multiple
- 1.07×
- Total profit
- $3,114
- Equity at exit
- $12,969
Cash invested: $42,000 (down + closing). Projections, not guarantees.
Landlord ↔ Tenant lean methodology
- Overall (STATE)
- 90 Strongly Landlord-Friendly
- State Louisiana
- 90 Strongly Landlord-Friendly · R+12
- County
- — inherits STATE
- City
- — inherits STATE
ZIP-level market 70087
- Home prices YoY
- -11.0%
- Active inventory
- 20
- Price-to-rent
- 7.5×
Monthly cashflow live
- Estimated rent
- $1,658 medium interval (Pro) →
- Mortgage (P&I)
- −$787
- Tax from tax record
- −$162 /mo · $1,941/yr
- Insurance
- −$62
- Flood insurance flood zone
- −$125 /mo · $1,502/yr
- HOA
- −$0
- Vacancy / Maint / Mgmt
- −$348
- Net cashflow
- $174
Break-even live
UW: 25.0% down · 7.5% · 30yr · 1.5% tax · 5.0% vac · 8.0% maint · 8.0% mgmt
Financing live
Cash to close
- Down payment
- $37,500
- Closing costs
- $4,500
- Reserves months
- —
- Total cash needed
- —
Loan-product check · same deal, 3 products live
Conventional
25% down · 7.5% · 30yr
- Down + closing
- —
- Monthly P&I
- —
- Monthly cashflow
- —
- DSCR
- —
- Eligible?
- —
Personal DTI + credit; lowest rate.
DSCR
20% down · 8.5% · 30yr
- Down + closing
- —
- Monthly P&I
- —
- Monthly cashflow
- —
- DSCR
- —
- Eligible?
- —
No personal income docs; deal must DSCR.
Hard money
10% down · 12.0% · 12mo
- Down + closing
- —
- Monthly P&I
- —
- Monthly cashflow
- —
- DSCR
- —
- Eligible?
- —
Short-term bridge; refi at stabilization.
Listing history 28 events
-
2026-06-18days on market $150,000 Active 22 DOM
-
2026-06-17days on market $150,000 Active 21 DOM
-
2026-06-16days on market $150,000 Active 20 DOM
-
2026-06-15days on market $150,000 Active 19 DOM
-
2026-06-13pricedays on market $150,000 Active 17 DOM
-
2026-06-13days on market $170,000 Active 16 DOM
-
2026-06-10days on market $170,000 Active 14 DOM
-
2026-06-09days on market $170,000 Active 13 DOM
-
2026-06-08days on market $170,000 Active 12 DOM
-
2026-06-07days on market $170,000 Active 11 DOM
-
2026-06-05days on market $170,000 Active 8 DOM
-
2026-06-03days on market $170,000 Active 7 DOM
-
2026-06-02days on market $170,000 Active 6 DOM
-
2026-06-01days on market $170,000 Active 5 DOM
-
2026-05-31days on market $170,000 Active 4 DOM
-
2026-05-27$170,000 Active
Show marketing remark (357 chars)
Opportunity awaits! This home has good bones with a 3 year old roof, and is ready for a new owner to add updates and personal touches. Functional layout with solid potential, perfect for a homeowner looking to customize or an investor seeking value. Located in an established area with convenient access to local amenities. A little love will go a long way.
-
2026-05-27$170,000 Active 357-char remark
Show marketing remark (357 chars)
Opportunity awaits! This home has good bones with a 3 year old roof, and is ready for a new owner to add updates and personal touches. Functional layout with solid potential, perfect for a homeowner looking to customize or an investor seeking value. Located in an established area with convenient access to local amenities. A little love will go a long way.
-
2017-10-25soldstatus $130,000
-
2013-11-08soldstatus $131,500
-
1999-03-25soldstatus
-
1999-01-14$86,900
-
1999-01-14$86,900
-
1995-06-23soldstatus
-
1995-01-09$69,900
-
1995-01-09$69,900
-
1993-12-31soldstatus
-
1993-10-06$61,900
-
1993-10-06$61,900
ⓘ Source: listings_history table (triggers on properties + properties_extension) + one-shot
backfill from property_details.listing_events for pre-trigger history.
Tax reassessment forecast LA · Resets to sale price
- Current annual tax
- $1,941 · $162/mo
- Projected year-2 tax
- $1,941 · $162/mo
- Expected delta
- $0/yr ($0/mo · 0.0%)
ⓘ Screening estimate from a state-policy table — verify with the county assessor before closing.
Climate risk First Street
- Flood 6/10 Major FEMA zone A99 · 58% chance over 30 yrs
- Wildfire 1/10 Low
- Heat 9/10 Extreme 7 d/yr ≥108°F today · 21 d/yr by 30 yrs out
- Wind 10/10 Extreme 99% chance of damaging wind over 30 yrs
- Air quality 3/10 Moderate 2 unhealthy d/yr today · 3 by 30 yrs out
Nearby sold comps map
Loading sold comps map…
Walkable amenities ~0.75 mi
Loading nearby amenities…
Taxation est. · year 1
- Rental income
- $19,892
- − Mortgage interest
- −$8,402
- − Property taxes
- −$1,941
- − Insurance
- −$2,252
- − Repairs & maintenance
- −$1,591
- − Management
- −$1,591
- − Depreciation
- −$4,364
- Taxable loss
- −$250
- Est. tax savings @ 24.0%
- +$60
- After-tax cash flow
- $2,142/yr
For passive investors: Depreciation is non-cash, so a rental often shows a tax loss while cash-flowing — sheltering income. Rental losses are passive: they offset passive income freely, and up to $25,000/yr can offset ordinary (W-2) income if you actively participate and your MAGI is under $100k (phasing out to $0 by $150k); unused losses carry forward. On sale, claimed depreciation is recaptured at up to 25%, and gains may owe capital-gains tax (a 1031 exchange can defer both). Figures are a year-1 estimate at your 24.0% rate — not tax advice; consult a CPA.
Schools (NCES district)
- District
- St. Charles Parish
- NCES district ID
- 2201440
- Math proficiency
- 40% ▼ -38.00%
- Reading proficiency
- 51% ▼ -32.00%
- Median HH income
- $60,261
- Composite
- 40.0/100
- National rank
- #3830
- State rank
- #14 of 98 in LA
Livability — St. Rose
No livability data for this city. (Only ~50 U.S. cities are tracked.)
Census & demographics
- Census place
- St. Rose, LA
- Population (ZIP)
- 6,939
Population outlook (St. Charles County) Hauer SSP2
- Today (2025)
- 53,296 people
- By 2030
- 53,030 · -0.5%
- By 2040
- 51,646 · -3.1%
- By 2050
- 49,771 · -6.6%
- By 2075
- 46,993 · -11.8%
- By 2100
- 44,473 · -16.6%
Race, ethnicity, and origin ACS 2023
- Neighborhood character
- Diverse neighborhood (Simpson 0.66)
- Race & ethnicity
- Black 43% White 35% Hispanic / Latino 18% Two or more races 5%
- Hispanic origin (detail)
- Common ancestry
- Lithuanian 9% Italian 1%
- Foreign-born
- 11% · Canada
- Languages at home
- 82% English-only · Spanish 17% Other Asian/Pacific 1%
Political lean MEDSL · St. Charles
- 2024 margin
- Solid R (+32.4) · D 33.0% · R 65.4% · Other 1.6%
- 2008→2024 swing
- -1.1pp toward R · 2008: -31.2pp · 2024: -32.4pp
- All cycles
- 2024: R+32.4 2020: R+29.6 2016: R+30.8 2012: R+27.8 2008: R+31.2
Not yet ingested
- Civics
- —
Market trends
- HPI YoY
- ▼ -27.55%
- Current HPI
- 222.4641
- Rent YoY
- —
- Metro
- —
- State GDP YoY
- ▲ 3.29%
- F500 in state
- 10
Industry mix (Fortune 500 HQ in LA)
| Industry | F500 HQs | Revenue |
|---|---|---|
| Telecommunications | 2 | $23B |
|
||
| Utilities | 1 | $12B |
|
||
| Wholesale / Distribution | 1 | $5B |
|
||
| Advertising | 1 | $2B |
|
||
Price history
+174.6% since first listed13 events — show timeline
- 2026-05-27 Listed $170,000 GBRMLS
- 2026-05-27 Listed $170,000 AcadianaMLS
- 2017-10-25 Sold (Public Records) $130,000 Public Records
- 2013-11-08 Sold (Public Records) $131,500 Public Records
- 1999-03-25 Sold (MLS) — GSREIN
- 1999-01-14 Listed $86,900 GSREIN
- 1999-01-14 Listed $86,900 AcadianaMLS
- 1995-06-23 Sold (MLS) — GSREIN
- 1995-01-09 Listed $69,900 AcadianaMLS
- 1995-01-09 Listed $69,900 GSREIN
- 1993-12-31 Sold (MLS) — GSREIN
- 1993-10-06 Listed $61,900 GSREIN
- 1993-10-06 Listed $61,900 AcadianaMLS
Property tax history
+2.7%/yrLatest (2024): $1,941 · +27.8% YoY. Source: county tax records.
Cash-flow waterfall
monthlySold comps — $/sqft
last 12 mo · ≤1 miLoading sold comps…