4221 Evelyn St · Bossier City, LA
Flood risk 1/10 · Minimal
- FEMA flood zone
- X
- Chance of flooding over 30 yrs
- 0.0%
- Est. flood insurance / yr
- $507 – $1,088
Fire risk 3/10 · Minor
- Est. fire insurance / yr
- $1,269 – $2,357
Heat risk 7/10 · Major
- Hot days now (above 110°F)
- 7 days/yr
- Hot days in 30 yrs
- 22 days/yr
Wind risk 6/10 · Moderate
- Chance of severe wind over 30 yrs
- 73.0%
Air-quality risk 2/10 · Minimal
- Unhealthy air days now
- 1 days/yr
- Unhealthy air days in 30 yrs
- 2 days/yr
Risk factors via First Street. Map © Google.
Why this score? — see what drove the C grade
The composite is a weighted blend of 9 inputs, each scored 0–100. Each bar is that input's sub-score; the figure is the points it added to the 100-point composite (weight × sub-score).
- Cash flow +22.8/30.0
- ARV discount +11.3/15.0
- DSCR +7.3/10.0
- 1% rule +5.2/10.0
- Schools +3.8/10.0
- Livability +3.6/5.0
- Rent growth +3.4/5.0
- Condition / age +2.5/5.0
- Appreciation +0.0/10.0
$149,900
🖨 Deal sheet 📄 Offer letter ✓ Due diligence
Listing remarks
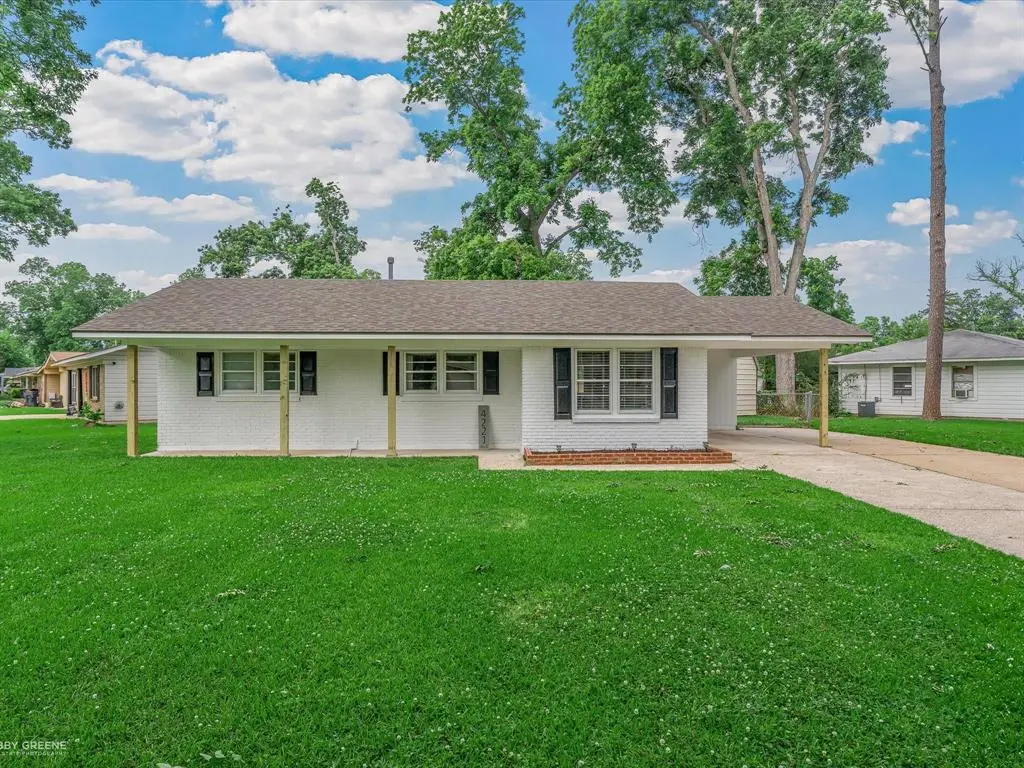
This beautifully refreshed home blends timeless charm with modern comfort. Situated on a spacious corner lot beneath towering mature trees, this inviting property offers exceptional curb appeal with its freshly painted white brick exterior, updated trim accents, covered front porch, and attached carport that adds both style and convenience. Inside, you will find a bright and welcoming layout featuring 3 bedrooms, 1 fully updated bathroom, and approximately 1,046 square feet of comfortable living space. Fresh neutral paint tones throughout create a light and airy feel while the gorgeous easy care vinyl flooring flows seamlessly through the home, adding warmth and durability. The spacious liv
Key facts
- Covered front porch
- Attached carport
- Covered back patio
Tags
Property features AI
Finance
- Other: Lot under 0.5 acre (approximately 0.23 acre); Subdivision: Shady Grove; County: Bossier; Country: United States
- Financial info: Treat as clear loan type; No second mortgage
- HOA & community: No homeowners association
Exterior
- Parking: Attached carport; Carport with 2 covered spaces; Driveway
- Utilities: City water; City sewer; No municipal utility district
- Home design: Single family residence; Single-story; Residential property
- Construction: Brick construction; Shingle roof; Other roof materials; Slab foundation; Built in 1957
- Exterior features: Covered patio/porch
Interior
- Kitchen: Dishwasher; Disposal; Gas cooktop; Gas oven
- Bedrooms: 3 bedrooms (primary bedroom on entry level)
- Flooring: Simulated wood flooring; Vinyl flooring
- Bathrooms: 1 full bathroom
- Heating & cooling: Central heating (natural gas); Central electric air conditioning
- Interior features: Built-in features; Cable TV available; One living area; One dining area; One level (single-story)
Neighborhood map
What this means for you Summary
Snapshot
- This is a 3-bed/1.0-bath single-family listed at $150k.
Deal economics
- At list price, monthly cash flow is $261 ($3k/yr) — positive.
- The deal already cash-flows at list — no discount required.
- Meets the 1% rule at list price ($2k rent vs $150k).
- Cap rate 8.4% vs local median 4.7% in Bossier City — top-decile yield for the area; either an underpriced asset or a hidden risk that comps aren't pricing in. Stress-test before assuming the spread holds.
Location & tenants
- Location reads 71/100 on livability (#47 in LA) — a middle-class / working-renter tenant base. Strengths: commute A+, cost of living A+, housing A+; Watch: employment D+, crime F, amenities F.
- Bossier Parish (urban): math 40% / reading 47% proficiency, ranked #17 of 98 in LA (top 17%) — families likely to look elsewhere, expect single-tenant / working-renter base with shorter leases.
- Market conditions: Rents rising (+3.6%/yr); 145 active listings in the ZIP; 8 comparable units currently listed for rent nearby; rentals lingering (median 44d on market — plan ~5-8 weeks vacancy on turnover, expect pricing pressure); 50% of comp listings sitting > 30 days — soft ceiling on asking rent; 716 units permitted in Bossier Parish in 2024 (0 in 5+ unit buildings).
Forward outlook
- Local home prices are declining (-3.0%/yr); year-one equity from $1k of loan paydown is wiped out by about $4k of value loss. Plan a longer hold.
- Bossier County population projected at +28% by 2050 — long-run rental-demand tailwind backs the buy-and-hold thesis.
Negotiation context
- Only 2 days on market — expect competitive offers; lowballing is unlikely to land.
- Current owner paid $114k; 31% above their basis — modest negotiation headroom, anchor on the comps not their cost.
Risks & watch-outs
- Watch-outs: built in 1957 — expect roof / HVAC / electrical / plumbing capex.
- Climate carrying-cost: major wind risk, 73% chance of damaging wind over 30y; extreme-heat days projected 7→22/yr by 2055 (HVAC capex compounding) — expect insurance premiums to compound above CPI over the hold.
Questions for the listing agent
- Built in 1957 — when were the roof, HVAC, electrical panel, plumbing, and water heater last replaced?
- Is there a deadline driving the sale (1031 exchange, divorce, estate, relocation)? That informs how much negotiation room exists.
- Schools are B-rated — typically a magnet for longer-tenancy family renters. What's the average tenant stay here, and is there a school-zone premium baked into asking?
- Crime grade is F in this area — have there been break-ins, vandalism, or insurance claims at this property in the last 3 years? What carrier currently insures it and at what premium?
- What's the average days-on-market for RENTAL listings here right now (not sales)? A rising rental-DOM trend means longer vacancies and softer asking-rent achievability than the comps imply.
- What's the recent tenant-quality profile in this submarket — average credit score on applications, eviction rate, late-payment / NSF rate, and stable-employment percentage? A property-management company in the area should have these aggregated.
- How much new for-sale + rental construction is in the pipeline within 1–3 miles? Heavy new supply typically softens prices + rents 12–24 months out; constrained supply supports both.
Investment metrics
- 1% rule
- 1.02% ✓
- Cap rate
- 8.38%
- Cash-on-cash
- 7.46%
- DSCR
- 1.33
- GRM
- 8.2
CMA / ARV
- ARV (on-the-fly)
- $163,878
- Comps found
- 12
Show comp detail 12 sales within ~0.75 mi
| Address | Dist | Beds/Ba | Sqft | Sold | Price | $/sf | Match |
|---|---|---|---|---|---|---|---|
| 4216 Evelyn St | 0.04mi | 3/1.0 | 1,172 (+2%) | 2mo | $164,900 | $141 | 92 |
| 2102 Orbit Dr | 0.33mi | 3/1.5 | 1,151 (+0%) | 0mo | $167,500 | $146 | 81 |
| 2037 Orbit Dr | 0.29mi | 3/1.0 | 1,180 (+3%) | 1mo | $159,999 | $136 | 81 |
| 2044 Orbit Dr | 0.32mi | 3/1.5 | 1,087 (-5%) | 1mo | $149,000 | $137 | 74 |
| 513 Linnhurst Dr | 0.47mi | 3/2.0 | 1,134 (-1%) | 1mo | $210,000 | $185 | 72 |
| 4214 Paul St | 0.35mi | 3/1.0 | 1,257 (+10%) | 1mo | $169,900 | $135 | 67 |
| 5310 Aster St | 0.67mi | 3/1.0 | 1,052 (-8%) | 0mo | $150,000 | $143 | 55 |
| 5310 Aster St | 0.67mi | 3/1.0 | 1,052 (-8%) | 2mo | $95,000 | $90 | 54 |
| 316 Gaston Ln | 0.49mi | 3/2.0 | 1,278 (+12%) | 2mo | $219,900 | $172 | 52 |
| 2104 Gen Forrest Dr | 0.70mi | 3/1.0 | 1,019 (-11%) | 1mo | $97,000 | $95 | 48 |
| 1998 Wild Iris | 0.61mi | 3/2.0 | 1,302 (+14%) | 3mo | $205,000 | $157 | 42 |
| 604 Whitefield Ln | 0.68mi | 3/2.0 | 1,311 (+14%) | 0mo | $230,000 | $175 | 40 |
Match score weights: distance 35% · size 25% · config 20% · recency 20%. Top-matched comps best support the ARV.
Projected returns pro-forma
-3.0% appreciation · 3.6% rent growth · sell at horizon
- IRR
- -4.3%
- Equity multiple
- 0.84×
- Total profit
- $-6,773
- Equity at exit
- $22,351
- IRR
- 6.0%
- Equity multiple
- 1.46×
- Total profit
- $19,210
- Equity at exit
- $12,961
Cash invested: $41,972 (down + closing). Projections, not guarantees.
Landlord ↔ Tenant lean methodology
- Overall (STATE)
- 90 Strongly Landlord-Friendly
- State Louisiana
- 90 Strongly Landlord-Friendly · R+12
- County
- — inherits STATE
- City
- — inherits STATE
ZIP-level market 71112
- Rents YoY
- 3.6%
- Active inventory
- 145
- Price-to-rent
- 8.2×
Monthly cashflow live
- Estimated rent
- $1,522 high interval (Pro) →
- Mortgage (P&I)
- −$786
- Tax from tax record
- −$93 /mo · $1,115/yr
- Insurance
- −$62
- HOA
- −$0
- Vacancy / Maint / Mgmt
- −$320
- Net cashflow
- $261
Break-even live
UW: 25.0% down · 7.5% · 30yr · 1.5% tax · 5.0% vac · 8.0% maint · 8.0% mgmt
Financing live
Cash to close
- Down payment
- $37,475
- Closing costs
- $4,497
- Reserves months
- —
- Total cash needed
- —
Loan-product check · same deal, 3 products live
Conventional
25% down · 7.5% · 30yr
- Down + closing
- —
- Monthly P&I
- —
- Monthly cashflow
- —
- DSCR
- —
- Eligible?
- —
Personal DTI + credit; lowest rate.
DSCR
20% down · 8.5% · 30yr
- Down + closing
- —
- Monthly P&I
- —
- Monthly cashflow
- —
- DSCR
- —
- Eligible?
- —
No personal income docs; deal must DSCR.
Hard money
10% down · 12.0% · 12mo
- Down + closing
- —
- Monthly P&I
- —
- Monthly cashflow
- —
- DSCR
- —
- Eligible?
- —
Short-term bridge; refi at stabilization.
Rent comps 8 comps
| Address | Beds | Baths | Sqft | Rent | $/sqft | DOM | Units | Dist |
|---|---|---|---|---|---|---|---|---|
| 4223 Elaine St Bossier City, LA | 3.0 | 1.0 | 1030 | $1,475 | $1.43 | 43d | 1 | 0.27mi |
| 1711 San Saba St Bossier City, LA | 3.0 | 1.5 | 1119 | $1,250 | $1.12 | 20d | 1 | 0.52mi |
| 1401 Gardenia St Bossier City, LA | 2.0 | 1.0 | 878 | $1,100 | $1.25 | 20d | 1 | 0.74mi |
| 4708 Longstreet Pl Bossier City, LA | 3.0 | 1.5 | 1108 | $1,500 | $1.35 | 43d | 1 | 0.75mi |
| 4720 Longstreet Pl Bossier City, LA | 3.0 | 2.0 | 1407 | $1,500 | $1.07 | 44d | 1 | 0.78mi |
| 3979 Stuart Ave Bossier City, LA | 3.0 | 1.5 | 1135 | $1,300 | $1.15 | 13d | 1 | 0.89mi |
| 5005 Longstreet Pl Unit 19 Bossier City, LA | 2.0 | 2.0 | 1200 | $1,500 | $1.25 | 20d | 1 | 1.34mi |
| 5005 Longstreet Pl #72 Bossier City, LA | 3.0 | 2.0 | 1309 | $1,650 | $1.26 | 43d | 1 | 1.34mi |
Listing history 6 events
-
2026-05-21status Pending
-
2026-05-19$149,900 Active
-
2019-07-08soldstatus $114,000
-
2004-06-29soldstatus $73,000
-
2000-05-26soldstatus $63,500
-
1997-02-27soldstatus $55,000
ⓘ Source: listings_history table (triggers on properties + properties_extension) + one-shot
backfill from property_details.listing_events for pre-trigger history.
Tax reassessment forecast LA · Resets to sale price
- Current annual tax
- $1,115 · $93/mo
- Projected year-2 tax
- $1,115 · $93/mo
- Expected delta
- $0/yr ($0/mo · 0.0%)
ⓘ Screening estimate from a state-policy table — verify with the county assessor before closing.
Climate risk First Street
- Flood 1/10 Low FEMA zone X · 0% chance over 30 yrs
- Wildfire 3/10 Moderate
- Heat 7/10 Severe 7 d/yr ≥110°F today · 22 d/yr by 30 yrs out
- Wind 6/10 Major 73% chance of damaging wind over 30 yrs
- Air quality 2/10 Low 1 unhealthy d/yr today · 2 by 30 yrs out
Nearby sold comps map
Loading sold comps map…
Walkable amenities ~0.75 mi
Loading nearby amenities…
Taxation est. · year 1
- Rental income
- $18,266
- − Mortgage interest
- −$8,397
- − Property taxes
- −$1,115
- − Insurance
- −$750
- − Repairs & maintenance
- −$1,461
- − Management
- −$1,461
- − Depreciation
- −$4,361
- Taxable income
- $722
- Est. tax owed @ 24.0%
- −$173
- After-tax cash flow
- $2,960/yr
For passive investors: Depreciation is non-cash, so a rental often shows a tax loss while cash-flowing — sheltering income. Rental losses are passive: they offset passive income freely, and up to $25,000/yr can offset ordinary (W-2) income if you actively participate and your MAGI is under $100k (phasing out to $0 by $150k); unused losses carry forward. On sale, claimed depreciation is recaptured at up to 25%, and gains may owe capital-gains tax (a 1031 exchange can defer both). Figures are a year-1 estimate at your 24.0% rate — not tax advice; consult a CPA.
Schools (NCES district)
- District
- Bossier Parish
- NCES district ID
- 2200270
- Math proficiency
- 40% ▼ -32.00%
- Reading proficiency
- 47% ▼ -28.00%
- Median HH income
- $51,326
- Composite
- 37.5/100
- National rank
- #4402
- State rank
- #17 of 98 in LA
Livability — Bossier City
- Score
- 71/100
- State rank
- #47
- US rank
- #7044
Category grades
Schools grade is shown separately in the Schools card above.
Census & demographics
- Census place
- Bossier City, LA
- County
- Bossier Parish · 98,704 people
- City population
- 91,925
- Metro
- Shreveport-Bossier City, LA
- Population (ZIP)
- 33,587
- Household income
- $61,760
- Rent vs Own
- Severe rent burden
- 1391.0
Population outlook (Bossier County) Hauer SSP2
- Today (2025)
- 143,247 people
- By 2030
- 151,802 · +6.0%
- By 2040
- 168,194 · +17.4%
- By 2050
- 183,533 · +28.1%
- By 2075
- 217,009 · +51.5%
- By 2100
- 230,091 · +60.6%
Race, ethnicity, and origin ACS 2023
- Neighborhood character
- Diverse neighborhood (Simpson 0.57)
- Race & ethnicity
- White 59% Black 24% Hispanic / Latino 12% Two or more races 8% Asian 2%
- Hispanic origin (detail)
- Mexican 9%
- Common ancestry
- Lithuanian 2% Slovak 1% Scottish 1%
- Foreign-born
- 5% · Canada, Vietnam
- Languages at home
- 89% English-only · Spanish 7% Other Indo-European 1% Tagalog/Filipino 1%
Political lean MEDSL · Bossier
- 2024 margin
- Solid R (+43.3) · D 27.7% · R 71.0% · Other 1.3%
- 2008→2024 swing
- +0.3pp no change · 2008: -43.7pp · 2024: -43.3pp
- All cycles
- 2024: R+43.3 2020: R+41.0 2016: R+45.8 2012: R+45.4 2008: R+43.7
Not yet ingested
- Civics
- —
Market trends
- HPI YoY
- ▼ -77.48%
- Current HPI
- 127.9821
- Rent YoY
- ▲ 3.60%
- Metro
- Shreveport-Bossier City, LA
- State GDP YoY
- ▲ 3.29%
- F500 in state
- 10
Industry mix (Fortune 500 HQ in LA)
| Industry | F500 HQs | Revenue |
|---|---|---|
| Telecommunications | 2 | $23B |
|
||
| Utilities | 1 | $12B |
|
||
| Wholesale / Distribution | 1 | $5B |
|
||
| Advertising | 1 | $2B |
|
||
Price history
+172.5% since first listed6 events — show timeline
- 2026-05-21 Pending — NTREIS
- 2026-05-19 Listed $149,900 NTREIS
- 2019-07-08 Sold (Public Records) $114,000 Public Records
- 2004-06-29 Sold (Public Records) $73,000 Public Records
- 2000-05-26 Sold (Public Records) $63,500 Public Records
- 1997-02-27 Sold (Public Records) $55,000 Public Records
Property tax history
+19.5%/yrLatest (2025): $1,115 · -1.3% YoY. Source: county tax records.
Cash-flow waterfall
monthlySold comps — $/sqft
last 12 mo · ≤1 miLoading sold comps…