1338 Hicks Rd · Jefferson City, TN
Flood risk 1/10 · Minimal
- FEMA flood zone
- X (unshaded)
- Chance of flooding over 30 yrs
- 0.0%
- Est. flood insurance / yr
- $507 – $1,088
Fire risk 5/10 · Moderate
- Est. fire insurance / yr
- $949 – $1,763
Heat risk 5/10 · Moderate
- Hot days now (above 102°F)
- 7 days/yr
- Hot days in 30 yrs
- 20 days/yr
Wind risk 2/10 · Minimal
- Chance of severe wind over 30 yrs
- —
Air-quality risk 3/10 · Minor
- Unhealthy air days now
- 2 days/yr
- Unhealthy air days in 30 yrs
- 3 days/yr
Risk factors via First Street. Map © Google.
Why this score? — see what drove the B- grade
The composite is a weighted blend of 9 inputs, each scored 0–100. Each bar is that input's sub-score; the figure is the points it added to the 100-point composite (weight × sub-score).
- Cash flow +30.0/30.0
- 1% rule +10.0/10.0
- DSCR +10.0/10.0
- ARV discount +7.5/15.0
- Livability +3.5/5.0
- Rent growth +2.5/5.0
- Condition / age +2.5/5.0
- Schools +2.2/10.0
- Appreciation +0.0/10.0
$90,700
🖨 Deal sheet 📄 Offer letter ✓ Due diligence
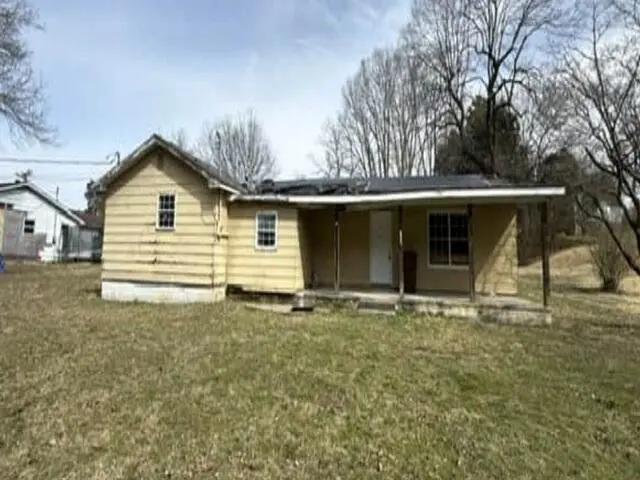
Listing remarks
Fabulous opportunity for a fix and flip or long term hold renovation project. Home was a duplex and has been single family for many years. Needs complete re-do. Lots of space and large lot. See it today. RESERVE AUCTION PROPERTY- Property sold ''AS-IS'' without contingencies, repairs, warranties, guarantees or representation as to listing accuracy, property information, photo or other depiction included or described herein. Inspect before bidding.
Key facts
- 0.9 acre lot
- Built 1980
- Listed 69 days
Property features AI
Exterior
- Parking: Other parking
- Utilities: Public water available; Sewer available / Septic tank
- Home design: Duplex residential income property; One level
- Construction: Frame construction with wood siding; Slab foundation; Built as a duplex
- Exterior features: No exterior features listed; Composition/Shingle roof
Interior
- Bathrooms: 2 full bathrooms
- Heating & cooling: Central heating; Central air conditioning
- Interior features: No built-in appliances listed
Neighborhood map
What this means for you Summary
Snapshot
- This is a 4-bed/2.0-bath other listed at $91k.
Deal economics
- At list price, monthly cash flow is $591 ($7k/yr) — positive.
- The deal already cash-flows at list — no discount required.
- Meets the 1% rule at list price ($1k rent vs $91k).
- Recommended offer: $85k (6.0% below list) — sets the bar for market timing.
- Cap rate 14.1% vs local median 2.5% in Jefferson City — top-decile yield for the area; either an underpriced asset or a hidden risk that comps aren't pricing in. Stress-test before assuming the spread holds.
Location & tenants
- Location reads 70/100 on livability (#52 in TN) — a middle-class / working-renter tenant base. Strengths: cost of living A+, housing A+, health & safety A+; Watch: amenities F, commute F, employment F.
- Jefferson County (rural): math 25% / reading 27% proficiency, ranked #80 of 139 in TN (top 58%) — low school quality limits family demand, transient renter base, plan for 1-2y turnover.
- Zoned schools: Jefferson Elementary (math 27% / reading 27%, grade F, #496 of 952 statewide, top 55%, 433 students, 0% FRL); Jefferson Middle School (math 24% / reading 23%, grade F, #162 of 333 statewide, top 50%, 586 students, 0% FRL); Jefferson Co High School (math 11% / reading 36%, grade F, #145 of 332 statewide, top 44%, 2,054 students, 0% FRL) — zoned schools average 0% FRL vs 52% district-wide (52 pts lower); this property's tenant base skews higher-income than the district average.
- Market conditions: 90 active listings in the ZIP; 254 units permitted in Jefferson County in 2024 (0 in 5+ unit buildings).
Forward outlook
- Local home prices are declining (-3.0%/yr); year-one equity from $627 of loan paydown is wiped out by about $3k of value loss. Plan a longer hold.
- Jefferson County population projected at +6% by 2050 — modest demand growth; plan on rents tracking national, not racing it.
- At projected returns (-3.0% appreciation + 3.0% rent growth), your $25k cash investment doubles in ~5 years — after that, you're playing with house money.
Negotiation context
- It's been on market 70 days — a 6% lower offer ($85k) is reasonable based on typical stale-listing flexibility.
- Current owner paid $37k; list at $91k implies a 145% gain — meaningful room to come down on a strong offer.
Risks & watch-outs
- Climate carrying-cost: moderate wildfire risk; extreme-heat days projected 7→20/yr by 2055 (HVAC capex compounding) — expect insurance premiums to compound above CPI over the hold.
Questions for the listing agent
- It's been on market 70 days. Have you received any prior offers? Is the seller open to a 6% concession, seller financing, or rate buy-down credit?
- Why hasn't it sold? Are there any deal-killer items the seller is aware of (foundation, flood, title, zoning, code violations)?
- Is there a deadline driving the sale (1031 exchange, divorce, estate, relocation)? That informs how much negotiation room exists.
- Schools are F-rated, which usually means shorter tenancies and higher turnover. Who's the typical renter profile here, and what's been the actual vacancy rate?
- What's the average days-on-market for RENTAL listings here right now (not sales)? A rising rental-DOM trend means longer vacancies and softer asking-rent achievability than the comps imply.
- What's the recent tenant-quality profile in this submarket — average credit score on applications, eviction rate, late-payment / NSF rate, and stable-employment percentage? A property-management company in the area should have these aggregated.
- How much new for-sale + rental construction is in the pipeline within 1–3 miles? Heavy new supply typically softens prices + rents 12–24 months out; constrained supply supports both.
Investment metrics
- 1% rule
- 1.65% ✓
- Cap rate
- 14.11%
- Cash-on-cash
- 27.93%
- DSCR
- 2.24
- GRM
- 5.0
CMA / ARV
No comps found within radius.
Projected returns pro-forma
-3.0% appreciation · 3.0% rent growth · sell at horizon
- IRR
- 22.1%
- Equity multiple
- 1.90×
- Total profit
- $22,945
- Equity at exit
- $13,524
- IRR
- 30.1%
- Equity multiple
- 3.70×
- Total profit
- $68,454
- Equity at exit
- $7,842
Cash invested: $25,396 (down + closing). Projections, not guarantees.
Landlord ↔ Tenant lean methodology
- Overall (STATE)
- 87 Strongly Landlord-Friendly
- State Tennessee
- 87 Strongly Landlord-Friendly · R+13
- County
- — inherits STATE
- City
- — inherits STATE
ZIP-level market 37760
- Home prices YoY
- -12.3%
- Active inventory
- 90
- Price-to-rent
- 5.0×
Monthly cashflow live
- Estimated rent
- $1,498 medium interval (Pro) →
- Mortgage (P&I)
- −$476
- Tax from tax record
- −$79 /mo · $946/yr
- Insurance
- −$38
- HOA
- −$0
- Vacancy / Maint / Mgmt
- −$315
- Net cashflow
- $591
Break-even live
UW: 25.0% down · 7.5% · 30yr · 1.5% tax · 5.0% vac · 8.0% maint · 8.0% mgmt
Financing live
Cash to close
- Down payment
- $22,675
- Closing costs
- $2,721
- Reserves months
- —
- Total cash needed
- —
Loan-product check · same deal, 3 products live
Conventional
25% down · 7.5% · 30yr
- Down + closing
- —
- Monthly P&I
- —
- Monthly cashflow
- —
- DSCR
- —
- Eligible?
- —
Personal DTI + credit; lowest rate.
DSCR
20% down · 8.5% · 30yr
- Down + closing
- —
- Monthly P&I
- —
- Monthly cashflow
- —
- DSCR
- —
- Eligible?
- —
No personal income docs; deal must DSCR.
Hard money
10% down · 12.0% · 12mo
- Down + closing
- —
- Monthly P&I
- —
- Monthly cashflow
- —
- DSCR
- —
- Eligible?
- —
Short-term bridge; refi at stabilization.
Listing history 25 events
-
2026-06-19days on market $90,700 Active 70 DOM
-
2026-06-18days on market $90,700 Active 69 DOM
-
2026-06-17days on market $90,700 Active 68 DOM
-
2026-06-16days on market $90,700 Active 67 DOM
-
2026-06-15days on market $90,700 Active 66 DOM
-
2026-06-14days on market $90,700 Active 64 DOM
-
2026-06-13days on market $90,700 Active 63 DOM
-
2026-06-10days on market $90,700 Active 61 DOM
-
2026-06-09days on market $90,700 Active 60 DOM
-
2026-06-08days on market $90,700 Active 59 DOM
-
2026-06-07days on market $90,700 Active 58 DOM
-
2026-06-05pricedays on market $90,700 Active 55 DOM
-
2026-06-03days on market $103,000 Active 54 DOM
-
2026-06-02days on market $103,000 Active 53 DOM
-
2026-06-01days on market $103,000 Active 52 DOM
-
2026-05-31days on market $103,000 Active 51 DOM
-
2026-05-30days on market $103,000 Active 50 DOM
-
2026-05-11status Pending
-
2026-04-23price $103,000
-
2026-03-24$127,200 Active
-
2022-09-29price $87,300
-
2022-09-14price $101,100
-
2022-08-24price $123,400
-
1991-09-24soldstatus $37,000
-
1991-05-16soldstatus $45,000
ⓘ Source: listings_history table (triggers on properties + properties_extension) + one-shot
backfill from property_details.listing_events for pre-trigger history.
Tax reassessment forecast TN · Resets to sale price
- Current annual tax
- $946 · $79/mo
- Projected year-2 tax
- $946 · $79/mo
- Expected delta
- $0/yr ($0/mo · 0.0%)
ⓘ Screening estimate from a state-policy table — verify with the county assessor before closing.
Climate risk First Street
- Flood 1/10 Low FEMA zone X (unshaded) · 0% chance over 30 yrs
- Wildfire 5/10 Major
- Heat 5/10 Major 7 d/yr ≥102°F today · 20 d/yr by 30 yrs out
- Wind 2/10 Low
- Air quality 3/10 Moderate 2 unhealthy d/yr today · 3 by 30 yrs out
Nearby sold comps map
Loading sold comps map…
Walkable amenities ~0.75 mi
Loading nearby amenities…
Taxation est. · year 1
- Rental income
- $17,974
- − Mortgage interest
- −$5,081
- − Property taxes
- −$946
- − Insurance
- −$454
- − Repairs & maintenance
- −$1,438
- − Management
- −$1,438
- − Depreciation
- −$2,639
- Taxable income
- $5,979
- Est. tax owed @ 24.0%
- −$1,435
- After-tax cash flow
- $5,657/yr
For passive investors: Depreciation is non-cash, so a rental often shows a tax loss while cash-flowing — sheltering income. Rental losses are passive: they offset passive income freely, and up to $25,000/yr can offset ordinary (W-2) income if you actively participate and your MAGI is under $100k (phasing out to $0 by $150k); unused losses carry forward. On sale, claimed depreciation is recaptured at up to 25%, and gains may owe capital-gains tax (a 1031 exchange can defer both). Figures are a year-1 estimate at your 24.0% rate — not tax advice; consult a CPA.
Schools (NCES district)
- District
- Jefferson County
- NCES district ID
- 4702100
- Math proficiency
- 25% ▼ -7.00%
- Reading proficiency
- 27% ▼ -4.00%
- Median HH income
- $41,074
- Composite
- 22.03/100
- National rank
- #8204
- State rank
- #80 of 139 in TN
Livability — Jefferson City
- Score
- 70/100
- State rank
- #52
- US rank
- #7592
Category grades
Schools grade is shown separately in the Schools card above.
Census & demographics
- Census place
- Jefferson City, TN
- County
- Jefferson County · 13,253 people
- City population
- 13,253
- Metro
- Morristown, TN
- Population (ZIP)
- 13,253
- Household income
- $66,190
- Rent vs Own
- Severe rent burden
- 411.0
Population outlook (Jefferson County) Hauer SSP2
- Today (2025)
- 56,862 people
- By 2030
- 58,186 · +2.3%
- By 2040
- 60,025 · +5.6%
- By 2050
- 60,442 · +6.3%
- By 2075
- 59,211 · +4.1%
- By 2100
- 55,326 · -2.7%
Race, ethnicity, and origin ACS 2023
- Neighborhood character
- Predominantly White (88%)
- Race & ethnicity
- White 88% Two or more races 7% Hispanic / Latino 7% Black 2%
- Hispanic origin (detail)
- Mexican 6%
- Common ancestry
- Italian 3% Slovak 3% Serbian 2%
- Foreign-born
- 3% · Canada
- Languages at home
- 94% English-only · Spanish 5%
Political lean MEDSL · Jefferson
- 2024 margin
- Solid R (+64.2) · D 17.4% · R 81.6%
- 2008→2024 swing
- -21.5pp toward R · 2008: -42.7pp · 2024: -64.2pp
- All cycles
- 2024: R+64.2 2020: R+59.3 2016: R+59.3 2012: R+50.1 2008: R+42.7
Not yet ingested
- Civics
- —
Market trends
- HPI YoY
- ▼ -42.66%
- Current HPI
- 304.8614
- Rent YoY
- —
- Metro
- Morristown, TN
- State GDP YoY
- ▲ 2.78%
- F500 in state
- 22
Industry mix (Fortune 500 HQ in TN)
| Industry | F500 HQs | Revenue |
|---|---|---|
| Healthcare | 3 | $91B |
|
||
| Retail | 3 | $72B |
|
||
| Transportation / Logistics | 1 | $88B |
|
||
| Paper / Packaging | 1 | $19B |
|
||
| Insurance | 1 | $13B |
|
||
| Energy | 1 | $12B |
|
||
Price history
+128.9% since first listed8 events — show timeline
- 2026-05-11 Pending — GCAR
- 2026-04-23 Price Changed $103,000 GCAR
- 2026-03-24 Listed $127,200 GCAR
- 2022-09-29 Price Changed $87,300 GCAR
- 2022-09-14 Price Changed $101,100 GCAR
- 2022-08-24 Price Changed $123,400 GCAR
- 1991-09-24 Sold (Public Records) $37,000 Public Records
- 1991-05-16 Sold (Public Records) $45,000 Public Records
Property tax history
+2.9%/yrLatest (2025): $946 · +2.3% YoY. Source: county tax records.
Cash-flow waterfall
monthlySold comps — $/sqft
last 12 mo · ≤1 miLoading sold comps…