9090 S Braeswood Blvd #74 · Houston, TX
Flood risk 1/10 · Minimal
- FEMA flood zone
- X (shaded)
- Chance of flooding over 30 yrs
- 0.0%
- Est. flood insurance / yr
- $507 – $1,088
Fire risk 1/10 · Minimal
- Est. fire insurance / yr
- $1,222 – $2,270
Heat risk 9/10 · Severe
- Hot days now (above 110°F)
- 7 days/yr
- Hot days in 30 yrs
- 24 days/yr
Wind risk 9/10 · Severe
- Chance of severe wind over 30 yrs
- 99.0%
Air-quality risk 2/10 · Minimal
- Unhealthy air days now
- 2 days/yr
- Unhealthy air days in 30 yrs
- 2 days/yr
Risk factors via First Street. Map © Google.
Why this score? — see what drove the C+ grade
The composite is a weighted blend of 9 inputs, each scored 0–100. Each bar is that input's sub-score; the figure is the points it added to the 100-point composite (weight × sub-score).
- Cash flow +24.9/30.0
- 1% rule +10.0/10.0
- DSCR +8.1/10.0
- ARV discount +7.5/15.0
- Livability +3.7/5.0
- Rent growth +2.7/5.0
- Schools +2.7/10.0
- Condition / age +2.5/5.0
- Appreciation +0.0/10.0
$65,000
🖨 Deal sheet 📄 Offer letter ✓ Due diligence
Listing remarks MLS
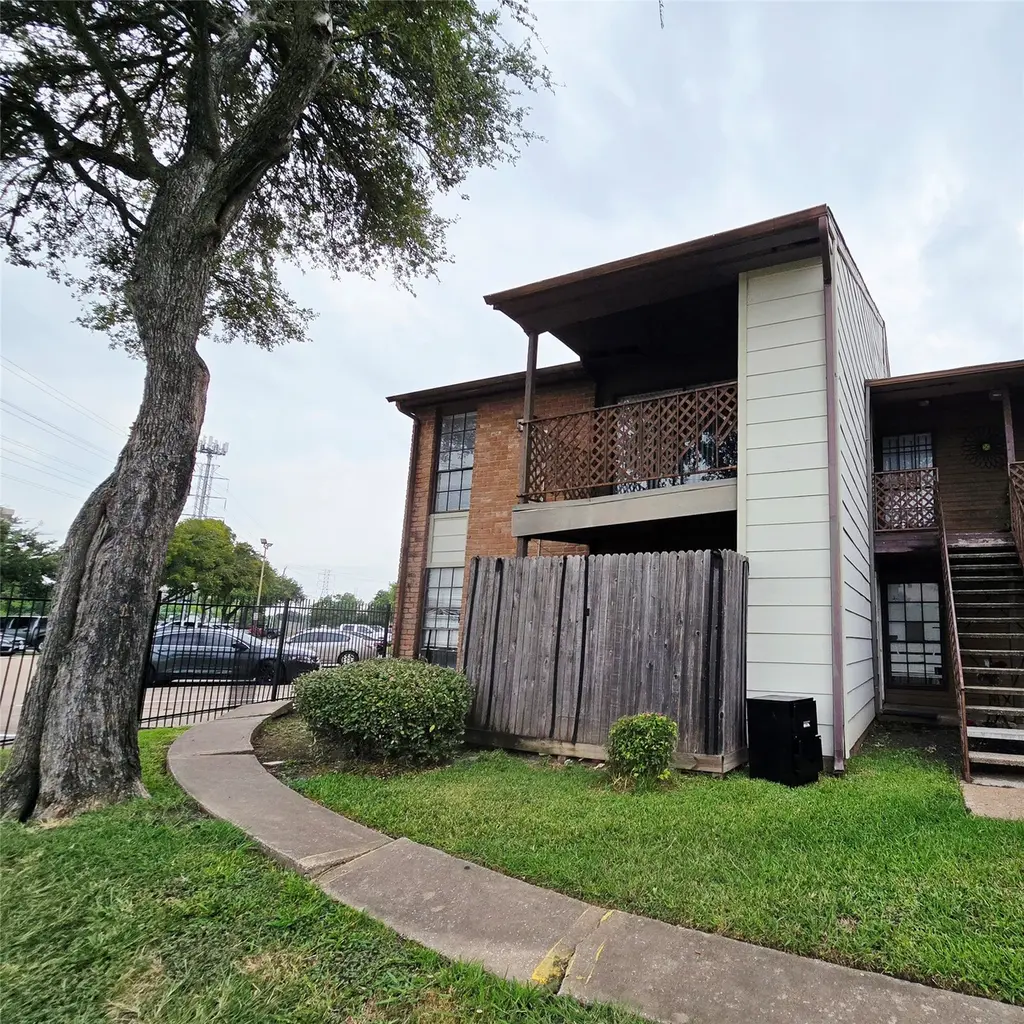
Charming 1-Bedroom Condo in Gated Braeswood Community – Ideal for Investors, Downsizers, or First-Time Buyers! Located in the secure and well-maintained Braeswood Condos of Houston, TX, this inviting 1-bedroom unit offers high ceilings and an open-concept living space that feels bright and spacious. Enjoy convenient access to highways 59 and 610, with close proximity to Downtown Houston and the Texas Medical Center. Whether you're looking to invest, downsize, or purchase your first home, this condo is a must-see. Come discover why it’s the perfect place to call home!
Key facts
- $260 HOA
- Parking
- Community pool
Tags
Neighborhood map
What this means for you Summary
Snapshot
- This is a 2-bed/2.0-bath condo listed at $65k.
Deal economics
- At list price, monthly cash flow is $139 ($2k/yr) — positive.
- The deal already cash-flows at list — no discount required.
- Meets the 1% rule at list price ($1k rent vs $65k).
- Recommended offer: $57k (12.0% below list) — sets the bar for market timing.
- Cap rate 8.9% vs local median 3.2% in Houston — top-decile yield for the area; either an underpriced asset or a hidden risk that comps aren't pricing in. Stress-test before assuming the spread holds.
Location & tenants
- Location reads 74/100 on livability (#184 in TX, #4,771 nationally) — a middle-class / working-renter tenant base. Strengths: amenities A+, cost of living A+, housing A+; Watch: schools D, crime F.
- Houston ISD (urban): math 27% / reading 35% proficiency, ranked #593 of 826 in TX (top 72%) — families likely to look elsewhere, expect single-tenant / working-renter base with shorter leases; 71% free/reduced lunch — lower-income household profile, screen leases tightly.
- Market conditions: Rents flat; 103 active listings in the ZIP; 40 comparable units currently listed for rent nearby; rentals at typical pace (median 24d on market — plan ~3-4 weeks tenant-placement turnaround); 40% of comp listings sitting > 30 days — soft ceiling on asking rent; 29,883 units permitted in Harris County in 2024 (8,621 in 5+ unit buildings).
Forward outlook
- Local home prices are declining (-3.0%/yr); year-one equity from $449 of loan paydown is wiped out by about $2k of value loss. Plan a longer hold.
- Harris County population projected at +47% by 2050 — long-run rental-demand tailwind backs the buy-and-hold thesis.
Negotiation context
- It's been on market 273 days — a 12% lower offer ($57k) is reasonable based on typical stale-listing flexibility.
- 3 sale attempts since 5y ago with the ask held roughly flat each time — persistent listings suggest the price (not the market) is what's stuck; bring a comps-based counter.
- Current owner paid $15k; list at $65k implies a 333% gain — meaningful room to come down on a strong offer.
Risks & watch-outs
- Watch-outs: HOA is 23% of rent.
- Climate carrying-cost: severe wind risk, 99% chance of damaging wind over 30y; extreme-heat days projected 7→24/yr by 2055 (HVAC capex compounding) — expect insurance premiums to compound above CPI over the hold.
Questions for the listing agent
- It's been on market 273 days. Have you received any prior offers? Is the seller open to a 12% concession, seller financing, or rate buy-down credit?
- Built in 1979 — when were the roof, HVAC, electrical panel, plumbing, and water heater last replaced?
- What does the HOA fee cover, when was the last increase, and are there any pending special assessments or reserve-fund shortfalls?
- Any open or pending special assessments — roof, HVAC, plumbing, elevator, façade? What's the per-unit balance and payoff schedule, and is the seller paying it off at close or rolling it to the buyer?
- Why hasn't it sold? Are there any deal-killer items the seller is aware of (foundation, flood, title, zoning, code violations)?
- Is there a deadline driving the sale (1031 exchange, divorce, estate, relocation)? That informs how much negotiation room exists.
- Schools are D-rated, which usually means shorter tenancies and higher turnover. Who's the typical renter profile here, and what's been the actual vacancy rate?
- Crime grade is F in this area — have there been break-ins, vandalism, or insurance claims at this property in the last 3 years? What carrier currently insures it and at what premium?
- What's the average days-on-market for RENTAL listings here right now (not sales)? A rising rental-DOM trend means longer vacancies and softer asking-rent achievability than the comps imply.
- What's the recent tenant-quality profile in this submarket — average credit score on applications, eviction rate, late-payment / NSF rate, and stable-employment percentage? A property-management company in the area should have these aggregated.
- How much new apartment / multifamily construction is in the pipeline within 1–3 miles? Heavy new supply (>2% of stock underway) typically softens rents 12–24 months out; light construction supports rent growth.
Investment metrics
- 1% rule
- 1.71% ✓
- Cap rate
- 8.85%
- Cash-on-cash
- 9.14%
- DSCR
- 1.41
- GRM
- 4.9
CMA / ARV
No comps found within radius.
Projected returns pro-forma
-3.0% appreciation · 0.61% rent growth · sell at horizon
- IRR
- -6.3%
- Equity multiple
- 0.77×
- Total profit
- $-4,115
- Equity at exit
- $9,692
- IRR
- -1.5%
- Equity multiple
- 0.91×
- Total profit
- $-1,618
- Equity at exit
- $5,620
Cash invested: $18,200 (down + closing). Projections, not guarantees.
Landlord ↔ Tenant lean methodology
- Overall (STATE)
- 87 Strongly Landlord-Friendly
- State Texas
- 87 Strongly Landlord-Friendly · R+5
- County
- — inherits STATE
- City
- — inherits STATE
ZIP-level market 77074
- Home prices YoY
- -15.1%
- Rents YoY
- 0.6%
- Active inventory
- 103
- Price-to-rent
- 4.9×
Monthly cashflow live
- Estimated rent
- $1,110 high interval (Pro) →
- Mortgage (P&I)
- −$341
- Tax from tax record
- −$110 /mo · $1,321/yr
- Insurance
- −$27
- HOA
- −$260
- Vacancy / Maint / Mgmt
- −$233
- Net cashflow
- $139
Break-even live
UW: 25.0% down · 7.5% · 30yr · 1.5% tax · 5.0% vac · 8.0% maint · 8.0% mgmt
Financing live
Cash to close
- Down payment
- $16,250
- Closing costs
- $1,950
- Reserves months
- —
- Total cash needed
- —
Loan-product check · same deal, 3 products live
Conventional
25% down · 7.5% · 30yr
- Down + closing
- —
- Monthly P&I
- —
- Monthly cashflow
- —
- DSCR
- —
- Eligible?
- —
Personal DTI + credit; lowest rate.
DSCR
20% down · 8.5% · 30yr
- Down + closing
- —
- Monthly P&I
- —
- Monthly cashflow
- —
- DSCR
- —
- Eligible?
- —
No personal income docs; deal must DSCR.
Hard money
10% down · 12.0% · 12mo
- Down + closing
- —
- Monthly P&I
- —
- Monthly cashflow
- —
- DSCR
- —
- Eligible?
- —
Short-term bridge; refi at stabilization.
Rent comps 40 comps
| Address | Beds | Baths | Sqft | Rent | $/sqft | DOM | Units | Dist |
|---|---|---|---|---|---|---|---|---|
| 8901 Bissonnet St Unit 068 Houston, TX | 2.0 | 2.0 | 1175 | $950 | $0.81 | 43d | 1 | 0.07mi |
| 8901 Bissonnet St Unit 235 Houston, TX | 3.0 | 2.0 | 1250 | $1,150 | $0.92 | 43d | 1 | 0.07mi |
| 8901 Bissonnet St Apt 253 Houston, TX | 2.0 | 2.0 | 1100 | $900 | $0.82 | 43d | 1 | 0.07mi |
| 8901 Bissonnet St Unit 038 Houston, TX | 2.0 | 1.0 | 950 | $800 | $0.84 | 43d | 1 | 0.07mi |
| 8901 Bissonnet St Unit 129 Houston, TX | 2.0 | 1.0 | 750 | $740 | $0.99 | 43d | 1 | 0.07mi |
| 8918 Bissonnet St Houston, TX | 2.0 | 2.0 | 1034 | $1,300 | $1.26 | 43d | 1 | 0.14mi |
| 9001 S Braeswood Blvd Houston, TX | 1.0–2.0 | 1.0–2.0 | 739 | $852 | $1.15 | 1d | 26 | 0.15mi |
| 9001 S Braeswood Blvd Houston, TX | 1.0–2.0 | 1.0–2.0 | 739 | $971 | $1.31 | 43d | 26 | 0.15mi |
| 9707 Braeburn Glen Blvd Houston, TX | 1.0–3.0 | 1.0–2.0 | 905 | $1,070 | $1.18 | 7d | 15 | 0.16mi |
| 8901 Bissonnet St Houston, TX | 1.0–3.0 | 1.0–2.0 | 962 | $952 | $0.99 | 1d | 14 | 0.16mi |
| 8700 Gustine Ln Houston, TX | 1.0–2.0 | 1.0–2.0 | 752 | $1,004 | $1.33 | 1d | 25 | 0.43mi |
| 8700 Gustine Ln Houston, TX | 1.0–2.0 | 1.0–2.0 | 752 | $1,035 | $1.38 | 43d | 20 | 0.43mi |
| 9707 S Gessner Rd Houston, TX | 2.0 | 1.0–2.0 | 726 | $1,189 | $1.64 | 1d | 74 | 0.45mi |
| 30 Gustine Ln Houston, TX | 1.0 | 1.0 | 757 | $775 | $1.02 | 43d | 1 | 0.47mi |
| 10222 S Gessner Rd Houston, TX | 2.0 | 2.0 | 1030 | $1,239 | $1.20 | 43d | 1 | 0.62mi |
| 10222 S Gessner Rd Houston, TX | 1.0 | 1.0 | 740 | $899 | $1.21 | 12d | 1 | 0.62mi |
| 10222 S Gessner Rd Unit 1165 Houston, TX | 1.0 | 1.0 | 740 | $907 | $1.23 | 2d | 1 | 0.63mi |
| 10222 S Gessner Rd Unit 2162 Houston, TX | 2.0 | 2.0 | 910 | $1,080 | $1.19 | 5d | 1 | 0.63mi |
| 10222 S Gessner Rd Unit 1162 Houston, TX | 1.0 | 1.0 | 740 | $910 | $1.23 | 5d | 1 | 0.63mi |
| 10222 S Gessner Rd Unit 2112 Houston, TX | 2.0 | 2.0 | 910 | $1,072 | $1.18 | 2d | 1 | 0.63mi |
| 10222 S Gessner Rd Unit 324 Houston, TX | 1.0 | 1.0 | 740 | $910 | $1.23 | 7d | 1 | 0.63mi |
| 10222 S Gessner Rd Unit 422 Houston, TX | 2.0 | 2.0 | 910 | $1,080 | $1.19 | 7d | 1 | 0.63mi |
| 10222 S Gessner Rd Unit 10273 Houston, TX | 1.0 | 1.0 | 740 | $940 | $1.27 | 43d | 1 | 0.63mi |
| 10222 S Gessner Rd Unit 10243 Houston, TX | 1.0 | 1.0 | 740 | $949 | $1.28 | 10d | 1 | 0.63mi |
| 10222 S Gessner Rd Unit 10243 Houston, TX | 1.0 | 1.0 | 740 | $945 | $1.28 | 13d | 1 | 0.63mi |
| 10228 S Gessner Rd Houston, TX | 1.0 | 1.0 | 740 | $905 | $1.22 | 43d | 1 | 0.73mi |
| 10750 Westbrae Pkwy Unit 2047 Houston, TX | 2.0 | 2.0 | 838 | $1,159 | $1.38 | 2d | 1 | 0.77mi |
| 10750 Westbrae Pkwy Unit 10807 Houston, TX | 2.0 | 2.0 | 838 | $1,159 | $1.38 | 10d | 1 | 0.77mi |
| 10750 Westbrae Pkwy Unit 422 Houston, TX | 2.0 | 2.0 | 838 | $1,135 | $1.35 | 7d | 1 | 0.77mi |
| 10750 Westbrae Pkwy Unit 2165 Houston, TX | 2.0 | 2.0 | 838 | $1,127 | $1.34 | 2d | 1 | 0.77mi |
| 10756 Westbrae Pkwy Houston, TX | 2.0 | 2.0 | 838 | $1,145 | $1.37 | 43d | 1 | 0.81mi |
| 8917 S Gessner Rd Houston, TX | 1.0–3.0 | 1.0–2.0 | 871 | $938 | $1.08 | 1d | 15 | 0.84mi |
| 8243 Creekbend Dr Houston, TX | 2.0 | 2.0 | 1150 | $1,350 | $1.17 | 24d | 1 | 0.92mi |
| 8110 Creekbend Dr Apt 115 Houston, TX | 2.0 | 1.0 | 850 | $1,181 | $1.39 | 24d | 1 | 0.93mi |
| 8110 Creekbend Dr Apt 616 Houston, TX | 1.0 | 1.0 | 710 | $921 | $1.30 | 43d | 1 | 0.93mi |
| 8110 Creekbend Dr Apt 305 Houston, TX | 3.0 | 1.5 | 747 | $1,007 | $1.35 | 24d | 1 | 0.93mi |
| 8110 Creekbend Dr Unit 113 Houston, TX | 2.0 | 2.0 | 915 | $1,260 | $1.38 | 24d | 1 | 0.93mi |
| 8110 Creekbend Dr Apt 628 Houston, TX | 1.0 | 1.0 | 710 | $920 | $1.30 | 24d | 1 | 0.93mi |
| 9350 Country Creek St Houston, TX | 3.0 | 2.0 | 1272 | $1,500 | $1.18 | 43d | 1 | 0.94mi |
| 9303 Woodfair Dr Houston, TX | 1.0–2.0 | 1.0–2.0 | 791 | $1,045 | $1.32 | 43d | 42 | 1.04mi |
HOA detail condo
- Monthly dues
- $260 · $3,120/yr
- Likely covers
- security
- Assessments
- None detected in remarks — confirm with the listing agent.
Listing history 10 events
-
2026-05-31days on market $65,000 Active 273 DOM
-
2025-08-31$65,000 Active 585-char remark
Show marketing remark (585 chars)
Charming 1-Bedroom Condo in Gated Braeswood Community – Ideal for Investors, Downsizers, or First-Time Buyers! Located in the secure and well-maintained Braeswood Condos of Houston, TX, this inviting 1-bedroom unit offers high ceilings and an open-concept living space that feels bright and spacious. Enjoy convenient access to highways 59 and 610, with close proximity to Downtown Houston and the Texas Medical Center. Whether you're looking to invest, downsize, or purchase your first home, this condo is a must-see. Come discover why it’s the perfect place to call home!
-
2025-08-01soldstatus
-
2022-03-31soldstatus
-
2022-02-03soldstatus Sold 220-char remark
Show marketing remark (220 chars)
This newly renovated unit has been updated with new floors throughout and brand new kitchen appliances. It is centrally located, with easy access to Hwy 59 and 610 for easy access to both downtown and the medical center.
-
2022-01-26status Pending 220-char remark
Show marketing remark (220 chars)
This newly renovated unit has been updated with new floors throughout and brand new kitchen appliances. It is centrally located, with easy access to Hwy 59 and 610 for easy access to both downtown and the medical center.
-
2021-12-17status Active 220-char remark
Show marketing remark (220 chars)
This newly renovated unit has been updated with new floors throughout and brand new kitchen appliances. It is centrally located, with easy access to Hwy 59 and 610 for easy access to both downtown and the medical center.
-
2021-12-16status Option Pending 220-char remark
Show marketing remark (220 chars)
This newly renovated unit has been updated with new floors throughout and brand new kitchen appliances. It is centrally located, with easy access to Hwy 59 and 610 for easy access to both downtown and the medical center.
-
2021-11-14$55,000 Active 220-char remark
Show marketing remark (220 chars)
This newly renovated unit has been updated with new floors throughout and brand new kitchen appliances. It is centrally located, with easy access to Hwy 59 and 610 for easy access to both downtown and the medical center.
-
1999-04-27soldstatus $15,000
ⓘ Source: listings_history table (triggers on properties + properties_extension) + one-shot
backfill from property_details.listing_events for pre-trigger history.
Tax reassessment forecast TX · Resets to sale price
- Current annual tax
- $1,321 · $110/mo
- Projected year-2 tax
- $1,321 · $110/mo
- Expected delta
- $0/yr ($0/mo · 0.0%)
ⓘ Screening estimate from a state-policy table — verify with the county assessor before closing.
Climate risk First Street
- Flood 1/10 Low FEMA zone X (shaded) · 0% chance over 30 yrs
- Wildfire 1/10 Low
- Heat 9/10 Extreme 7 d/yr ≥110°F today · 24 d/yr by 30 yrs out
- Wind 9/10 Extreme 99% chance of damaging wind over 30 yrs
- Air quality 2/10 Low 2 unhealthy d/yr today · 2 by 30 yrs out
Nearby sold comps map
Loading sold comps map…
Walkable amenities ~0.75 mi
Loading nearby amenities…
Taxation est. · year 1
- Rental income
- $13,317
- − Mortgage interest
- −$3,641
- − Property taxes
- −$1,321
- − Insurance
- −$325
- − Repairs & maintenance
- −$1,065
- − Management
- −$1,065
- − HOA
- −$3,120
- − Depreciation
- −$1,891
- Taxable income
- $888
- Est. tax owed @ 24.0%
- −$213
- After-tax cash flow
- $1,451/yr
For passive investors: Depreciation is non-cash, so a rental often shows a tax loss while cash-flowing — sheltering income. Rental losses are passive: they offset passive income freely, and up to $25,000/yr can offset ordinary (W-2) income if you actively participate and your MAGI is under $100k (phasing out to $0 by $150k); unused losses carry forward. On sale, claimed depreciation is recaptured at up to 25%, and gains may owe capital-gains tax (a 1031 exchange can defer both). Figures are a year-1 estimate at your 24.0% rate — not tax advice; consult a CPA.
Schools (NCES district)
- District
- Houston ISD
- NCES district ID
- 4823640
- Math proficiency
- 27% ▼ -18.00%
- Reading proficiency
- 35% ▼ -6.00%
- Median HH income
- $46,054
- Composite
- 26.63/100
- National rank
- #7173
- State rank
- #593 of 826 in TX
Livability — Houston
- Score
- 74/100
- State rank
- #184
- US rank
- #4771
Category grades
Schools grade is shown separately in the Schools card above.
Census & demographics
- Census place
- Houston, TX
- County
- Harris County · 4,702,590 people
- City population
- 3,226,434
- Metro
- Houston-The Woodlands-Sugar Land, TX
- Population (ZIP)
- 38,660
- Household income
- $47,810
- Rent vs Own
- Severe rent burden
- 2019.0
Population outlook (Harris County) Hauer SSP2
- Today (2025)
- 5,571,493 people
- By 2030
- 6,089,821 · +9.3%
- By 2040
- 7,142,806 · +28.2%
- By 2050
- 8,185,864 · +46.9%
- By 2075
- 10,574,329 · +89.8%
- By 2100
- 12,109,958 · +117.4%
Race, ethnicity, and origin ACS 2023
- Neighborhood character
- Diverse neighborhood (Simpson 0.57)
- Race & ethnicity
- Hispanic / Latino 62% Two or more races 22% White 14% Black 13% Asian 8% Native American 1%
- Hispanic origin (detail)
- Mexican 30%
- Common ancestry
- Arab 2% Italian 1% Slovak 1%
- Foreign-born
- 53% · Canada, Vietnam, Jamaica
- Languages at home
- 23% English-only · Spanish 59% Other Indo-European 5% Arabic 3%
Political lean MEDSL · Harris
- 2024 margin
- Lean D (+5.5) · D 52.0% · R 46.4% · Other 1.6%
- 2008→2024 swing
- +3.9pp toward D · 2008: 1.6pp · 2024: 5.5pp
- All cycles
- 2024: D+5.5 2020: D+13.3 2016: D+12.4 2012: D+0.1 2008: D+1.6
Not yet ingested
- Civics
- —
Market trends
- HPI YoY
- ▼ -52.20%
- Current HPI
- 293.2864
- Rent YoY
- ▲ 0.61%
- Metro
- Houston-The Woodlands-Sugar Land, TX
- State GDP YoY
- ▲ 3.95%
- F500 in state
- 110
Industry mix (Fortune 500 HQ in TX)
| Industry | F500 HQs | Revenue |
|---|---|---|
| Energy | 16 | $1,198B |
|
||
| Technology | 5 | $198B |
|
||
| Engineering / Construction | 4 | $72B |
|
||
| Energy Services | 3 | $60B |
|
||
| Utilities | 3 | $41B |
|
||
| Healthcare | 2 | $330B |
|
||
Price history
+333.3% since first listed9 events — show timeline
- 2025-08-31 Listed $65,000 HARMLS
- 2025-08-01 Sold (Public Records) — Public Records
- 2022-03-31 Sold (Public Records) — Public Records
- 2022-02-03 Sold (MLS) — HARMLS
- 2022-01-26 Pending — HARMLS
- 2021-12-17 Relisted — HARMLS
- 2021-12-16 Pending — HARMLS
- 2021-11-14 Listed $55,000 HARMLS
- 1999-04-27 Sold (Public Records) $15,000 Public Records
Property tax history
+7.2%/yrLatest (2025): $1,321 · -10.1% YoY. Source: county tax records.
Cash-flow waterfall
monthlySold comps — $/sqft
last 12 mo · ≤1 miLoading sold comps…