1273 S Rice Rd #20 · Mira Monte, CA
Flood risk 1/10 · Minimal
- FEMA flood zone
- X (unshaded)
- Chance of flooding over 30 yrs
- 0.0%
- Est. flood insurance / yr
- $507 – $1,088
Fire risk 5/10 · Moderate
- Est. fire insurance / yr
- $659 – $1,223
Heat risk 5/10 · Moderate
- Hot days now (above 96°F)
- 8 days/yr
- Hot days in 30 yrs
- 19 days/yr
Wind risk 1/10 · Minimal
- Chance of severe wind over 30 yrs
- —
Air-quality risk 8/10 · Major
- Unhealthy air days now
- 12 days/yr
- Unhealthy air days in 30 yrs
- 12 days/yr
Risk factors via First Street. Map © Google.
Why this score? — see what drove the C- grade
The composite is a weighted blend of 9 inputs, each scored 0–100. Each bar is that input's sub-score; the figure is the points it added to the 100-point composite (weight × sub-score).
- Cash flow +26.2/30.0
- DSCR +8.9/10.0
- 1% rule +7.0/10.0
- Schools +3.2/10.0
- Livability +3.2/5.0
- Rent growth +2.5/5.0
- Condition / age +2.5/5.0
- ARV discount +0.0/15.0
- Appreciation +0.0/10.0
$273,500
🖨 Deal sheet 📄 Offer letter ✓ Due diligence
Listing remarks MLS
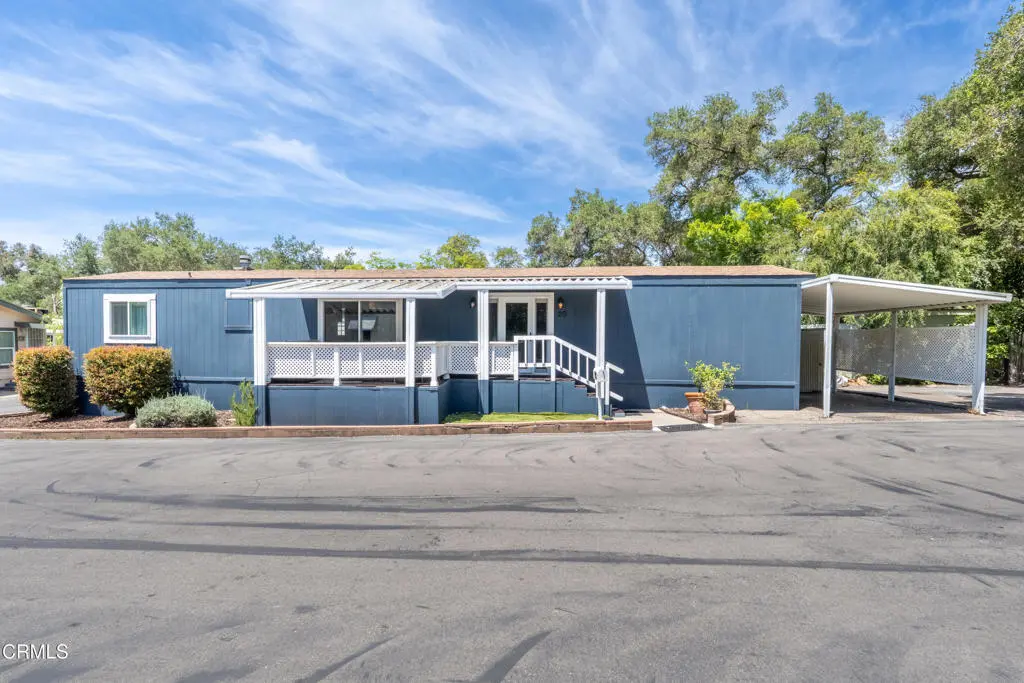
Welcome home to this charming and well-maintained residence located on a desirable corner lot in the highly sought-after Golden Oaks 55+ community. Offering approximately 860 square feet of comfortable living space, this thoughtfully designed home features a split floor plan that provides privacy and functionality, along with higher ceilings that create an open and airy feel throughout. The inviting interior showcases vinyl plank flooring, updated windows, and a mini-split system for year-round comfort. The spacious kitchen is enhanced with granite countertops and soft-close cabinetry, while all appliances are included for an easy move-in experience. Ideally situated near the clubhouse, pool and guest parking, this home allows you to enjoy all the wonderful amenities Golden Oaks has to offer. You'll also love being just moments from scenic hiking trails, local shops, and popular restaurants, making it easy to enjoy the best of the Ojai lifestyle. Space rent is $827.39 per month.
Key facts
- Mini-split system
- Updated windows
- Split floor plan
Tags
Property features AI
Finance
- Other: Rent includes trash, water, and sewer; Manager approval required for residency; Pets allowed with size/number/breed restrictions (contact manager for details)
- Financial info: Land lease in park (monthly) — amount listed separately
- HOA & community: Senior community; Park name: Golden Oaks; Community features include horse trails, golf course, dog park, hiking, mountainous terrain, fishing, lake, preserve/public land, park
Exterior
- Parking: Detached carport (1 space)
- Utilities: Sewer paid; Sewer available; Water connected; Mutual water company
- Home design: Mobile home remains on site; Mobile dimensions approximately 18' x 48'; Pier jacks foundation; Composition (shingle) roof
- Construction: Pier jacks foundation; Composition roof; Mobile construction (seller source for living area/year built)
- Exterior features: Deck/patio; Community pool (fenced); One shed; Estimated lot size; Sprinklers: none; Has a view
Interior
- Kitchen: Refrigerator; Range/stove with hood; Dishwasher; Gas water heater
- Flooring: Vinyl flooring; Carpet; Wood; Laminate
- Bathrooms: Two full bathrooms; Bathtub and walk-in shower
- Heating & cooling: Ductless heating; Ductless cooling
- Interior features: Double-pane, insulated windows; Remodeled bathroom features
- Laundry & utility: Indoor laundry with gas dryer hookup; Stackable washer/dryer possible
Neighborhood map
What this means for you Summary
Snapshot
- This is a 2-bed/2.0-bath manufactured listed at $274k.
Deal economics
- At list price, monthly cash flow is $700 ($8k/yr) — positive.
- The deal already cash-flows at list — no discount required.
- Meets the 1% rule at list price ($3k rent vs $274k).
- Cap rate 9.4% vs local median 3.2% in Mira Monte — top-decile yield for the area; either an underpriced asset or a hidden risk that comps aren't pricing in. Stress-test before assuming the spread holds.
Location & tenants
- Location reads 64/100 on livability (#401 in CA) — a middle-class / working-renter tenant base. Strengths: commute A+, employment A+, crime A-; Watch: amenities F, cost of living F.
- Ojai Unified (suburban): math 27% / reading 43% proficiency, ranked #257 of 517 in CA (top 50%) — families likely to look elsewhere, expect single-tenant / working-renter base with shorter leases.
- Market conditions: 135 active listings in the ZIP; 3 comparable units currently listed for rent nearby; rentals at typical pace (median 16d on market — plan ~3-4 weeks tenant-placement turnaround); solid renter incomes; 1,759 units permitted in Ventura County in 2024 (1,196 in 5+ unit buildings).
- At $3,279/mo this rent would consume 49% of the median local household income ($81k/yr) (locally 723% of renters already pay >50% of income on rent) — very limited rent-growth headroom before tenants either downsize or default.
Forward outlook
- Local home prices are declining (-3.0%/yr); year-one equity from $2k of loan paydown is wiped out by about $8k of value loss. Plan a longer hold.
- Ventura County population projected at +4% by 2050 — modest demand growth; plan on rents tracking national, not racing it.
- At projected returns (-3.0% appreciation + 3.0% rent growth), your $77k cash investment doubles in ~10 years — after that, you're playing with house money.
Negotiation context
- Only 14 days on market — expect competitive offers; lowballing is unlikely to land.
- 2 sale attempts with the ask held roughly flat each time — persistent listings suggest the price (not the market) is what's stuck; bring a comps-based counter.
Risks & watch-outs
- Climate carrying-cost: moderate wildfire risk; extreme-heat days projected 8→19/yr by 2055 (HVAC capex compounding) — expect insurance premiums to compound above CPI over the hold.
Questions for the listing agent
- Is there a deadline driving the sale (1031 exchange, divorce, estate, relocation)? That informs how much negotiation room exists.
- Schools are B-rated — typically a magnet for longer-tenancy family renters. What's the average tenant stay here, and is there a school-zone premium baked into asking?
- What's the average days-on-market for RENTAL listings here right now (not sales)? A rising rental-DOM trend means longer vacancies and softer asking-rent achievability than the comps imply.
- What's the recent tenant-quality profile in this submarket — average credit score on applications, eviction rate, late-payment / NSF rate, and stable-employment percentage? A property-management company in the area should have these aggregated.
- How much new for-sale + rental construction is in the pipeline within 1–3 miles? Heavy new supply typically softens prices + rents 12–24 months out; constrained supply supports both.
Investment metrics
- 1% rule
- 1.20% ✓
- Cap rate
- 9.37%
- Cash-on-cash
- 10.98%
- DSCR
- 1.49
- GRM
- 7.0
CMA / ARV
- ARV (on-the-fly)
- $194,040
- Comps found
- 8
Show comp detail 8 sales within ~0.75 mi
| Address | Dist | Beds/Ba | Sqft | Sold | Price | $/sf | Match |
|---|---|---|---|---|---|---|---|
| 1273 S Rice Rd #45 | 0.09mi | 1/1.0 (-1) | 800 (-5%) | 1mo | $246,800 | $309 | 78 |
| 1225 S Rice Rd #26 | 0.11mi | 2/1.0 | 788 (-6%) | 17mo | $135,000 | $171 | 66 |
| 1225 S Rice Rd #38 | 0.09mi | 2/1.0 | 800 (-5%) | 22mo | $122,000 | $153 | 66 |
| 129 Don Felipe Way | 0.43mi | 2/2.0 | 800 (-5%) | 20mo | $207,500 | $259 | 55 |
| 129 Don Felipe Way #129 | 0.44mi | 2/2.0 | 800 (-5%) | 20mo | $207,500 | $259 | 55 |
| 62 Don Antonio Way #62 | 0.36mi | 1/1.0 (-1) | 800 (-5%) | 22mo | $152,500 | $191 | 48 |
| 62 Don Antonio Way | 0.36mi | 1/1.0 (-1) | 800 (-5%) | 22mo | $152,500 | $191 | 48 |
| 700 W Villanova Rd #22 | 0.64mi | 2/1.0 | 864 (+3%) | 20mo | $200,000 | $231 | 44 |
Match score weights: distance 35% · size 25% · config 20% · recency 20%. Top-matched comps best support the ARV.
Projected returns pro-forma
-3.0% appreciation · 3.0% rent growth · sell at horizon
- IRR
- 0.1%
- Equity multiple
- 1.00×
- Total profit
- $340
- Equity at exit
- $40,780
- IRR
- 9.8%
- Equity multiple
- 1.76×
- Total profit
- $57,938
- Equity at exit
- $23,647
Cash invested: $76,580 (down + closing). Projections, not guarantees.
Landlord ↔ Tenant lean methodology
- Overall (STATE)
- 18 Strongly Tenant-Friendly
- State California
- 18 Strongly Tenant-Friendly · D+13
- County
- — inherits STATE
- City
- — inherits STATE
ZIP-level market 93023
- Active inventory
- 135
- Price-to-rent
- 7.0×
Monthly cashflow live
- Estimated rent
- $3,279 medium interval (Pro) →
- Mortgage (P&I)
- −$1,434
- Tax est. 1.5%
- −$342 /mo · $4,102/yr
- Insurance
- −$114
- HOA
- −$0
- Vacancy / Maint / Mgmt
- −$689
- Net cashflow
- $700
Break-even live
UW: 25.0% down · 7.5% · 30yr · 1.5% tax · 5.0% vac · 8.0% maint · 8.0% mgmt
Financing live
Cash to close
- Down payment
- $68,375
- Closing costs
- $8,205
- Reserves months
- —
- Total cash needed
- —
Loan-product check · same deal, 3 products live
Conventional
25% down · 7.5% · 30yr
- Down + closing
- —
- Monthly P&I
- —
- Monthly cashflow
- —
- DSCR
- —
- Eligible?
- —
Personal DTI + credit; lowest rate.
DSCR
20% down · 8.5% · 30yr
- Down + closing
- —
- Monthly P&I
- —
- Monthly cashflow
- —
- DSCR
- —
- Eligible?
- —
No personal income docs; deal must DSCR.
Hard money
10% down · 12.0% · 12mo
- Down + closing
- —
- Monthly P&I
- —
- Monthly cashflow
- —
- DSCR
- —
- Eligible?
- —
Short-term bridge; refi at stabilization.
Rent comps 3 comps
| Address | Beds | Baths | Sqft | Rent | $/sqft | DOM | Units | Dist |
|---|---|---|---|---|---|---|---|---|
| 714 S La Luna Ave Unit A Ojai, CA | 1.0 | 1.0 | 1000 | $2,600 | $2.60 | 19d | 1 | 0.72mi |
| 750 Highland Dr Ojai, CA | 1.0–2.0 | 1.0 | 750 | $2,995 | $3.99 | 2d | 4 | 0.84mi |
| 223 S Padre Juan Ave Ojai, CA | 3.0 | 1.0 | 1050 | $3,400 | $3.24 | 16d | 1 | 1.35mi |
Listing history 12 events
-
2026-06-18days on market $273,500 Active 14 DOM
-
2026-06-17days on market $273,500 Active 13 DOM
-
2026-06-16days on market $273,500 Active 12 DOM
-
2026-06-15days on market $273,500 Active 11 DOM
-
2026-06-13days on market $273,500 Active 9 DOM
-
2026-06-13days on market $273,500 Active 8 DOM
-
2026-06-10days on market $273,500 Active 6 DOM
-
2026-06-09days on market $273,500 Active 5 DOM
-
2026-06-08days on market $273,500 Active 4 DOM
-
2026-06-07days on market $273,500 Active 3 DOM
-
2026-06-05remarks 699-char remark
-
2026-06-05$273,500 Active 1 DOM
ⓘ Source: listings_history table (triggers on properties + properties_extension) + one-shot
backfill from property_details.listing_events for pre-trigger history.
Climate risk First Street
- Flood 1/10 Low FEMA zone X (unshaded) · 0% chance over 30 yrs
- Wildfire 5/10 Major
- Heat 5/10 Major 8 d/yr ≥96°F today · 19 d/yr by 30 yrs out
- Wind 1/10 Low
- Air quality 8/10 Severe 12 unhealthy d/yr today · 12 by 30 yrs out
Nearby sold comps map
Loading sold comps map…
Walkable amenities ~0.75 mi
Loading nearby amenities…
Taxation est. · year 1
- Rental income
- $39,349
- − Mortgage interest
- −$15,320
- − Property taxes
- −$4,102
- − Insurance
- −$1,368
- − Repairs & maintenance
- −$3,148
- − Management
- −$3,148
- − Depreciation
- −$7,956
- Taxable income
- $4,307
- Est. tax owed @ 24.0%
- −$1,034
- After-tax cash flow
- $7,371/yr
For passive investors: Depreciation is non-cash, so a rental often shows a tax loss while cash-flowing — sheltering income. Rental losses are passive: they offset passive income freely, and up to $25,000/yr can offset ordinary (W-2) income if you actively participate and your MAGI is under $100k (phasing out to $0 by $150k); unused losses carry forward. On sale, claimed depreciation is recaptured at up to 25%, and gains may owe capital-gains tax (a 1031 exchange can defer both). Figures are a year-1 estimate at your 24.0% rate — not tax advice; consult a CPA.
Schools (NCES district)
- District
- Ojai Unified
- NCES district ID
- 0628270
- Math proficiency
- 27% ▼ -5.00%
- Reading proficiency
- 43% ▼ -1.00%
- Median HH income
- $67,618
- Composite
- 31.97/100
- National rank
- #5839
- State rank
- #257 of 517 in CA
Livability — Mira Monte
- Score
- 64/100
- State rank
- #401
- US rank
- #13701
Category grades
Schools grade is shown separately in the Schools card above.
Census & demographics
- Census place
- Mira Monte, CA
- County
- Ventura County · 829,955 people
- Metro
- Oxnard-Thousand Oaks-Ventura, CA
- Population (ZIP)
- 21,036
- Household income
- $80,927
- Rent vs Own
- Severe rent burden
- 723.0
Population outlook (Ventura County) Hauer SSP2
- Today (2025)
- 895,754 people
- By 2030
- 912,134 · +1.8%
- By 2040
- 931,454 · +4.0%
- By 2050
- 934,609 · +4.3%
- By 2075
- 924,899 · +3.3%
- By 2100
- 864,712 · -3.5%
Race, ethnicity, and origin ACS 2023
- Neighborhood character
- Predominantly White (71%)
- Race & ethnicity
- White 71% Hispanic / Latino 20% Two or more races 10% Asian 3%
- Hispanic origin (detail)
- Mexican 17%
- Common ancestry
- Slovak 4% Portuguese 3% Italian 2%
- Foreign-born
- 15% · Canada, South Korea
- Languages at home
- 80% English-only · Spanish 15% German/W. Germanic 2% Other Indo-European 1%
Political lean MEDSL · Ventura
- 2024 margin
- D (+15.1) · D 56.1% · R 41.0% · Other 2.9%
- 2008→2024 swing
- +2.8pp toward D · 2008: 12.3pp · 2024: 15.1pp
- All cycles
- 2024: D+15.1 2020: D+21.1 2016: D+16.8 2012: D+5.3 2008: D+12.3
Not yet ingested
- Civics
- —
Market trends
- HPI YoY
- ▼ -942.31%
- Current HPI
- 331.6103
- Rent YoY
- —
- Metro
- Oxnard-Thousand Oaks-Ventura, CA
- State GDP YoY
- ▲ 3.21%
- F500 in state
- 116
Industry mix (Fortune 500 HQ in CA)
| Industry | F500 HQs | Revenue |
|---|---|---|
| Technology | 27 | $1,492B |
|
||
| Financial Services | 3 | $174B |
|
||
| Retail | 3 | $44B |
|
||
| Insurance | 3 | $26B |
|
||
| Media / Entertainment | 2 | $115B |
|
||
| Pharmaceuticals / Biotech | 2 | $62B |
|
||
Price history
+0.0% since first listed2 events — show timeline
- 2026-06-04 Listed $273,500 CRMLS
- 2026-06-03 Listed $273,500 OVMLS
Property tax history
+6.5%/yrLatest (2025): $187 · +1.7% YoY. Source: county tax records.
Cash-flow waterfall
monthlySold comps — $/sqft
last 12 mo · ≤1 miLoading sold comps…