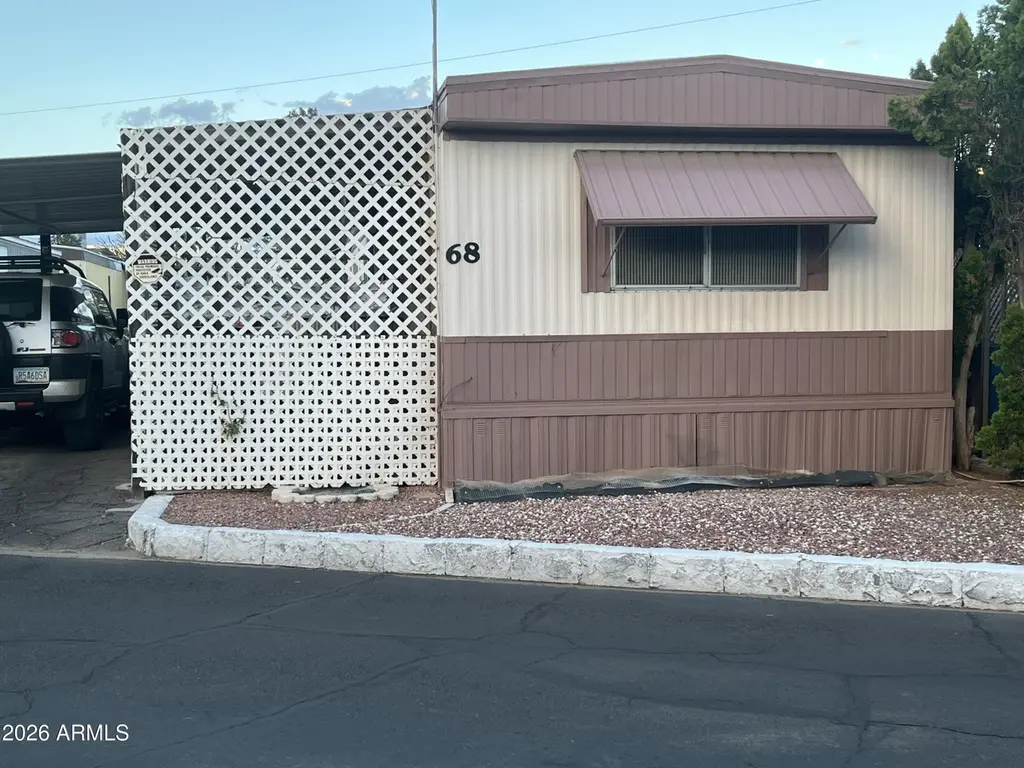
3150 W Glendale Ave #68 · Phoenix, AZ
Flood risk 1/10 · Minimal
- FEMA flood zone
- X (shaded)
- Chance of flooding over 30 yrs
- 0.0%
- Est. flood insurance / yr
- $507 – $1,088
Fire risk 1/10 · Minimal
- Est. fire insurance / yr
- $610 – $1,132
Heat risk 9/10 · Severe
- Hot days now (above 112°F)
- 7 days/yr
- Hot days in 30 yrs
- 17 days/yr
Wind risk 1/10 · Minimal
- Chance of severe wind over 30 yrs
- —
Air-quality risk 3/10 · Minor
- Unhealthy air days now
- 3 days/yr
- Unhealthy air days in 30 yrs
- 3 days/yr
Risk factors via First Street. Map © Google.
Why this score? — see what drove the B- grade
The composite is a weighted blend of 9 inputs, each scored 0–100. Each bar is that input's sub-score; the figure is the points it added to the 100-point composite (weight × sub-score).
- Cash flow +30.0/30.0
- 1% rule +10.0/10.0
- DSCR +10.0/10.0
- ARV discount +7.5/15.0
- Livability +3.8/5.0
- Schools +2.3/10.0
- Condition / age +2.2/5.0
- Rent growth +1.7/5.0
- Appreciation +0.0/10.0
$45,000
🖨 Deal sheet 📄 Offer letter ✓ Due diligence
Listing remarks
Charming 2 B/R 1 Bath Tub and Shower with Sprayer. Spacious Master Bedroom with plenty of Closet Space. Dinning in Kitchen Area. Beautiful Cabinetry, Refrigerator will convey. Built in Shelf in Dinning Area. Beautiful and Spacious Living Room with Beautiful Picture Windows. Security Camara inside and Front Area. Has Ramp with rails and Front Doorsteps. Security Metal Front Door. Fencing all around, Gravel Landscape. Washer and Dryer will convey. This Beautiful Mobile Home Shows Pride of Ownership, Waiting for The Perfect Future Owners. Price to Sell! Better Hurry it won't Last!
Key facts
- Fencing all around
- Tub and shower
- Built in shelf
Tags
Property features AI
Finance
- HOA & community: Land lease: $850 monthly; Community pool; No association fees
Exterior
- Parking: 1 covered parking space; 1 carport space
- Utilities: City water; Public sewer
- Home design: Manufactured/Mobile home; Leasehold property
- Construction: Steel frame construction; Painted exterior; Composition roof
- Exterior features: Gravel/stone front and back; Asphalt road access
Interior
- Kitchen: Eat-in kitchen
- Bedrooms: 2 possible bedrooms
- Flooring: Laminate flooring
- Bathrooms: 1 full bathroom
- Heating & cooling: Heat pump heating; Central air conditioning
- Interior features: Eat-in kitchen
Neighborhood map
What this means for you Summary
Snapshot
- This is a 2-bed/1.0-bath manufactured listed at $45k. Condition is rated fair.
Deal economics
- At list price, monthly cash flow is $603 ($7k/yr) — positive.
- The deal already cash-flows at list — no discount required.
- Meets the 1% rule at list price ($1k rent vs $45k).
- Recommended offer: $42k (6.0% below list) — sets the bar for market timing.
- Cap rate 22.4% vs local median 3.3% in Phoenix — top-decile yield for the area; either an underpriced asset or a hidden risk that comps aren't pricing in. Stress-test before assuming the spread holds.
Location & tenants
- Location reads 75/100 on livability (#16 in AZ, #3,924 nationally) — a middle-class / working-renter tenant base. Strengths: amenities A+, commute A+, housing A+; Watch: health & safety C-, crime F.
- Glendale Union High School District (4285) (urban): math 23% / reading 31% proficiency, ranked #130 of 249 in AZ (top 52%) — low school quality limits family demand, transient renter base, plan for 1-2y turnover.
- Zoned schools: Glendale High School (math 13% / reading 22%, grade F, #245 of 381 statewide, top 65%, 1,816 students, 76% FRL).
- Market conditions: Rents falling (-3.0%/yr); 117 active listings in the ZIP; 40 comparable units currently listed for rent nearby; rentals leasing fast (median 1d on market — plan ~1-2 weeks tenant-placement turnaround); 36,011 units permitted in Maricopa County in 2024 (12,801 in 5+ unit buildings).
Forward outlook
- Local home prices are declining (-3.0%/yr); year-one equity from $311 of loan paydown is wiped out by about $1k of value loss. Plan a longer hold.
- Maricopa County population projected at +38% by 2050 — long-run rental-demand tailwind backs the buy-and-hold thesis.
- At projected returns (-3.0% appreciation + 0.0% rent growth), your $13k cash investment doubles in ~3 years — after that, you're playing with house money.
Negotiation context
- It's been on market 64 days — a 6% lower offer ($42k) is reasonable based on typical stale-listing flexibility.
Risks & watch-outs
- Climate carrying-cost: extreme-heat days projected 7→17/yr by 2055 (HVAC capex compounding) — expect insurance premiums to compound above CPI over the hold.
Questions for the listing agent
- It's been on market 64 days. Have you received any prior offers? Is the seller open to a 6% concession, seller financing, or rate buy-down credit?
- Have any recent inspections been done? Can we get a copy of the seller's disclosures and any deferred-maintenance estimates?
- Built in 1978 — when were the roof, HVAC, electrical panel, plumbing, and water heater last replaced?
- Why hasn't it sold? Are there any deal-killer items the seller is aware of (foundation, flood, title, zoning, code violations)?
- Is there a deadline driving the sale (1031 exchange, divorce, estate, relocation)? That informs how much negotiation room exists.
- Crime grade is F in this area — have there been break-ins, vandalism, or insurance claims at this property in the last 3 years? What carrier currently insures it and at what premium?
- What's the average days-on-market for RENTAL listings here right now (not sales)? A rising rental-DOM trend means longer vacancies and softer asking-rent achievability than the comps imply.
- What's the recent tenant-quality profile in this submarket — average credit score on applications, eviction rate, late-payment / NSF rate, and stable-employment percentage? A property-management company in the area should have these aggregated.
- How much new for-sale + rental construction is in the pipeline within 1–3 miles? Heavy new supply typically softens prices + rents 12–24 months out; constrained supply supports both.
Investment metrics
- 1% rule
- 2.57% ✓
- Cap rate
- 22.37%
- Cash-on-cash
- 57.41%
- DSCR
- 3.55
- GRM
- 3.2
CMA / ARV
No comps found within radius.
Projected returns pro-forma
-3.0% appreciation · 0.0% rent growth · sell at horizon
- IRR
- 52.5%
- Equity multiple
- 3.20×
- Total profit
- $27,731
- Equity at exit
- $6,710
- IRR
- 56.6%
- Equity multiple
- 5.81×
- Total profit
- $60,557
- Equity at exit
- $3,891
Cash invested: $12,600 (down + closing). Projections, not guarantees.
Landlord ↔ Tenant lean methodology
- Overall (STATE)
- 87 Strongly Landlord-Friendly
- State Arizona
- 87 Strongly Landlord-Friendly · R+3
- County
- — inherits STATE
- City
- — inherits STATE
ZIP-level market 85051
- Home prices YoY
- -22.4%
- Rents YoY
- -3.0%
- Active inventory
- 117
- Price-to-rent
- 3.2×
Monthly cashflow live
- Estimated rent
- $1,157 high interval (Pro) →
- Mortgage (P&I)
- −$236
- Tax est. 1.5%
- −$56 /mo · $675/yr
- Insurance
- −$19
- HOA
- −$0
- Vacancy / Maint / Mgmt
- −$243
- Net cashflow
- $603
Break-even live
UW: 25.0% down · 7.5% · 30yr · 1.5% tax · 5.0% vac · 8.0% maint · 8.0% mgmt
Financing live
Cash to close
- Down payment
- $11,250
- Closing costs
- $1,350
- Reserves months
- —
- Total cash needed
- —
Loan-product check · same deal, 3 products live
Conventional
25% down · 7.5% · 30yr
- Down + closing
- —
- Monthly P&I
- —
- Monthly cashflow
- —
- DSCR
- —
- Eligible?
- —
Personal DTI + credit; lowest rate.
DSCR
20% down · 8.5% · 30yr
- Down + closing
- —
- Monthly P&I
- —
- Monthly cashflow
- —
- DSCR
- —
- Eligible?
- —
No personal income docs; deal must DSCR.
Hard money
10% down · 12.0% · 12mo
- Down + closing
- —
- Monthly P&I
- —
- Monthly cashflow
- —
- DSCR
- —
- Eligible?
- —
Short-term bridge; refi at stabilization.
Rent comps 40 comps
| Address | Beds | Baths | Sqft | Rent | $/sqft | DOM | Units | Dist |
|---|---|---|---|---|---|---|---|---|
| 6711 N 35th Ave Phoenix, AZ | 2.0 | 1.0 | 824 | $1,300 | $1.58 | 23d | 1 | 0.43mi |
| 7101 N 36th Ave #128 Phoenix, AZ | 2.0 | 1.5 | 960 | $1,095 | $1.14 | 2d | 1 | 0.51mi |
| 7101 N 36th Ave Phoenix, AZ | 2.0–3.0 | 1.5–2.0 | 992 | $995 | $1.00 | 3d | 2 | 0.51mi |
| 7101 N 36th Ave Phoenix, AZ | 2.0–3.0 | 1.5–2.0 | 992 | $995 | $1.00 | 1d | 2 | 0.51mi |
| 7232 N 27th Ave Unit 139a Phoenix, AZ | 2.0 | 1.0 | 825 | $1,095 | $1.33 | 17d | 1 | 0.55mi |
| 6816 N 35th Ave Unit F Phoenix, AZ | 2.0 | 2.0 | 998 | $1,499 | $1.50 | 24d | 1 | 0.56mi |
| 7232 N 27th Ave Apt 222 Phoenix, AZ | 1.0 | 1.0 | 675 | $895 | $1.33 | 17d | 1 | 0.57mi |
| 7150 N 27th Ave Phoenix, AZ | 1.0 | 1.0 | 550 | $750 | $1.36 | 1d | 1 | 0.57mi |
| 7232 N 27th Ave Phoenix, AZ | 1.0 | 1.0 | 675 | $1,095 | $1.62 | 17d | 1 | 0.58mi |
| 7232 N 27th Ave Phoenix, AZ | 1.0–2.0 | 1.0 | 750 | $1,200 | $1.60 | 1d | 5 | 0.58mi |
| 7328 N 27th Ave Apt 240 Phoenix, AZ | 1.0 | 1.0 | 529 | $1,100 | $2.08 | 21d | 1 | 0.59mi |
| 7328 N 27th Ave Unit 134 W/D Phoenix, AZ | 2.0 | 1.0 | 800 | $1,200 | $1.50 | 1d | 1 | 0.60mi |
| 7328 N 27th Ave Unit 233 W/D Phoenix, AZ | 1.0 | 1.0 | 529 | $1,100 | $2.08 | 1d | 1 | 0.61mi |
| 7328 N 27th Ave Apt 232 Phoenix, AZ | 1.0 | 1.0 | 529 | $1,100 | $2.08 | 19d | 1 | 0.61mi |
| 7328 N 27th Ave Apt 227 Phoenix, AZ | 2.0 | 1.0 | 800 | $1,200 | $1.50 | 17d | 1 | 0.62mi |
| 7328 N 27th Ave Unit 217 W/D Phoenix, AZ | 1.0 | 1.0 | 529 | $800 | $1.51 | 1d | 1 | 0.65mi |
| 6819 N 27th Ave Phoenix, AZ | 1.0 | 1.0 | 600 | $974 | $1.62 | 1d | 5 | 0.65mi |
| 6805 N 27th Ave Unit 206 Phoenix, AZ | 2.0 | 1.0 | 640 | $1,143 | $1.79 | 1d | 1 | 0.67mi |
| 6805 N 27th Ave Unit 321 Phoenix, AZ | 2.0 | 1.0 | 640 | $995 | $1.55 | 1d | 1 | 0.67mi |
| 6627 N 27th Ave Phoenix, AZ | 2.0 | 1.5 | 968 | $1,495 | $1.54 | 1d | 1 | 0.72mi |
| 2608 W Ocotillo Rd Unit A Phoenix, AZ | 2.0 | 1.0 | 850 | $1,600 | $1.88 | 1d | 1 | 0.76mi |
| 2609 W Ocotillo Rd #4 Phoenix, AZ | 2.0 | 1.5 | 968 | $1,299 | $1.34 | 2d | 1 | 0.80mi |
| 6230 N 33rd Ave #102 Phoenix, AZ | 2.0 | 2.0 | 975 | $1,495 | $1.53 | 13d | 1 | 0.80mi |
| 2645 W Morten Ave Unit 2 Phoenix, AZ | 1.0 | 1.0 | 531 | $899 | $1.69 | 1d | 1 | 0.82mi |
| 6801 N 25th Dr Phoenix, AZ | 1.0–2.0 | 1.0 | 750 | $1,199 | $1.60 | 1d | 1 | 0.83mi |
| 6721 N 25th Dr Phoenix, AZ | 2.0 | 1.0 | 750 | $950 | $1.27 | 1d | 1 | 0.85mi |
| 2512 W Ocotillo Rd Phoenix, AZ | 2.0 | 1.0 | 750 | $899 | $1.20 | 4d | 1 | 0.86mi |
| 2520 W McLellan Blvd Phoenix, AZ | 2.0–3.0 | 1.0 | 800 | $849 | $1.06 | 1d | 6 | 0.86mi |
| 2502 W Ocotillo Rd Phoenix, AZ | 1.0–2.0 | 1.0 | 650 | $1,499 | $2.31 | 1d | 2 | 0.87mi |
| 3031 W Northern Ave Phoenix, AZ | 2.0 | 1.0–2.0 | 828 | $1,612 | $1.95 | 1d | 4 | 0.87mi |
| 2609 W Morten Ave #1 Phoenix, AZ | 1.0 | 1.0 | 850 | $950 | $1.12 | 4d | 1 | 0.87mi |
| 2501 W Ocotillo Rd Phoenix, AZ | 1.0–2.0 | 1.0 | 740 | $845 | $1.14 | 1d | 4 | 0.90mi |
| 2540 W Maryland Ave Phoenix, AZ | 1.0–2.0 | 1.0 | 725 | $1,449 | $2.00 | 1d | 2 | 0.93mi |
| 3302 W Northern Ave Unit 2 Phoenix, AZ | 3.0 | 1.0 | 914 | $1,195 | $1.31 | 1d | 1 | 0.95mi |
| 3301 W Loma Ln Unit 4 Phoenix, AZ | 2.0 | 1.0 | 810 | $1,345 | $1.66 | 1d | 1 | 0.97mi |
| 6241 N 27th Ave Apt 318 Phoenix, AZ | 1.0 | 1.0 | 656 | $899 | $1.37 | 1d | 1 | 0.97mi |
| 3315 W Loma Ln Unit 4 Phoenix, AZ | 2.0 | 1.0 | 800 | $895 | $1.12 | 1d | 1 | 0.98mi |
| 3321 W Loma Ln Phoenix, AZ | 2.0 | 1.0 | 800 | $1,095 | $1.37 | 1d | 1 | 0.99mi |
| 6241 N 27th Ave Unit 228 Phoenix, AZ | 2.0 | 2.0 | 856 | $1,199 | $1.40 | 1d | 1 | 1.00mi |
| 6241 N 27th Ave Unit 327 Phoenix, AZ | 2.0 | 2.0 | 856 | $1,199 | $1.40 | 17d | 1 | 1.00mi |
Listing history 15 events
-
2026-06-18days on market $45,000 Active 64 DOM
-
2026-06-17days on market $45,000 Active 63 DOM
-
2026-06-16days on market $45,000 Active 62 DOM
-
2026-06-15days on market $45,000 Active 61 DOM
-
2026-06-13days on market $45,000 Active 59 DOM
-
2026-06-09days on market $45,000 Active 55 DOM
-
2026-06-08days on market $45,000 Active 54 DOM
-
2026-06-07days on market $45,000 Active 53 DOM
-
2026-06-04days on market $45,000 Active 50 DOM
-
2026-06-03days on market $45,000 Active 49 DOM
-
2026-06-02days on market $45,000 Active 48 DOM
-
2026-06-01days on market $45,000 Active 47 DOM
-
2026-05-31days on market $45,000 Active 46 DOM
-
2026-05-12price $45,000
-
2026-04-14$50,000 Active
ⓘ Source: listings_history table (triggers on properties + properties_extension) + one-shot
backfill from property_details.listing_events for pre-trigger history.
Climate risk First Street
- Flood 1/10 Low FEMA zone X (shaded) · 0% chance over 30 yrs
- Wildfire 1/10 Low
- Heat 9/10 Extreme 7 d/yr ≥112°F today · 17 d/yr by 30 yrs out
- Wind 1/10 Low
- Air quality 3/10 Moderate 3 unhealthy d/yr today · 3 by 30 yrs out
Nearby sold comps map
Loading sold comps map…
Walkable amenities ~0.75 mi
Loading nearby amenities…
Taxation est. · year 1
- Rental income
- $13,881
- − Mortgage interest
- −$2,521
- − Property taxes
- −$675
- − Insurance
- −$225
- − Repairs & maintenance
- −$1,110
- − Management
- −$1,110
- − Depreciation
- −$1,309
- Taxable income
- $6,930
- Est. tax owed @ 24.0%
- −$1,663
- After-tax cash flow
- $5,571/yr
For passive investors: Depreciation is non-cash, so a rental often shows a tax loss while cash-flowing — sheltering income. Rental losses are passive: they offset passive income freely, and up to $25,000/yr can offset ordinary (W-2) income if you actively participate and your MAGI is under $100k (phasing out to $0 by $150k); unused losses carry forward. On sale, claimed depreciation is recaptured at up to 25%, and gains may owe capital-gains tax (a 1031 exchange can defer both). Figures are a year-1 estimate at your 24.0% rate — not tax advice; consult a CPA.
Condition & rehab AI · 12 photos
This manufactured home requires moderate repairs and maintenance to improve its condition and value. Repainting the exterior and replacing worn flooring and wallpaper would significantly enhance its curb appeal and interior aesthetics.
Repairs flagged
- Major Exterior siding — Peeling paint and exposed insulation
- Major Kitchen flooring — Worn vinyl flooring
- Major Living area flooring — Worn carpet
- Major Bathroom wallpaper — Worn wallpaper
Value-add opportunities
- Both Paint exterior siding — Enhances curb appeal and value
- Both Replace kitchen flooring — Improves functionality and aesthetics
- Both Replace living area carpet — Improves comfort and aesthetics
- Both Replace bathroom wallpaper — Enhances aesthetics and value
Renovation cost estimate screening
| Repair item | Severity | Est. cost |
|---|---|---|
| Exterior siding · Peeling paint and exposed insulation | Major | $15,000–50,000 |
| Kitchen flooring · Worn vinyl flooring | Major | $15,000–50,000 |
| Living area flooring · Worn carpet | Major | $15,000–50,000 |
| Bathroom wallpaper · Worn wallpaper | Major | $15,000–50,000 |
| Total estimated repair cost · 4 items | $60,000–200,000 |
Value-add ROI direction
- Both Paint exterior siding — Enhances curb appeal and value ↑
- Both Replace kitchen flooring — Improves functionality and aesthetics ↑
- Both Replace living area carpet — Improves comfort and aesthetics ↑
- Both Replace bathroom wallpaper — Enhances aesthetics and value ↑
ⓘ Cost ranges are severity-bucket heuristics (US national rule-of-thumb). Get contractor quotes + a written scope before underwriting a rehab budget.
Schools (NCES district)
- District
- Glendale Union High School District (4285)
- NCES district ID
- 0403450
- Math proficiency
- 23% ▼ -38.00%
- Reading proficiency
- 31% ▼ -19.00%
- Median HH income
- $40,846
- Composite
- 22.81/100
- National rank
- #8020
- State rank
- #130 of 249 in AZ
Livability — Phoenix
- Score
- 75/100
- State rank
- #16
- US rank
- #3924
Category grades
Schools grade is shown separately in the Schools card above.
Census & demographics
- Census place
- Phoenix, AZ
- County
- Maricopa County · 4,537,380 people
- City population
- 1,500,198
- Metro
- Phoenix-Mesa-Chandler, AZ
- Population (ZIP)
- 45,768
- Household income
- $69,189
- Rent vs Own
- Severe rent burden
- 1546.0
Population outlook (Maricopa County) Hauer SSP2
- Today (2025)
- 4,979,203 people
- By 2030
- 5,378,229 · +8.0%
- By 2040
- 6,156,598 · +23.6%
- By 2050
- 6,872,376 · +38.0%
- By 2075
- 8,401,270 · +68.7%
- By 2100
- 9,247,439 · +85.7%
Race, ethnicity, and origin ACS 2023
- Neighborhood character
- Diverse neighborhood (Simpson 0.67)
- Race & ethnicity
- Hispanic / Latino 48% White 30% Two or more races 26% Black 8% Asian 5% Native American 4%
- Hispanic origin (detail)
- Mexican 42%
- Common ancestry
- Italian 2% Lithuanian 1% Slovak 1%
- Foreign-born
- 20% · Canada, Vietnam, Philippines
- Languages at home
- 57% English-only · Spanish 33% Other Asian/Pacific 3% Arabic 3%
Political lean MEDSL · Maricopa
- 2024 margin
- Toss-up / Even · D 47.7% · R 51.2% · Other 1.1%
- 2008→2024 swing
- +7.1pp toward D · 2008: -10.6pp · 2024: -3.5pp
- All cycles
- 2024: R+3.5 2020: D+2.2 2016: R+3.5 2012: R+12.0 2008: R+10.6
Not yet ingested
- Civics
- —
Market trends
- HPI YoY
- ▼ -113.72%
- Current HPI
- 393.886
- Rent YoY
- ▼ -3.04%
- Metro
- Phoenix-Mesa-Chandler, AZ
- State GDP YoY
- ▲ 4.54%
- F500 in state
- 20
Industry mix (Fortune 500 HQ in AZ)
| Industry | F500 HQs | Revenue |
|---|---|---|
| Technology | 2 | $13B |
|
||
| Mining / Metals | 1 | $23B |
|
||
| Environmental Services | 1 | $16B |
|
||
| Metals / Steel | 1 | $14B |
|
||
| Technology Distribution | 1 | $9B |
|
||
| Homebuilding | 1 | $8B |
|
||
Price history
-10.0% since first listed2 events — show timeline
- 2026-05-12 Price Changed $45,000 ARMLS
- 2026-04-14 Listed $50,000 ARMLS
Cash-flow waterfall
monthlySold comps — $/sqft
last 12 mo · ≤1 miLoading sold comps…