 🏷️ Likely Rental
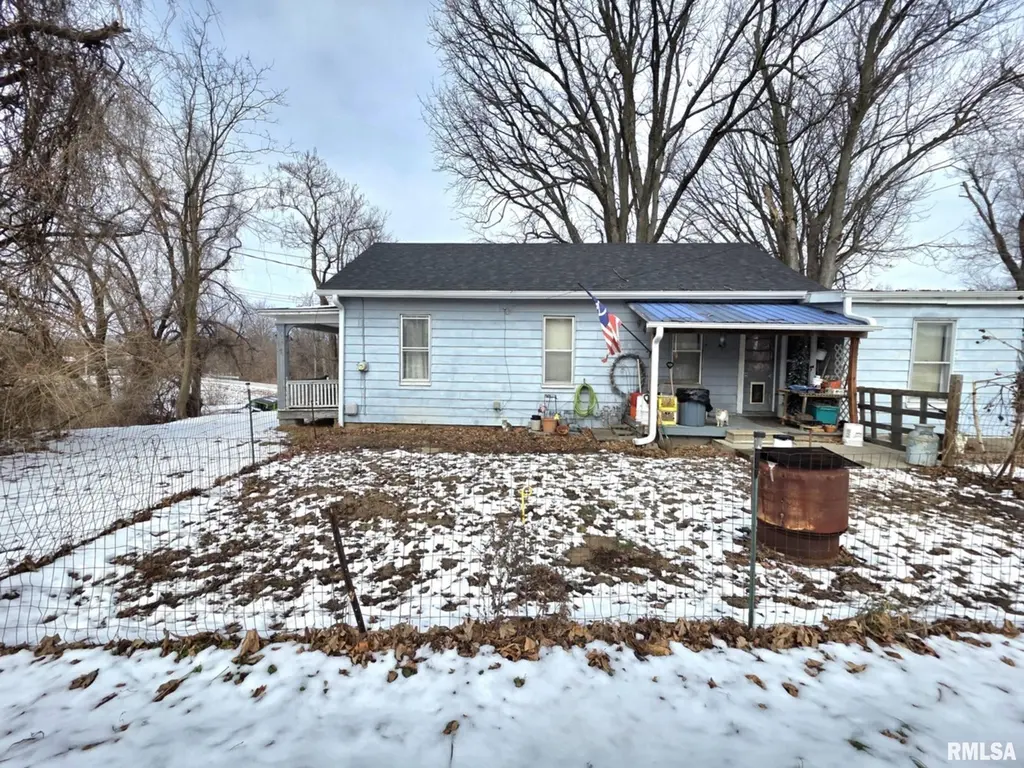
1610 N 4th St · Quincy, IL
Flood risk 1/10 · Minimal
- FEMA flood zone
- X (unshaded)
- Chance of flooding over 30 yrs
- 0.0%
- Est. flood insurance / yr
- $473 – $860
Fire risk 1/10 · Minimal
- Est. fire insurance / yr
- $804 – $1,492
Heat risk 3/10 · Minor
- Hot days now (above 107°F)
- 7 days/yr
- Hot days in 30 yrs
- 17 days/yr
Wind risk 2/10 · Minimal
- Chance of severe wind over 30 yrs
- —
Air-quality risk 2/10 · Minimal
- Unhealthy air days now
- 1 days/yr
- Unhealthy air days in 30 yrs
- 1 days/yr
Risk factors via First Street. Map © Google.
Why this score? — see what drove the B+ grade
The composite is a weighted blend of 9 inputs, each scored 0–100. Each bar is that input's sub-score; the figure is the points it added to the 100-point composite (weight × sub-score).
- Cash flow +30.0/30.0
- ARV discount +15.0/15.0
- 1% rule +10.0/10.0
- DSCR +10.0/10.0
- Rent growth +5.0/5.0
- Livability +3.4/5.0
- Condition / age +2.5/5.0
- Schools +2.2/10.0
- Appreciation +0.0/10.0
$57,000
🖨 Deal sheet 📄 Offer letter ✓ Due diligence
Listing remarks MLS
Investor Alert! Unique opportunity featuring a 24x50 garage—every hobbyist’s, race car driver and mechanics dream space! The property includes a small, efficient home that is currently tenant-occupied, with a long-term renter of 20 years who would love to stay. Ideal for investors seeking immediate rental income or buyers looking for a property with exceptional garage/workshop space. New tpo roof on both the garage and the house in 2025. Instant income possibilities or affordable living with a little sweat equity. More pictures available upon request.
Key facts
- New tpo roof
- 24x50 garage
- Efficient home
Tags
Neighborhood map
What this means for you Summary
Snapshot
- This is a 2-bed/1.0-bath single-family listed at $57k.
Deal economics
- At list price, monthly cash flow is $868 ($10k/yr) — positive.
- The deal already cash-flows at list — no discount required.
- Meets the 1% rule at list price ($2k rent vs $57k).
- Recommended offer: $50k (12.0% below list) — sets the bar for market timing.
- Cap rate 24.6% vs local median 4.3% in Quincy — top-decile yield for the area; either an underpriced asset or a hidden risk that comps aren't pricing in. Stress-test before assuming the spread holds.
Location & tenants
- Location reads 67/100 on livability (#506 in IL) — a middle-class / working-renter tenant base. Strengths: cost of living A+, housing A+; Watch: schools D+, crime D, employment D.
- Quincy SD 172 (town): math 24% / reading 27% proficiency, ranked #328 of 620 in IL (top 53%) — low school quality limits family demand, transient renter base, plan for 1-2y turnover.
- Market conditions: Rents rising fast (+10.8%/yr); 180 active listings in the ZIP; 4 comparable units currently listed for rent nearby; rentals lingering (median 44d on market — plan ~5-8 weeks vacancy on turnover, expect pricing pressure); 100% of comp listings sitting > 30 days — soft ceiling on asking rent; 68 units permitted in Adams County in 2024 (0 in 5+ unit buildings).
- This rent runs 36% of the median local income ($52k/yr) — at the standard rent-burdened threshold; future hikes will face affordability resistance.
Forward outlook
- Local home prices are declining (-3.0%/yr); year-one equity from $394 of loan paydown is wiped out by about $2k of value loss. Plan a longer hold.
- Adams County population projected at -14% by 2050 — secular population decline; favor cash flow + early exit over multi-decade hold.
- At projected returns (-3.0% appreciation + 8.0% rent growth), your $16k cash investment doubles in ~2 years — after that, you're playing with house money.
Negotiation context
- It's been on market 136 days — a 12% lower offer ($50k) is reasonable based on typical stale-listing flexibility.
- 3 sale attempts since 2y ago with the ask held roughly flat each time — persistent listings suggest the price (not the market) is what's stuck; bring a comps-based counter.
- Current owner paid $29k; list at $57k implies a 97% gain — meaningful room to come down on a strong offer.
Questions for the listing agent
- It's been on market 136 days. Have you received any prior offers? Is the seller open to a 12% concession, seller financing, or rate buy-down credit?
- Why hasn't it sold? Are there any deal-killer items the seller is aware of (foundation, flood, title, zoning, code violations)?
- Is there a deadline driving the sale (1031 exchange, divorce, estate, relocation)? That informs how much negotiation room exists.
- Schools are D-rated, which usually means shorter tenancies and higher turnover. Who's the typical renter profile here, and what's been the actual vacancy rate?
- Crime grade is D in this area — have there been break-ins, vandalism, or insurance claims at this property in the last 3 years? What carrier currently insures it and at what premium?
- What's the average days-on-market for RENTAL listings here right now (not sales)? A rising rental-DOM trend means longer vacancies and softer asking-rent achievability than the comps imply.
- What's the recent tenant-quality profile in this submarket — average credit score on applications, eviction rate, late-payment / NSF rate, and stable-employment percentage? A property-management company in the area should have these aggregated.
- How much new for-sale + rental construction is in the pipeline within 1–3 miles? Heavy new supply typically softens prices + rents 12–24 months out; constrained supply supports both.
Investment metrics
- 1% rule
- 2.76% ✓
- Cap rate
- 24.56%
- Cash-on-cash
- 65.25%
- DSCR
- 3.90
- GRM
- 3.0
CMA / ARV
- ARV (median comp)
- $84,469
- List price
- $57,000
- Delta
- -32.52%
- Verdict
- UNDERPRICED
- Comps
- 20 within 1.0 mi
Show comp detail 7 sales within ~0.75 mi
| Address | Dist | Beds/Ba | Sqft | Sold | Price | $/sf | Match |
|---|---|---|---|---|---|---|---|
| 1418 N 6th | 0.25mi | 2/1.0 | 925 (+5%) | 9mo | $157,000 | $170 | 73 |
| 204 Locust St | 0.19mi | 2/1.0 | 768 (-13%) | 6mo | $13,000 | $17 | 65 |
| 1220 N 7th St | 0.43mi | 3/1.0 (+1) | 912 (+4%) | 16mo | $80,000 | $88 | 56 |
| 706 Cedar St | 0.49mi | 1/1.0 (-1) | 880 (0%) | 21mo | $18,500 | $21 | 55 |
| 917 Cherry St | 0.65mi | 2/1.0 | 850 (-3%) | 12mo | $102,000 | $120 | 54 |
| 304 Chestnut St | 0.58mi | 2/1.5 | 984 (+12%) | 6mo | $45,000 | $46 | 46 |
| 629 Cherry St | 0.52mi | 2/1.0 | 1,001 (+14%) | 10mo | $48,000 | $48 | 44 |
Match score weights: distance 35% · size 25% · config 20% · recency 20%. Top-matched comps best support the ARV.
Projected returns pro-forma
-3.0% appreciation · 8.0% rent growth · sell at horizon
- IRR
- 69.9%
- Equity multiple
- 4.41×
- Total profit
- $54,353
- Equity at exit
- $8,499
- IRR
- 75.5%
- Equity multiple
- 10.80×
- Total profit
- $156,351
- Equity at exit
- $4,928
Cash invested: $15,960 (down + closing). Projections, not guarantees.
Landlord ↔ Tenant lean methodology
- Overall (STATE)
- 43 Moderately Tenant-Leaning
- State Illinois
- 43 Moderately Tenant-Leaning · D+7
- County
- — inherits STATE
- City
- — inherits STATE
ZIP-level market 62301
- Rents YoY
- 10.8%
- Active inventory
- 180
- Price-to-rent
- 3.0×
Monthly cashflow live
- Estimated rent
- $1,572 medium interval (Pro) →
- Mortgage (P&I)
- −$299
- Tax from tax record
- −$51 /mo · $614/yr
- Insurance
- −$24
- HOA
- −$0
- Vacancy / Maint / Mgmt
- −$330
- Net cashflow
- $868
Break-even live
UW: 25.0% down · 7.5% · 30yr · 1.5% tax · 5.0% vac · 8.0% maint · 8.0% mgmt
Financing live
Cash to close
- Down payment
- $14,250
- Closing costs
- $1,710
- Reserves months
- —
- Total cash needed
- —
Loan-product check · same deal, 3 products live
Conventional
25% down · 7.5% · 30yr
- Down + closing
- —
- Monthly P&I
- —
- Monthly cashflow
- —
- DSCR
- —
- Eligible?
- —
Personal DTI + credit; lowest rate.
DSCR
20% down · 8.5% · 30yr
- Down + closing
- —
- Monthly P&I
- —
- Monthly cashflow
- —
- DSCR
- —
- Eligible?
- —
No personal income docs; deal must DSCR.
Hard money
10% down · 12.0% · 12mo
- Down + closing
- —
- Monthly P&I
- —
- Monthly cashflow
- —
- DSCR
- —
- Eligible?
- —
Short-term bridge; refi at stabilization.
Rent comps 4 comps
| Address | Beds | Baths | Sqft | Rent | $/sqft | DOM | Units | Dist |
|---|---|---|---|---|---|---|---|---|
| 116 N 3rd St Quincy, IL | 1.0–4.0 | 1.0–2.0 | 1950 | $3,067 | $1.57 | 43d | 12 | 1.28mi |
| 115 N 8th St Unit 1/2-5 Quincy, IL | 2.0 | 1.0 | 750 | $475 | $0.63 | 43d | 1 | 1.33mi |
| 500 Maine St Quincy, IL | 1.0 | 1.0 | 937 | $700 | $0.75 | 43d | 1 | 1.35mi |
| 133 S 4th St Apt 206 Quincy, IL | 2.0 | 1.0 | 620 | $1,450 | $2.34 | 43d | 1 | 1.39mi |
Listing history 22 events
-
2026-06-19days on market $57,000 Active 136 DOM
-
2026-06-18days on market $57,000 Active 135 DOM
-
2026-06-17days on market $57,000 Active 134 DOM
-
2026-06-16days on market $57,000 Active 133 DOM
-
2026-06-15days on market $57,000 Active 132 DOM
-
2026-06-14days on market $57,000 Active 130 DOM
-
2026-06-12days on market $57,000 Active 129 DOM
-
2026-06-09days on market $57,000 Active 126 DOM
-
2026-06-08days on market $57,000 Active 125 DOM
-
2026-06-07days on market $57,000 Active 124 DOM
-
2026-06-03days on market $57,000 Active 120 DOM
-
2026-06-02days on market $57,000 Active 119 DOM
-
2026-06-01days on market $57,000 Active 118 DOM
-
2026-05-31days on market $57,000 Active 117 DOM
-
2026-05-30days on market $57,000 Active 116 DOM
-
2026-02-03$57,000 Active 569-char remark
Show marketing remark (569 chars)
Investor Alert! Unique opportunity featuring a 24x50 garage—every hobbyist’s, race car driver and mechanics dream space! The property includes a small, efficient home that is currently tenant-occupied, with a long-term renter of 20 years who would love to stay. Ideal for investors seeking immediate rental income or buyers looking for a property with exceptional garage/workshop space. New tpo roof on both the garage and the house in 2025. Instant income possibilities or affordable living with a little sweat equity. More pictures available upon request.
-
2024-12-13soldstatus $29,000 Closed 279-char remark
Show marketing remark (279 chars)
Home is currently rented - Long Term Tenant. Home appears to need a new roof, but tenant says it is not currently leaking. A little TLC can make this the perfect home. Huge 24x50 Detached Garage. Storage Shed to convey. Selling "AS IS" All measurements are approximate.
-
2024-12-13soldstatus $29,000 Closed
Show marketing remark (279 chars)
Home is currently rented - Long Term Tenant. Home appears to need a new roof, but tenant says it is not currently leaking. A little TLC can make this the perfect home. Huge 24x50 Detached Garage. Storage Shed to convey. Selling "AS IS" All measurements are approximate.
-
2024-11-26historical Active Under Contract
-
2024-11-25historical 279-char remark
Show marketing remark (279 chars)
Home is currently rented - Long Term Tenant. Home appears to need a new roof, but tenant says it is not currently leaking. A little TLC can make this the perfect home. Huge 24x50 Detached Garage. Storage Shed to convey. Selling "AS IS" All measurements are approximate.
-
2024-11-18$45,000 279-char remark
Show marketing remark (279 chars)
Home is currently rented - Long Term Tenant. Home appears to need a new roof, but tenant says it is not currently leaking. A little TLC can make this the perfect home. Huge 24x50 Detached Garage. Storage Shed to convey. Selling "AS IS" All measurements are approximate.
-
2024-11-18$45,000 Active
Show marketing remark (279 chars)
Home is currently rented - Long Term Tenant. Home appears to need a new roof, but tenant says it is not currently leaking. A little TLC can make this the perfect home. Huge 24x50 Detached Garage. Storage Shed to convey. Selling "AS IS" All measurements are approximate.
ⓘ Source: listings_history table (triggers on properties + properties_extension) + one-shot
backfill from property_details.listing_events for pre-trigger history.
Tax reassessment forecast IL · Partial reset (capped growth)
- Current annual tax
- $614 · $51/mo
- Projected year-2 tax
- $954 · $79/mo
- Expected delta
- +$340/yr (+$28/mo · 55.4%)
ⓘ Screening estimate from a state-policy table — verify with the county assessor before closing.
Climate risk First Street
- Flood 1/10 Low FEMA zone X (unshaded) · 0% chance over 30 yrs
- Wildfire 1/10 Low
- Heat 3/10 Moderate 7 d/yr ≥107°F today · 17 d/yr by 30 yrs out
- Wind 2/10 Low
- Air quality 2/10 Low 1 unhealthy d/yr today · 1 by 30 yrs out
Nearby sold comps map
Loading sold comps map…
Walkable amenities ~0.75 mi
Loading nearby amenities…
Taxation est. · year 1
- Rental income
- $18,860
- − Mortgage interest
- −$3,193
- − Property taxes
- −$614
- − Insurance
- −$285
- − Repairs & maintenance
- −$1,509
- − Management
- −$1,509
- − Depreciation
- −$1,658
- Taxable income
- $10,093
- Est. tax owed @ 24.0%
- −$2,422
- After-tax cash flow
- $7,992/yr
For passive investors: Depreciation is non-cash, so a rental often shows a tax loss while cash-flowing — sheltering income. Rental losses are passive: they offset passive income freely, and up to $25,000/yr can offset ordinary (W-2) income if you actively participate and your MAGI is under $100k (phasing out to $0 by $150k); unused losses carry forward. On sale, claimed depreciation is recaptured at up to 25%, and gains may owe capital-gains tax (a 1031 exchange can defer both). Figures are a year-1 estimate at your 24.0% rate — not tax advice; consult a CPA.
Schools (NCES district)
- District
- Quincy SD 172
- NCES district ID
- 1733000
- Math proficiency
- 24% ▬ 0.00%
- Reading proficiency
- 27% ▬ 0.00%
- Median HH income
- $44,132
- Composite
- 21.91/100
- National rank
- #8229
- State rank
- #328 of 620 in IL
Livability — Quincy
- Score
- 67/100
- State rank
- #506
- US rank
- #10458
Category grades
Schools grade is shown separately in the Schools card above.
Census & demographics
- Census place
- Quincy, IL
- County
- Adams County · 30,746 people
- City population
- 30,746
- Metro
- Quincy, IL-MO
- Population (ZIP)
- 30,746
- Household income
- $52,055
- Rent vs Own
- Severe rent burden
- 1238.0
Population outlook (Adams County) Hauer SSP2
- Today (2025)
- 65,795 people
- By 2030
- 64,436 · -2.1%
- By 2040
- 61,007 · -7.3%
- By 2050
- 56,851 · -13.6%
- By 2075
- 46,424 · -29.4%
- By 2100
- 34,305 · -47.9%
Race, ethnicity, and origin ACS 2023
- Neighborhood character
- Predominantly White (84%)
- Race & ethnicity
- White 84% Two or more races 7% Black 6% Hispanic / Latino 3% Asian 1%
- Common ancestry
- Slovak 2% Iranian 1% Lithuanian 1%
- Foreign-born
- 2% · Canada
- Languages at home
- 96% English-only · Spanish 2%
Political lean MEDSL · Adams
- 2024 margin
- Solid R (+47.4) · D 25.6% · R 73.0% · Other 1.5%
- 2008→2024 swing
- -25.0pp toward R · 2008: -22.4pp · 2024: -47.4pp
- All cycles
- 2024: R+47.4 2020: R+46.5 2016: R+47.5 2012: R+35.2 2008: R+22.4
Not yet ingested
- Civics
- —
Market trends
- HPI YoY
- ▼ -121.44%
- Current HPI
- 131.7344
- Rent YoY
- ▲ 10.78%
- Metro
- Quincy, IL-MO
- State GDP YoY
- ▲ 1.59%
- F500 in state
- 60
Industry mix (Fortune 500 HQ in IL)
| Industry | F500 HQs | Revenue |
|---|---|---|
| Insurance | 4 | $201B |
|
||
| Consumer Goods | 4 | $87B |
|
||
| Industrial Machinery | 3 | $64B |
|
||
| Healthcare | 2 | $55B |
|
||
| Retail / Pharmacy | 1 | $148B |
|
||
| Agriculture / Food | 1 | $86B |
|
||
Price history
+26.7% since first listed7 events — show timeline
- 2026-02-03 Listed $57,000 RMLSA as Distributed by MLS Grid
- 2024-12-13 Sold (MLS) $29,000 Quincy AOR
- 2024-12-13 Sold (MLS) $29,000 MRED as Distributed by MLS Grid
- 2024-11-26 Contingent — Quincy AOR
- 2024-11-25 Listing Removed — MRED as Distributed by MLS Grid
- 2024-11-18 Listed $45,000 Quincy AOR
- 2024-11-18 Listed $45,000 MRED as Distributed by MLS Grid
Property tax history
+2.0%/yrLatest (2023): $614 · +5.7% YoY. Source: county tax records.
Cash-flow waterfall
monthlySold comps — $/sqft
last 12 mo · ≤1 miLoading sold comps…