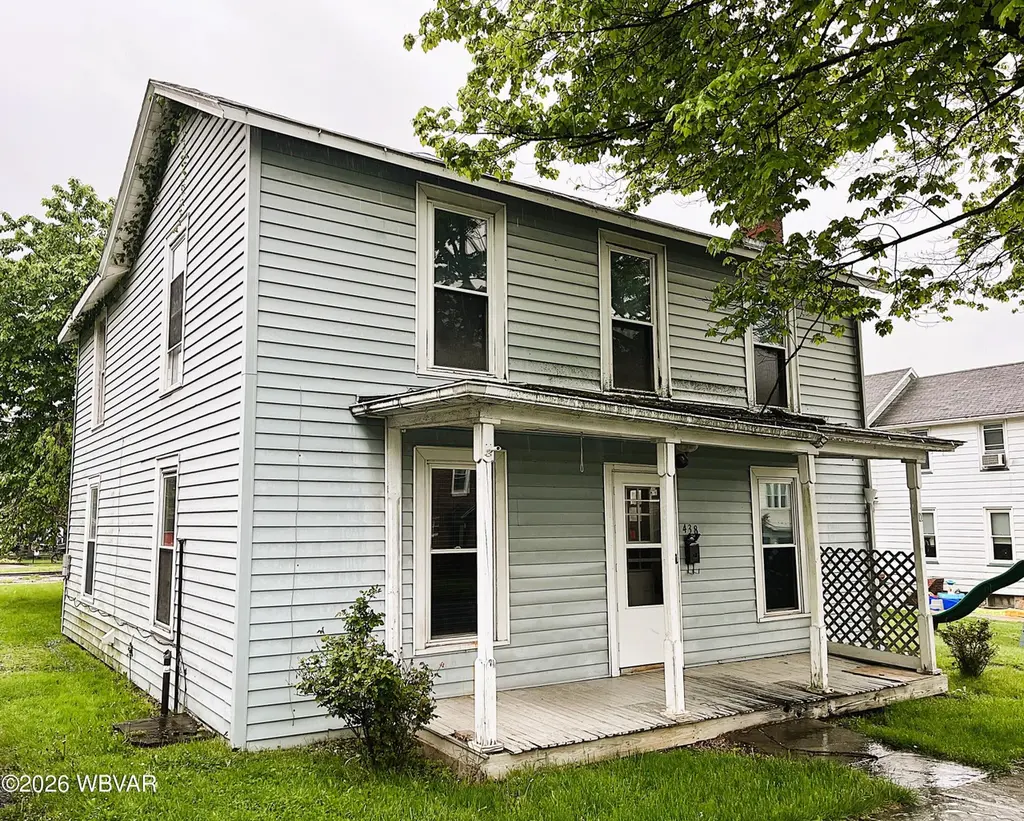
438 S Highland St · Lock Haven, PA
Flood risk 1/10 · Minimal
- FEMA flood zone
- X (unshaded)
- Chance of flooding over 30 yrs
- 0.0%
- Est. flood insurance / yr
- $473 – $860
Fire risk 1/10 · Minimal
- Est. fire insurance / yr
- $511 – $949
Heat risk 4/10 · Minor
- Hot days now (above 95°F)
- 7 days/yr
- Hot days in 30 yrs
- 17 days/yr
Wind risk 2/10 · Minimal
- Chance of severe wind over 30 yrs
- —
Air-quality risk 1/10 · Minimal
- Unhealthy air days now
- 0 days/yr
- Unhealthy air days in 30 yrs
- 0 days/yr
Risk factors via First Street. Map © Google.
Why this score? — see what drove the B grade
The composite is a weighted blend of 9 inputs, each scored 0–100. Each bar is that input's sub-score; the figure is the points it added to the 100-point composite (weight × sub-score).
- Cash flow +30.0/30.0
- 1% rule +10.0/10.0
- DSCR +10.0/10.0
- ARV discount +7.5/15.0
- Rent growth +4.3/5.0
- Livability +3.9/5.0
- Schools +3.2/10.0
- Condition / age +2.5/5.0
- Appreciation +0.0/10.0
$75,000
🖨 Deal sheet 📄 Offer letter ✓ Due diligence
Listing remarks MLS
AS-IS. BUYER TO PAY ALL TRANSFER TAX.
Key facts
- 6,098 sq ft lot
- Built 1910
- Listed 43 days
Property features AI
Exterior
- Parking: No formal parking; gravel area
- Utilities: Public water
- Home design: Residential property; Frame construction with vinyl siding
- Construction: Shingle roof; Stone foundation
- Exterior features: Front porch; Level lot
Interior
- Flooring: Wood; Linoleum; Carpet
- Bathrooms: 1 full bathroom
- Heating & cooling: Oil-fired hot water heating; No cooling
- Interior features: Wood, linoleum, and carpet flooring; Partial basement
- Laundry & utility: Laundry on the main level
Neighborhood map
What this means for you Summary
Snapshot
- This is a 3-bed/1.0-bath single-family listed at $75k.
Deal economics
- At list price, monthly cash flow is $296 ($4k/yr) — positive.
- The deal already cash-flows at list — no discount required.
- Meets the 1% rule at list price ($1k rent vs $75k).
- Recommended offer: $73k (3.0% below list) — sets the bar for market timing.
- Cap rate 11.0% vs local median 3.8% in Lock Haven — top-decile yield for the area; either an underpriced asset or a hidden risk that comps aren't pricing in. Stress-test before assuming the spread holds.
Location & tenants
- Location reads 78/100 on livability (#275 in PA, #2,428 nationally) — a middle-class / working-renter tenant base. Strengths: amenities A+, cost of living A+, housing A+; Watch: schools C-, employment F.
- Keystone Central SD (town): math 32% / reading 44% proficiency, ranked #384 of 539 in PA (top 71%) — families likely to look elsewhere, expect single-tenant / working-renter base with shorter leases.
- Market conditions: Rents rising fast (+7.4%/yr); 96 active listings in the ZIP; 1 comparable units currently listed for rent nearby; 44 units permitted in Clinton County in 2024 (0 in 5+ unit buildings).
Forward outlook
- Local home prices are declining (-3.0%/yr); year-one equity from $519 of loan paydown is wiped out by about $2k of value loss. Plan a longer hold.
- Clinton County population projected to shrink 5% by 2050 — rents likely to lag national; underwrite the cash flow, not the appreciation.
- At projected returns (-3.0% appreciation + 7.4% rent growth), your $21k cash investment doubles in ~6 years — after that, you're playing with house money.
Negotiation context
- It's been on market 43 days — a 3% lower offer ($73k) is reasonable based on typical stale-listing flexibility.
- 2 sale attempts since 20y ago; this cycle's ask has dropped $20k (21%) from the opening price — seller is motivated, your offer sets the floor, not the list.
Risks & watch-outs
- Watch-outs: property tax is 4.2% of price; built in 1910 — expect roof / HVAC / electrical / plumbing capex.
Questions for the listing agent
- It's been on market 43 days. Have you received any prior offers? Is the seller open to a 3% concession, seller financing, or rate buy-down credit?
- Built in 1910 — when were the roof, HVAC, electrical panel, plumbing, and water heater last replaced?
- Property tax is high relative to price — has the assessment been appealed recently, and will the sale trigger a re-assessment?
- Is there a deadline driving the sale (1031 exchange, divorce, estate, relocation)? That informs how much negotiation room exists.
- What's the average days-on-market for RENTAL listings here right now (not sales)? A rising rental-DOM trend means longer vacancies and softer asking-rent achievability than the comps imply.
- What's the recent tenant-quality profile in this submarket — average credit score on applications, eviction rate, late-payment / NSF rate, and stable-employment percentage? A property-management company in the area should have these aggregated.
- How much new for-sale + rental construction is in the pipeline within 1–3 miles? Heavy new supply typically softens prices + rents 12–24 months out; constrained supply supports both.
Investment metrics
- 1% rule
- 1.66% ✓
- Cap rate
- 11.03%
- Cash-on-cash
- 16.91%
- DSCR
- 1.75
- GRM
- 5.0
CMA / ARV
- ARV (median comp)
- $158,373
- List price
- $75,000
- Delta
- -52.64%
- Verdict
- UNDERPRICED
- Comps
- 20 within 1.0 mi
Show comp detail 12 sales within ~0.75 mi
| Address | Dist | Beds/Ba | Sqft | Sold | Price | $/sf | Match |
|---|---|---|---|---|---|---|---|
| 222 Green St | 0.22mi | 3/2.0 | 1,556 (-2%) | 3mo | $195,000 | $125 | 81 |
| 432 S Jones St | 0.18mi | 3/1.5 | 1,613 (+2%) | 12mo | $213,900 | $133 | 77 |
| 329 W Clinton St | 0.31mi | 3/1.0 | 1,496 (-5%) | 6mo | $95,000 | $64 | 72 |
| 205 Rose St | 0.39mi | 3/3.0 | 1,633 (+3%) | 3mo | $225,000 | $138 | 66 |
| 306 First Ave | 0.27mi | 3/2.0 | 1,736 (+10%) | 8mo | $219,000 | $126 | 60 |
| 116 Irwin St | 0.65mi | 3/1.0 | 1,505 (-5%) | 2mo | $222,000 | $148 | 60 |
| 101 Pearl St | 0.34mi | 3/1.5 | 1,788 (+13%) | 3mo | $170,000 | $95 | 58 |
| 32 N Jones St | 0.47mi | 4/1.5 (+1) | 1,682 (+6%) | 3mo | $63,000 | $37 | 58 |
| 511 Woods Ave | 0.67mi | 3/1.5 | 1,616 (+2%) | 7mo | $175,000 | $108 | 58 |
| 468 W 4th St | 0.59mi | 4/2.0 (+1) | 1,615 (+2%) | 5mo | $215,000 | $133 | 56 |
| 660 Bellefonte Ave | 0.37mi | 2/1.0 (-1) | 1,736 (+10%) | 9mo | $202,500 | $117 | 54 |
| 415 Wright St | 0.73mi | 3/1.5 | 1,350 (-15%) | 9mo | $139,500 | $103 | 32 |
Match score weights: distance 35% · size 25% · config 20% · recency 20%. Top-matched comps best support the ARV.
Projected returns pro-forma
-3.0% appreciation · 7.38% rent growth · sell at horizon
- IRR
- 14.0%
- Equity multiple
- 1.60×
- Total profit
- $12,531
- Equity at exit
- $11,183
- IRR
- 26.5%
- Equity multiple
- 3.92×
- Total profit
- $61,342
- Equity at exit
- $6,485
Cash invested: $21,000 (down + closing). Projections, not guarantees.
Landlord ↔ Tenant lean methodology
- Overall (STATE)
- 62 Landlord-Friendly
- State Pennsylvania
- 62 Landlord-Friendly · EVEN
- County
- — inherits STATE
- City
- — inherits STATE
ZIP-level market 17745
- Home prices YoY
- -7.3%
- Rents YoY
- 7.4%
- Active inventory
- 96
- Price-to-rent
- 5.0×
Monthly cashflow live
- Estimated rent
- $1,242 medium interval (Pro) →
- Mortgage (P&I)
- −$393
- Tax from tax record
- −$260 /mo · $3,125/yr
- Insurance
- −$31
- HOA
- −$0
- Vacancy / Maint / Mgmt
- −$261
- Net cashflow
- $296
Break-even live
UW: 25.0% down · 7.5% · 30yr · 1.5% tax · 5.0% vac · 8.0% maint · 8.0% mgmt
Financing live
Cash to close
- Down payment
- $18,750
- Closing costs
- $2,250
- Reserves months
- —
- Total cash needed
- —
Loan-product check · same deal, 3 products live
Conventional
25% down · 7.5% · 30yr
- Down + closing
- —
- Monthly P&I
- —
- Monthly cashflow
- —
- DSCR
- —
- Eligible?
- —
Personal DTI + credit; lowest rate.
DSCR
20% down · 8.5% · 30yr
- Down + closing
- —
- Monthly P&I
- —
- Monthly cashflow
- —
- DSCR
- —
- Eligible?
- —
No personal income docs; deal must DSCR.
Hard money
10% down · 12.0% · 12mo
- Down + closing
- —
- Monthly P&I
- —
- Monthly cashflow
- —
- DSCR
- —
- Eligible?
- —
Short-term bridge; refi at stabilization.
Rent comps 1 comps
| Address | Beds | Baths | Sqft | Rent | $/sqft | DOM | Units | Dist |
|---|---|---|---|---|---|---|---|---|
| 30 Clarks Barn Rd Unit A Lock Haven, PA | 3.0 | 1.0 | 1400 | $1,200 | $0.86 | 43d | 1 | 1.49mi |
Listing history 19 events
-
2026-06-17status $75,000 Pending 43 DOM
-
2026-06-17days on market $75,000 Active 43 DOM
-
2026-06-16days on market $75,000 Active 42 DOM
-
2026-06-15days on market $75,000 Active 41 DOM
-
2026-06-14days on market $75,000 Active 39 DOM
-
2026-06-12pricedays on market $75,000 Active 38 DOM
-
2026-06-09days on market $85,000 Active 35 DOM
-
2026-06-08days on market $85,000 Active 34 DOM
-
2026-06-07days on market $85,000 Active 33 DOM
-
2026-06-04days on market $85,000 Active 29 DOM
-
2026-06-02days on market $85,000 Active 28 DOM
-
2026-06-01days on market $85,000 Active 27 DOM
-
2026-05-31days on market $85,000 Active 26 DOM
-
2026-05-31days on market $85,000 Active 25 DOM
-
2026-05-04$95,000 Active 492-char remark
-
2007-02-02soldstatus $68,000
-
2007-01-31soldstatus $68,000 37-char remark
Show marketing remark (37 chars)
AS-IS. BUYER TO PAY ALL TRANSFER TAX.
-
2006-11-22$72,500 37-char remark
Show marketing remark (37 chars)
AS-IS. BUYER TO PAY ALL TRANSFER TAX.
-
1997-08-01soldstatus $59,500
ⓘ Source: listings_history table (triggers on properties + properties_extension) + one-shot
backfill from property_details.listing_events for pre-trigger history.
Tax reassessment forecast PA · Partial reset (capped growth)
- Current annual tax
- $3,125 · $260/mo
- Projected year-2 tax
- $3,125 · $260/mo
- Expected delta
- $0/yr ($0/mo · 0.0%)
ⓘ Screening estimate from a state-policy table — verify with the county assessor before closing.
Climate risk First Street
- Flood 1/10 Low FEMA zone X (unshaded) · 0% chance over 30 yrs
- Wildfire 1/10 Low
- Heat 4/10 Moderate 7 d/yr ≥95°F today · 17 d/yr by 30 yrs out
- Wind 2/10 Low
- Air quality 1/10 Low 0 unhealthy d/yr today · 0 by 30 yrs out
Nearby sold comps map
Loading sold comps map…
Walkable amenities ~0.75 mi
Loading nearby amenities…
Taxation est. · year 1
- Rental income
- $14,900
- − Mortgage interest
- −$4,201
- − Property taxes
- −$3,125
- − Insurance
- −$375
- − Repairs & maintenance
- −$1,192
- − Management
- −$1,192
- − Depreciation
- −$2,182
- Taxable income
- $2,633
- Est. tax owed @ 24.0%
- −$632
- After-tax cash flow
- $2,920/yr
For passive investors: Depreciation is non-cash, so a rental often shows a tax loss while cash-flowing — sheltering income. Rental losses are passive: they offset passive income freely, and up to $25,000/yr can offset ordinary (W-2) income if you actively participate and your MAGI is under $100k (phasing out to $0 by $150k); unused losses carry forward. On sale, claimed depreciation is recaptured at up to 25%, and gains may owe capital-gains tax (a 1031 exchange can defer both). Figures are a year-1 estimate at your 24.0% rate — not tax advice; consult a CPA.
Schools (NCES district)
- District
- Keystone Central SD
- NCES district ID
- 4212725
- Math proficiency
- 32% ▼ -6.00%
- Reading proficiency
- 44% ▼ -10.00%
- Median HH income
- $42,713
- Composite
- 32.09/100
- National rank
- #5810
- State rank
- #384 of 539 in PA
Livability — Lock Haven
- Score
- 78/100
- State rank
- #275
- US rank
- #2428
Category grades
Schools grade is shown separately in the Schools card above.
Census & demographics
- Census place
- Lock Haven, PA
- County
- Clinton County · 17,718 people
- City population
- 17,718
- Metro
- Lock Haven, PA
- Population (ZIP)
- 17,718
- Household income
- $58,555
- Rent vs Own
- Severe rent burden
- 522.0
Population outlook (Clinton County) Hauer SSP2
- Today (2025)
- 39,048 people
- By 2030
- 38,812 · -0.6%
- By 2040
- 38,011 · -2.7%
- By 2050
- 36,931 · -5.4%
- By 2075
- 34,077 · -12.7%
- By 2100
- 29,683 · -24.0%
Race, ethnicity, and origin ACS 2023
- Neighborhood character
- Predominantly White (92%)
- Race & ethnicity
- White 92% Two or more races 3% Black 3% Hispanic / Latino 2%
- Common ancestry
- Iranian 3% Lithuanian 3% Romanian 2%
- Foreign-born
- 2% · Canada
- Languages at home
- 96% English-only · Spanish 1% Other Indo-European 1% German/W. Germanic 1%
Political lean MEDSL · Clinton
- 2024 margin
- Solid R (+40.9) · D 29.1% · R 70.0%
- 2008→2024 swing
- -38.1pp toward R · 2008: -2.8pp · 2024: -40.9pp
- All cycles
- 2024: R+40.9 2020: R+36.3 2016: R+34.8 2012: R+11.3 2008: R+2.8
Not yet ingested
- Civics
- —
Market trends
- HPI YoY
- ▼ -21.42%
- Current HPI
- 270.5334
- Rent YoY
- ▲ 7.38%
- Metro
- Lock Haven, PA
- State GDP YoY
- ▲ 1.68%
- F500 in state
- 34
Industry mix (Fortune 500 HQ in PA)
| Industry | F500 HQs | Revenue |
|---|---|---|
| Healthcare | 2 | $309B |
|
||
| Insurance | 2 | $27B |
|
||
| Telecommunications / Media | 1 | $124B |
|
||
| Industrial Distribution | 1 | $22B |
|
||
| Financial Services | 1 | $20B |
|
||
| Chemicals / Materials | 1 | $18B |
|
||
Price history
+26.1% since first listed8 events — show timeline
- 2026-06-17 Pending — WBVAR
- 2026-06-12 Price Changed $75,000 WBVAR
- 2026-05-19 Price Changed $85,000 WBVAR
- 2026-05-04 Listed $95,000 WBVAR
- 2007-02-02 Sold (Public Records) $68,000 Public Records
- 2007-01-31 Sold (MLS) $68,000 WBVAR
- 2006-11-22 Listed $72,500 WBVAR
- 1997-08-01 Sold (Public Records) $59,500 Public Records
Property tax history
+4.9%/yrLatest (2026): $3,125 · -7.1% YoY. Source: county tax records.
Cash-flow waterfall
monthlySold comps — $/sqft
last 12 mo · ≤1 miLoading sold comps…