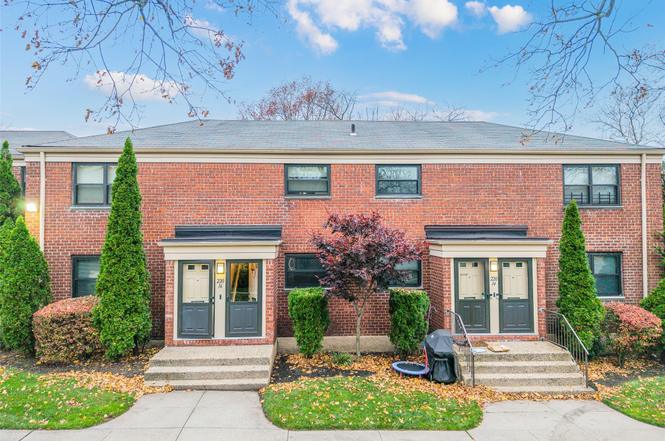
220-16 73 Ave Unit 013A2 · New York, NY
Flood risk 3/10 · Minor
- FEMA flood zone
- X (unshaded)
- Chance of flooding over 30 yrs
- 0.1%
- Est. flood insurance / yr
- $507 – $1,088
Fire risk 1/10 · Minimal
- Est. fire insurance / yr
- $691 – $1,283
Heat risk 6/10 · Moderate
- Hot days now (above 97°F)
- 7 days/yr
- Hot days in 30 yrs
- 15 days/yr
Wind risk 6/10 · Moderate
- Chance of severe wind over 30 yrs
- 27.0%
Air-quality risk 4/10 · Minor
- Unhealthy air days now
- 6 days/yr
- Unhealthy air days in 30 yrs
- 6 days/yr
Risk factors via First Street. Map © Google.
Why this score? — see what drove the D grade
The composite is a weighted blend of 9 inputs, each scored 0–100. Each bar is that input's sub-score; the figure is the points it added to the 100-point composite (weight × sub-score).
- Cash flow +10.6/30.0
- ARV discount +7.5/15.0
- Schools +5.0/10.0
- Rent growth +4.6/5.0
- Livability +3.8/5.0
- 1% rule +3.1/10.0
- DSCR +3.1/10.0
- Condition / age +2.5/5.0
- Appreciation +0.0/10.0
$348,000
🖨 Deal sheet 📄 Offer letter ✓ Due diligence
Listing remarks
Welcome to this comfortable CO-OP home in the heart of Bayside. 2 Bedrooms 1 Bath Upper Floor Apt, it has a Pull-Down Attic (Unfinished) Good for Storage Unit 013A2 sits in a quiet, tree-lined setting that immediately makes you feel at ease like a place you’ll want to come home to every day. Step inside and you’re greeted by a bright, open living space with plenty of room to relax or entertain guest. Big windows bring in soft, natural light, giving the home a warm and inviting atmosphere, the kitchen is practical and well cared for, with enough storage and counter space to make cooking simple and enjoyable. Located conveniently close to transportation (QM8 to Manhattan), Q88 An
Key facts
- Pull-down attic
- Park
- Garage
Tags
Neighborhood map
What this means for you Summary
Snapshot
- This is a 2-bed/1.0-bath condo listed at $348k.
Deal economics
- At list price, monthly cash flow is $-173 ($-2k/yr) — negative.
- To cash-flow at today's rent, offer at most $323k (7.2% below list).
- To meet the 1% rule (rent ≥ 1% of price), the offer needs to be $283k (18.8% below list).
- Recommended offer: $283k (18.8% below list) — sets the bar for 1% rule.
- Cap rate 5.7% vs local median 2.6% in New York — top-decile yield for the area; either an underpriced asset or a hidden risk that comps aren't pricing in. Stress-test before assuming the spread holds.
Location & tenants
- Location reads 75/100 on livability (#268 in NY, #4,188 nationally) — a middle-class / working-renter tenant base. Strengths: amenities A+, commute A+, health & safety A; Watch: crime F, cost of living F.
- Market conditions: Rents rising fast (+8.5%/yr); 248 active listings in the ZIP; 9 comparable units currently listed for rent nearby; rentals at typical pace (median 25d on market — plan ~3-4 weeks tenant-placement turnaround); solid renter incomes; 5,302 units permitted in Queens County in 2024 (4,918 in 5+ unit buildings).
- This rent runs 34% of the median local income ($98k/yr) — at the standard rent-burdened threshold; future hikes will face affordability resistance.
Forward outlook
- Local home prices are declining (-3.0%/yr); year-one equity from $2k of loan paydown is wiped out by about $10k of value loss. Plan a longer hold.
- Queens County population projected at +16% by 2050 — long-run rental-demand tailwind backs the buy-and-hold thesis.
Negotiation context
- It's been on market 124 days — a 12% lower offer ($306k) is reasonable based on typical stale-listing flexibility.
- 2 sale attempts since 6y ago with the ask held roughly flat each time — persistent listings suggest the price (not the market) is what's stuck; bring a comps-based counter.
Risks & watch-outs
- Watch-outs: built in 1952 — expect roof / HVAC / electrical / plumbing capex.
- Climate carrying-cost: major wind risk, 27% chance of damaging wind over 30y; extreme-heat days projected 7→15/yr by 2055 (HVAC capex compounding) — expect insurance premiums to compound above CPI over the hold.
Questions for the listing agent
- What do current leases actually rent for vs. the listed asking? Can we see a recent rent roll and the last 12 months of T-12 income?
- It's been on market 124 days. Have you received any prior offers? Is the seller open to a 19% concession, seller financing, or rate buy-down credit?
- Built in 1952 — when were the roof, HVAC, electrical panel, plumbing, and water heater last replaced?
- Any open or pending special assessments — roof, HVAC, plumbing, elevator, façade? What's the per-unit balance and payoff schedule, and is the seller paying it off at close or rolling it to the buyer?
- Why hasn't it sold? Are there any deal-killer items the seller is aware of (foundation, flood, title, zoning, code violations)?
- Is there a deadline driving the sale (1031 exchange, divorce, estate, relocation)? That informs how much negotiation room exists.
- Schools are B-rated — typically a magnet for longer-tenancy family renters. What's the average tenant stay here, and is there a school-zone premium baked into asking?
- Crime grade is F in this area — have there been break-ins, vandalism, or insurance claims at this property in the last 3 years? What carrier currently insures it and at what premium?
- The area grade is low — what's the realistic commute time and amenity access for the typical tenant pool here? Any planned neighborhood developments (good or bad) we should know about?
- What's the average days-on-market for RENTAL listings here right now (not sales)? A rising rental-DOM trend means longer vacancies and softer asking-rent achievability than the comps imply.
- What's the recent tenant-quality profile in this submarket — average credit score on applications, eviction rate, late-payment / NSF rate, and stable-employment percentage? A property-management company in the area should have these aggregated.
- How much new apartment / multifamily construction is in the pipeline within 1–3 miles? Heavy new supply (>2% of stock underway) typically softens rents 12–24 months out; light construction supports rent growth.
Investment metrics
- 1% rule
- 0.81% ✗
- Cap rate
- 5.70%
- Cash-on-cash
- -2.12%
- DSCR
- 0.91
- GRM
- 10.3
CMA / ARV
No comps found within radius.
Projected returns pro-forma
-3.0% appreciation · 8.0% rent growth · sell at horizon
- IRR
- -14.4%
- Equity multiple
- 0.46×
- Total profit
- $-52,403
- Equity at exit
- $51,888
- IRR
- 1.0%
- Equity multiple
- 1.09×
- Total profit
- $8,363
- Equity at exit
- $30,089
Cash invested: $97,440 (down + closing). Projections, not guarantees.
Landlord ↔ Tenant lean methodology
- Overall (CITY)
- 0 Strongly Tenant-Friendly
- State New York
- 15 Strongly Tenant-Friendly · D+10
- County
- — inherits STATE
- City New York
- 0 Strongly Tenant-Friendly · D+34
ZIP-level market 11364
- Rents YoY
- 8.5%
- Active inventory
- 248
- Price-to-rent
- 10.3×
Monthly cashflow live
- Estimated rent
- $2,826 high interval (Pro) →
- Mortgage (P&I)
- −$1,825
- Tax est. 1.5%
- −$435 /mo · $5,220/yr
- Insurance
- −$145
- HOA
- −$0
- Vacancy / Maint / Mgmt
- −$593
- Net cashflow
- $-173
Break-even live
UW: 25.0% down · 7.5% · 30yr · 1.5% tax · 5.0% vac · 8.0% maint · 8.0% mgmt
Financing live
Cash to close
- Down payment
- $87,000
- Closing costs
- $10,440
- Reserves months
- —
- Total cash needed
- —
Loan-product check · same deal, 3 products live
Conventional
25% down · 7.5% · 30yr
- Down + closing
- —
- Monthly P&I
- —
- Monthly cashflow
- —
- DSCR
- —
- Eligible?
- —
Personal DTI + credit; lowest rate.
DSCR
20% down · 8.5% · 30yr
- Down + closing
- —
- Monthly P&I
- —
- Monthly cashflow
- —
- DSCR
- —
- Eligible?
- —
No personal income docs; deal must DSCR.
Hard money
10% down · 12.0% · 12mo
- Down + closing
- —
- Monthly P&I
- —
- Monthly cashflow
- —
- DSCR
- —
- Eligible?
- —
Short-term bridge; refi at stabilization.
Rent comps 9 comps
| Address | Beds | Baths | Sqft | Rent | $/sqft | DOM | Units | Dist |
|---|---|---|---|---|---|---|---|---|
| 6747 222nd St Oakland Gardens, NY | 3.0 | 1.0 | 924 | $2,700 | $2.92 | 2d | 1 | 0.19mi |
| 232-15 67th Ave Unit 1FL Flushing, NY | 2.0 | 2.0 | 900 | $2,900 | $3.22 | 4d | 1 | 0.70mi |
| 56-25 226th St Unit 3 Bayside, NY | 3.0 | 1.5 | 977 | $3,250 | $3.33 | 24d | 1 | 0.83mi |
| 240-53 68th Ave Unit 1st Floor Douglaston, NY | 2.0 | 1.0 | 900 | $2,500 | $2.78 | 24d | 1 | 1.13mi |
| 203-06 53rd Ave Unit 2 Flushing, NY | 1.0 | 1.0 | 850 | $2,200 | $2.59 | 24d | 1 | 1.18mi |
| 7364 196th St Fresh Meadows, NY | 3.0 | 2.5 | 1000 | $5,500 | $5.50 | 24d | 1 | 1.27mi |
| 5839 196th Pl Fresh Meadows, NY | 2.0 | 1.0 | 750 | $2,750 | $3.67 | 24d | 1 | 1.31mi |
| 01 194th St Unit Main Fresh Meadows, NY | 1.0 | 1.0 | 895 | $2,400 | $2.68 | 14d | 1 | 1.42mi |
| 8827 208th St Queens Village, NY | 1.0 | 1.0 | 640 | $1,900 | $2.97 | 24d | 1 | 1.42mi |
HOA detail condo
- Monthly dues
- $0 · $0/yr
- Assessments
- None detected in remarks — confirm with the listing agent.
Listing history 5 events
-
2026-02-18status Pending
-
2025-10-17$348,000 Active
-
2020-11-03historical
-
2020-08-17price $338,000
-
2020-08-03$368,000 Active
ⓘ Source: listings_history table (triggers on properties + properties_extension) + one-shot
backfill from property_details.listing_events for pre-trigger history.
Climate risk First Street
- Flood 3/10 Moderate FEMA zone X (unshaded) · 10% chance over 30 yrs
- Wildfire 1/10 Low
- Heat 6/10 Major 7 d/yr ≥97°F today · 15 d/yr by 30 yrs out
- Wind 6/10 Major 27% chance of damaging wind over 30 yrs
- Air quality 4/10 Moderate 6 unhealthy d/yr today · 6 by 30 yrs out
Nearby sold comps map
Loading sold comps map…
Walkable amenities ~0.75 mi
Loading nearby amenities…
Taxation est. · year 1
- Rental income
- $33,910
- − Mortgage interest
- −$19,493
- − Property taxes
- −$5,220
- − Insurance
- −$1,740
- − Repairs & maintenance
- −$2,713
- − Management
- −$2,713
- − Depreciation
- −$10,124
- Taxable loss
- −$8,092
- Est. tax savings @ 24.0%
- +$1,942
- After-tax cash flow
- $-128/yr
For passive investors: Depreciation is non-cash, so a rental often shows a tax loss while cash-flowing — sheltering income. Rental losses are passive: they offset passive income freely, and up to $25,000/yr can offset ordinary (W-2) income if you actively participate and your MAGI is under $100k (phasing out to $0 by $150k); unused losses carry forward. On sale, claimed depreciation is recaptured at up to 25%, and gains may owe capital-gains tax (a 1031 exchange can defer both). Figures are a year-1 estimate at your 24.0% rate — not tax advice; consult a CPA.
Schools (NCES district)
No district data.
Livability — New York
- Score
- 75/100
- State rank
- #268
- US rank
- #4188
Category grades
Schools grade is shown separately in the Schools card above.
Census & demographics
- Census place
- New York, NY
- County
- Queens County · 1,914,869 people
- City population
- 7,731,280
- Metro
- New York-Newark-Jersey City, NY-NJ-PA
- Population (ZIP)
- 35,276
- Household income
- $98,359
- Rent vs Own
- Severe rent burden
- 1288.0
Population outlook (Queens County) Hauer SSP2
- Today (2025)
- 2,546,320 people
- By 2030
- 2,643,059 · +3.8%
- By 2040
- 2,815,563 · +10.6%
- By 2050
- 2,944,423 · +15.6%
- By 2075
- 3,123,338 · +22.7%
- By 2100
- 3,098,688 · +21.7%
Race, ethnicity, and origin ACS 2023
- Neighborhood character
- Diverse neighborhood (Simpson 0.64)
- Race & ethnicity
- Asian 50% White 29% Hispanic / Latino 15% Two or more races 7% Black 2%
- Hispanic origin (detail)
- Puerto Rican 3% Dominican 2%
- Common ancestry
- Romanian 2% Scotch-Irish 2% Lithuanian 1%
- Foreign-born
- 44% · China, South Korea, Canada
- Languages at home
- 41% English-only · Chinese 30% Spanish 9% Korean 8%
Political lean MEDSL · Queens
- 2024 margin
- Strong D (+24.6) · D 62.3% · R 37.7%
- 2008→2024 swing
- -26.2pp toward R · 2008: 50.8pp · 2024: 24.6pp
- All cycles
- 2024: D+24.6 2020: D+45.2 2016: D+53.4 2012: D+58.5 2008: D+50.8
Not yet ingested
- Civics
- —
Market trends
- HPI YoY
- ▼ -179.50%
- Current HPI
- 242.5386
- Rent YoY
- ▲ 8.47%
- Metro
- New York-Newark-Jersey City, NY-NJ-PA
- State GDP YoY
- ▲ 2.60%
- F500 in state
- 92
Industry mix (Fortune 500 HQ in NY)
| Industry | F500 HQs | Revenue |
|---|---|---|
| Financial Services | 10 | $950B |
|
||
| Consumer Goods | 9 | $162B |
|
||
| Insurance | 4 | $225B |
|
||
| Telecommunications | 2 | $144B |
|
||
| Pharmaceuticals | 2 | $112B |
|
||
| Media / Entertainment | 2 | $69B |
|
||
Price history
-5.4% since first listed5 events — show timeline
- 2026-02-18 Pending — OneKey® MLS as Distributed by MLS Grid
- 2025-10-17 Listed $348,000 OneKey® MLS as Distributed by MLS Grid
- 2020-11-03 Listing Removed — OneKey® MLS as Distributed by MLS Grid
- 2020-08-17 Price Changed $338,000 OneKey® MLS as Distributed by MLS Grid
- 2020-08-03 Listed $368,000 OneKey® MLS as Distributed by MLS Grid
Cash-flow waterfall
monthlySold comps — $/sqft
last 12 mo · ≤1 miLoading sold comps…