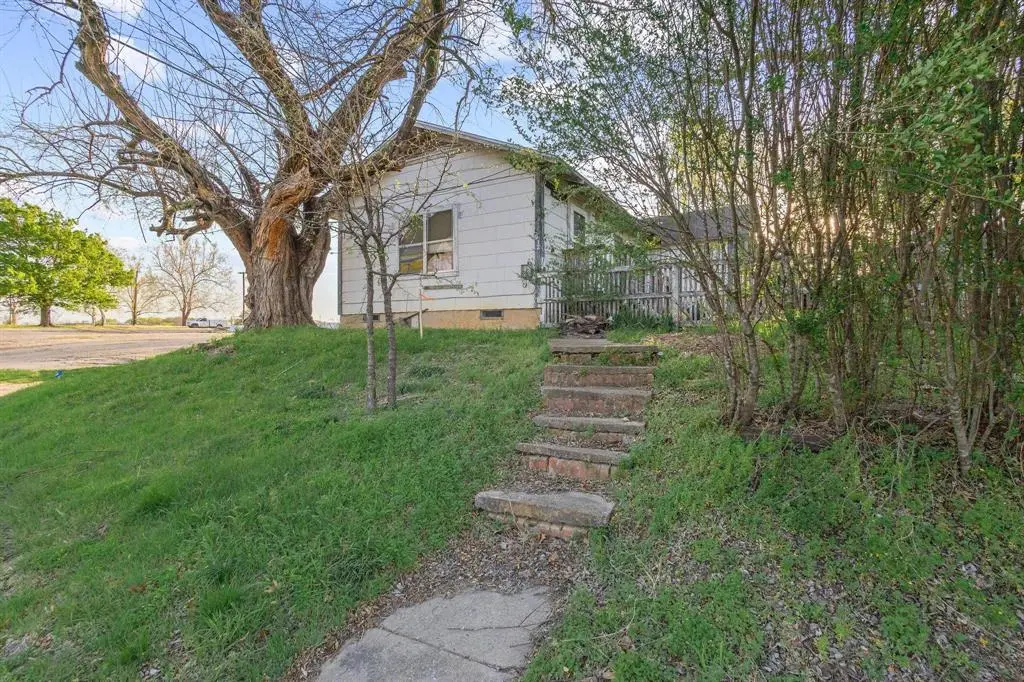
912 N Tone Ave · Denison, TX
Flood risk 1/10 · Minimal
- FEMA flood zone
- X (unshaded)
- Chance of flooding over 30 yrs
- 0.0%
- Est. flood insurance / yr
- $507 – $1,088
Fire risk 4/10 · Minor
- Est. fire insurance / yr
- $1,222 – $2,270
Heat risk 6/10 · Moderate
- Hot days now (above 109°F)
- 7 days/yr
- Hot days in 30 yrs
- 21 days/yr
Wind risk 4/10 · Minor
- Chance of severe wind over 30 yrs
- 19.0%
Air-quality risk 3/10 · Minor
- Unhealthy air days now
- 3 days/yr
- Unhealthy air days in 30 yrs
- 3 days/yr
Risk factors via First Street. Map © Google.
Why this score? — see what drove the B- grade
The composite is a weighted blend of 9 inputs, each scored 0–100. Each bar is that input's sub-score; the figure is the points it added to the 100-point composite (weight × sub-score).
- Cash flow +30.0/30.0
- 1% rule +10.0/10.0
- DSCR +10.0/10.0
- ARV discount +7.5/15.0
- Schools +3.7/10.0
- Livability +3.7/5.0
- Rent growth +2.5/5.0
- Condition / age +2.5/5.0
- Appreciation +0.0/10.0
$49,900
🖨 Deal sheet 📄 Offer letter ✓ Due diligence
Listing remarks
Exceptional investment opportunity located at 912 N Tone Avenue in Denison, TX. This property presents a rare chance for investors, builders, or buyers looking to create value in a growing area. The lot is equipped with city water, sewer, and gas, offering added convenience for renovation or new construction. The existing residence features a 2-bedroom, 1-bath layout and is currently cooled by window units, with gas available for heating and cooking. While the home is in need of updates, it provides a solid starting point for those looking to renovate and reposition the property, or alternatively, the lot offers strong potential for a new build tailored to today’s market demand. Wheth
Key facts
- Sewer
- City water
- Gas
Tags
Property features AI
Finance
- Financial info: Listing accepts 1031 exchange, cash, conventional, and other financing types
- HOA & community: No homeowners association
Exterior
- Parking: Off-street parking (no covered spaces or carport reported)
- Utilities: City water; City sewer; No municipal utility district
- Home design: Single-family residence; One story; Built in 1930; Not attached to another property
- Construction: Built in 1930
- Exterior features: Lot under 0.5 acre (approximately 0.103 acres); Alley access and off-street parking
Interior
- Kitchen: Gas oven
- Bedrooms: Two bedrooms (both on the main level)
- Bathrooms: One full bathroom
- Interior features: Two living/dining areas (combined count reflects 2 main rooms); Other interior features
Neighborhood map
What this means for you Summary
Snapshot
- This is a 2-bed/1.0-bath single-family listed at $50k.
Deal economics
- At list price, monthly cash flow is $579 ($7k/yr) — positive.
- The deal already cash-flows at list — no discount required.
- Meets the 1% rule at list price ($1k rent vs $50k).
- Recommended offer: $49k (1.5% below list) — sets the bar for market timing.
- Cap rate 20.2% vs local median 3.8% in Denison — top-decile yield for the area; either an underpriced asset or a hidden risk that comps aren't pricing in. Stress-test before assuming the spread holds.
Location & tenants
- Location reads 73/100 on livability (#221 in TX) — a middle-class / working-renter tenant base. Strengths: cost of living A+, housing A+, crime A; Watch: health & safety D+, amenities F, commute F.
- Denison ISD (urban): math 43% / reading 44% proficiency, ranked #315 of 826 in TX (top 38%) — families likely to look elsewhere, expect single-tenant / working-renter base with shorter leases.
- Zoned schools: Houston El (math 47% / reading 42%, grade F, #1,155 of 4,322 statewide, top 29%, 286 students, 74% FRL) — zoned schools average 74% FRL vs 54% district-wide (20 pts higher); higher-poverty schools than district average — tighter screening recommended.
- Market conditions: Rents flat; 485 active listings in the ZIP; 29 comparable units currently listed for rent nearby; rentals lingering (median 44d on market — plan ~5-8 weeks vacancy on turnover, expect pricing pressure); 59% of comp listings sitting > 30 days — soft ceiling on asking rent; 2,272 units permitted in Grayson County in 2024 (750 in 5+ unit buildings).
Forward outlook
- Local home prices are declining (-3.0%/yr); year-one equity from $345 of loan paydown is wiped out by about $1k of value loss. Plan a longer hold.
- Grayson County population projected at +12% by 2050 — modest demand growth; plan on rents tracking national, not racing it.
- At projected returns (-3.0% appreciation + 0.1% rent growth), your $14k cash investment doubles in ~3 years — after that, you're playing with house money.
Negotiation context
- It's been on market 25 days — a 2% lower offer ($49k) is reasonable based on typical stale-listing flexibility.
- 2 sale attempts with the ask held roughly flat each time — persistent listings suggest the price (not the market) is what's stuck; bring a comps-based counter.
Risks & watch-outs
- Watch-outs: built in 1930 — expect roof / HVAC / electrical / plumbing capex.
- Climate carrying-cost: extreme-heat days projected 7→21/yr by 2055 (HVAC capex compounding) — expect insurance premiums to compound above CPI over the hold.
Questions for the listing agent
- Built in 1930 — when were the roof, HVAC, electrical panel, plumbing, and water heater last replaced?
- Is there a deadline driving the sale (1031 exchange, divorce, estate, relocation)? That informs how much negotiation room exists.
- Schools are D-rated, which usually means shorter tenancies and higher turnover. Who's the typical renter profile here, and what's been the actual vacancy rate?
- What's the average days-on-market for RENTAL listings here right now (not sales)? A rising rental-DOM trend means longer vacancies and softer asking-rent achievability than the comps imply.
- What's the recent tenant-quality profile in this submarket — average credit score on applications, eviction rate, late-payment / NSF rate, and stable-employment percentage? A property-management company in the area should have these aggregated.
- How much new for-sale + rental construction is in the pipeline within 1–3 miles? Heavy new supply typically softens prices + rents 12–24 months out; constrained supply supports both.
Investment metrics
- 1% rule
- 2.35% ✓
- Cap rate
- 20.21%
- Cash-on-cash
- 49.69%
- DSCR
- 3.21
- GRM
- 3.6
CMA / ARV
- ARV (median comp)
- $130,939
- List price
- $49,900
- Delta
- -61.89%
- Verdict
- UNDERPRICED
- Comps
- 20 within 1.0 mi
Show comp detail 1 sale within ~0.75 mi
| Address | Dist | Beds/Ba | Sqft | Sold | Price | $/sf | Match |
|---|---|---|---|---|---|---|---|
| 912 N Tone Ave | 0.00mi | 2/1.0 | 754 (0%) | 0mo | $49,900 | $66 | 100 |
Match score weights: distance 35% · size 25% · config 20% · recency 20%. Top-matched comps best support the ARV.
Projected returns pro-forma
-3.0% appreciation · 0.05% rent growth · sell at horizon
- IRR
- 44.0%
- Equity multiple
- 2.82×
- Total profit
- $25,404
- Equity at exit
- $7,440
- IRR
- 48.6%
- Equity multiple
- 5.05×
- Total profit
- $56,586
- Equity at exit
- $4,314
Cash invested: $13,972 (down + closing). Projections, not guarantees.
Landlord ↔ Tenant lean methodology
- Overall (STATE)
- 87 Strongly Landlord-Friendly
- State Texas
- 87 Strongly Landlord-Friendly · R+5
- County
- — inherits STATE
- City
- — inherits STATE
ZIP-level market 75020
- Rents YoY
- 0.1%
- Active inventory
- 485
- Price-to-rent
- 3.6×
Monthly cashflow live
- Estimated rent
- $1,171 high interval (Pro) →
- Mortgage (P&I)
- −$262
- Tax from tax record
- −$64 /mo · $765/yr
- Insurance
- −$21
- HOA
- −$0
- Vacancy / Maint / Mgmt
- −$246
- Net cashflow
- $579
Break-even live
UW: 25.0% down · 7.5% · 30yr · 1.5% tax · 5.0% vac · 8.0% maint · 8.0% mgmt
Financing live
Cash to close
- Down payment
- $12,475
- Closing costs
- $1,497
- Reserves months
- —
- Total cash needed
- —
Loan-product check · same deal, 3 products live
Conventional
25% down · 7.5% · 30yr
- Down + closing
- —
- Monthly P&I
- —
- Monthly cashflow
- —
- DSCR
- —
- Eligible?
- —
Personal DTI + credit; lowest rate.
DSCR
20% down · 8.5% · 30yr
- Down + closing
- —
- Monthly P&I
- —
- Monthly cashflow
- —
- DSCR
- —
- Eligible?
- —
No personal income docs; deal must DSCR.
Hard money
10% down · 12.0% · 12mo
- Down + closing
- —
- Monthly P&I
- —
- Monthly cashflow
- —
- DSCR
- —
- Eligible?
- —
Short-term bridge; refi at stabilization.
Rent comps 29 comps
| Address | Beds | Baths | Sqft | Rent | $/sqft | DOM | Units | Dist |
|---|---|---|---|---|---|---|---|---|
| 1016 W Gandy St #4 Denison, TX | 2.0 | 1.5 | 1000 | $1,100 | $1.10 | 43d | 1 | 0.51mi |
| 1703 W Elm St Denison, TX | 2.0 | 1.0 | 800 | $875 | $1.09 | 20d | 1 | 0.57mi |
| 1701 W Elm St Denison, TX | 2.0 | 1.0 | 800 | $900 | $1.12 | 20d | 1 | 0.57mi |
| 621 W Gandy St Denison, TX | 1.0 | 1.0 | 550 | $1,075 | $1.95 | 43d | 1 | 0.60mi |
| 617 W Gandy St Unit 3 Denison, TX | 2.0 | 2.0 | 750 | $1,200 | $1.60 | 43d | 1 | 0.61mi |
| 617 W Gandy St Unit 2 Denison, TX | 1.0 | 1.0 | 600 | $799 | $1.33 | 43d | 1 | 0.61mi |
| 108 N Eddy Ave Denison, TX | 1.0 | 1.0 | 882 | $1,100 | $1.25 | 43d | 1 | 0.63mi |
| 820 W Crawford St Denison, TX | 2.0 | 1.0 | 996 | $1,250 | $1.26 | 20d | 1 | 0.80mi |
| 1829 Ridgewood Rd Denison, TX | 3.0 | 1.0 | 1040 | $1,100 | $1.06 | 43d | 1 | 0.83mi |
| 817 W Owing St Denison, TX | 1.0 | 1.0 | 700 | $800 | $1.14 | 20d | 1 | 0.84mi |
| 1120 W Owing St Denison, TX | 3.0 | 2.0 | 1090 | $1,225 | $1.12 | 20d | 1 | 0.85mi |
| 626 W Crawford St Unit 101 Denison, TX | 2.0 | 2.0 | 950 | $950 | $1.00 | 20d | 1 | 0.86mi |
| 1905 W Morton St #20 Denison, TX | 2.0 | 1.5 | 1008 | $1,250 | $1.24 | 43d | 1 | 0.87mi |
| 310 S Barrett Ave #101 Denison, TX | 1.0 | 1.0 | 627 | $775 | $1.24 | 20d | 1 | 0.87mi |
| 317 W Main St Unit 202 Denison, TX | 1.0 | 1.0 | 1000 | $1,700 | $1.70 | 43d | 1 | 0.89mi |
| 317 W Main St #203 Denison, TX | 1.0 | 1.0 | 1000 | $1,600 | $1.60 | 43d | 1 | 0.89mi |
| 105 E Bond St Denison, TX | 2.0 | 1.0 | 825 | $950 | $1.15 | 43d | 1 | 0.93mi |
| 610 W Owing St Denison, TX | 3.0 | 2.0 | 1108 | $1,395 | $1.26 | 43d | 1 | 0.93mi |
| 410 S Mirick Ave Denison, TX | 3.0 | 2.0 | 1100 | $1,300 | $1.18 | 43d | 1 | 0.98mi |
| 412 W Day St Denison, TX | 2.0 | 1.0 | 900 | $1,200 | $1.33 | 20d | 1 | 1.27mi |
| 404 W Day St Denison, TX | 3.0 | 2.0 | 1057 | $1,500 | $1.42 | 20d | 1 | 1.27mi |
| 912 S Armstrong st. / 731 W. Hull AVE Denison, TX | 2.0 | 1.0 | 580 | $849 | $1.46 | 20d | 1 | 1.28mi |
| 701 W Hull St Denison, TX | 2.0 | 1.0 | 637 | $1,100 | $1.73 | 43d | 1 | 1.29mi |
| 526 W Munson St Unit 2 Denison, TX | 2.0 | 1.0 | 778 | $999 | $1.28 | 43d | 1 | 1.29mi |
| 526 W Munson St Denison, TX | 2.0 | 1.0 | 778 | $849 | $1.09 | 20d | 2 | 1.29mi |
| 1011 S Perry Ave Denison, TX | 2.0 | 2.0 | 1079 | $1,350 | $1.25 | 43d | 1 | 1.32mi |
| 818 W Texas St Denison, TX | 3.0 | 1.0 | 720 | $1,100 | $1.53 | 20d | 1 | 1.37mi |
| 224 W Hull St Unit B Denison, TX | 1.0 | 1.0 | 743 | $999 | $1.34 | 43d | 1 | 1.47mi |
| 224 W Hull St Unit A Denison, TX | 2.0 | 1.0 | 743 | $1,250 | $1.68 | 43d | 1 | 1.47mi |
Listing history 5 events
-
2026-05-01$49,900 Active 1231-char remark
-
2026-04-23historical
-
2026-03-20$52,000 Active
-
2025-04-08soldstatus
-
1964-07-09soldstatus
ⓘ Source: listings_history table (triggers on properties + properties_extension) + one-shot
backfill from property_details.listing_events for pre-trigger history.
Tax reassessment forecast TX · Resets to sale price
- Current annual tax
- $765 · $64/mo
- Projected year-2 tax
- $913 · $76/mo
- Expected delta
- +$148/yr (+$12/mo · 19.4%)
ⓘ Screening estimate from a state-policy table — verify with the county assessor before closing.
Climate risk First Street
- Flood 1/10 Low FEMA zone X (unshaded) · 0% chance over 30 yrs
- Wildfire 4/10 Moderate
- Heat 6/10 Major 7 d/yr ≥109°F today · 21 d/yr by 30 yrs out
- Wind 4/10 Moderate 19% chance of damaging wind over 30 yrs
- Air quality 3/10 Moderate 3 unhealthy d/yr today · 3 by 30 yrs out
Nearby sold comps map
Loading sold comps map…
Walkable amenities ~0.75 mi
Loading nearby amenities…
Taxation est. · year 1
- Rental income
- $14,047
- − Mortgage interest
- −$2,795
- − Property taxes
- −$765
- − Insurance
- −$250
- − Repairs & maintenance
- −$1,124
- − Management
- −$1,124
- − Depreciation
- −$1,452
- Taxable income
- $6,538
- Est. tax owed @ 24.0%
- −$1,569
- After-tax cash flow
- $5,373/yr
For passive investors: Depreciation is non-cash, so a rental often shows a tax loss while cash-flowing — sheltering income. Rental losses are passive: they offset passive income freely, and up to $25,000/yr can offset ordinary (W-2) income if you actively participate and your MAGI is under $100k (phasing out to $0 by $150k); unused losses carry forward. On sale, claimed depreciation is recaptured at up to 25%, and gains may owe capital-gains tax (a 1031 exchange can defer both). Figures are a year-1 estimate at your 24.0% rate — not tax advice; consult a CPA.
Schools (NCES district)
- District
- Denison ISD
- NCES district ID
- 4816710
- Math proficiency
- 43% ▼ -7.00%
- Reading proficiency
- 44% ▼ -3.00%
- Median HH income
- $41,650
- Composite
- 36.6/100
- National rank
- #4629
- State rank
- #315 of 826 in TX
Livability — Denison
- Score
- 73/100
- State rank
- #221
- US rank
- #5428
Category grades
Schools grade is shown separately in the Schools card above.
Census & demographics
- Census place
- Denison, TX
- County
- Grayson County · 108,053 people
- City population
- 34,008
- Metro
- Sherman-Denison, TX
- Population (ZIP)
- 24,835
- Household income
- $71,605
- Rent vs Own
- Severe rent burden
- 997.0
Population outlook (Grayson County) Hauer SSP2
- Today (2025)
- 134,540 people
- By 2030
- 138,653 · +3.1%
- By 2040
- 145,958 · +8.5%
- By 2050
- 151,218 · +12.4%
- By 2075
- 161,802 · +20.3%
- By 2100
- 159,036 · +18.2%
Race, ethnicity, and origin ACS 2023
- Neighborhood character
- Predominantly White (73%)
- Race & ethnicity
- White 73% Hispanic / Latino 13% Two or more races 9% Black 6%
- Hispanic origin (detail)
- Mexican 11%
- Common ancestry
- Slovak 5% Serbian 2% Portuguese 2%
- Foreign-born
- 4% · Canada
- Languages at home
- 93% English-only · Spanish 6%
Political lean MEDSL · Grayson
- 2024 margin
- Solid R (+54.3) · D 22.5% · R 76.7%
- 2008→2024 swing
- -16.4pp toward R · 2008: -37.9pp · 2024: -54.3pp
- All cycles
- 2024: R+54.3 2020: R+49.9 2016: R+53.1 2012: R+48.0 2008: R+37.9
Not yet ingested
- Civics
- —
Market trends
- HPI YoY
- ▼ -295.96%
- Current HPI
- 257.1806
- Rent YoY
- ▬ 0.05%
- Metro
- Sherman-Denison, TX
- State GDP YoY
- ▲ 3.95%
- F500 in state
- 110
Industry mix (Fortune 500 HQ in TX)
| Industry | F500 HQs | Revenue |
|---|---|---|
| Energy | 16 | $1,198B |
|
||
| Technology | 5 | $198B |
|
||
| Engineering / Construction | 4 | $72B |
|
||
| Energy Services | 3 | $60B |
|
||
| Utilities | 3 | $41B |
|
||
| Healthcare | 2 | $330B |
|
||
Price history
-4.0% since first listed8 events — show timeline
- 2026-06-05 Sold (Public Records) — Public Records
- 2026-06-05 Sold (MLS) — NTREIS
- 2026-05-26 Pending — NTREIS
- 2026-05-01 Listed $49,900 NTREIS
- 2026-04-23 Listing Removed — NTREIS
- 2026-03-20 Listed $52,000 NTREIS
- 2025-04-08 Sold (Public Records) — Public Records
- 1964-07-09 Sold (Public Records) — Public Records
Property tax history
+3.3%/yrLatest (2025): $765 · -35.0% YoY. Source: county tax records.
Cash-flow waterfall
monthlySold comps — $/sqft
last 12 mo · ≤1 miLoading sold comps…