 Duplex
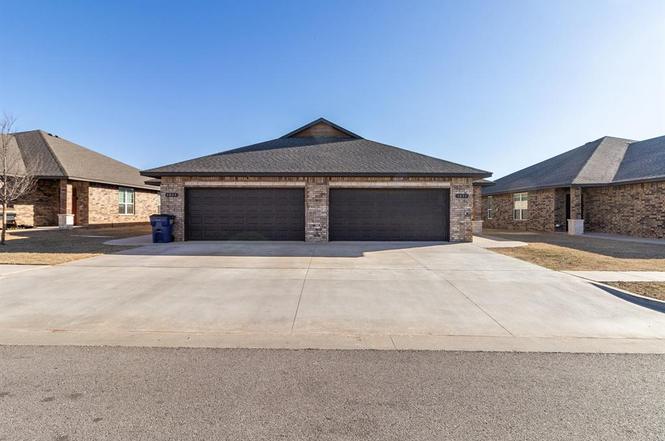
1852 Post Oak Rd #1854 · El Reno, OK
Flood risk 1/10 · Minimal
- FEMA flood zone
- X (unshaded)
- Chance of flooding over 30 yrs
- 0.0%
- Est. flood insurance / yr
- $507 – $1,088
Fire risk 2/10 · Minimal
- Est. fire insurance / yr
- $2,463 – $4,575
Heat risk 6/10 · Moderate
- Hot days now (above 107°F)
- 7 days/yr
- Hot days in 30 yrs
- 19 days/yr
Wind risk 3/10 · Minor
- Chance of severe wind over 30 yrs
- 6.0%
Air-quality risk 2/10 · Minimal
- Unhealthy air days now
- 1 days/yr
- Unhealthy air days in 30 yrs
- 2 days/yr
Risk factors via First Street. Map © Google.
Why this score? — see what drove the D grade
The composite is a weighted blend of 9 inputs, each scored 0–100. Each bar is that input's sub-score; the figure is the points it added to the 100-point composite (weight × sub-score).
- Cash flow +14.0/30.0
- ARV discount +8.5/15.0
- DSCR +4.3/10.0
- 1% rule +4.0/10.0
- Condition / age +4.0/5.0
- Rent growth +3.5/5.0
- Livability +3.4/5.0
- Schools +1.2/10.0
- Appreciation +0.0/10.0
$345,000
🖨 Deal sheet (PDF) 📄 Offer letter ✓ Due diligence
Multi-family units
County records classify this as Multi-Family (2-4 Unit). Listing-text estimate: 2 units. confirmed
Listing remarks
Welcome to The Villas at Settlers Crossing, where modern living meets outstanding investment potential. This beautifully designed 2,500 sq. ft. duplex (1,250 sq. ft. per side) offers the perfect opportunity for savvy investors or homeowners looking to generate rental income. Step inside each unit and enjoy spacious open-concept living areas featuring stylish stained concrete floors that provide both durability and contemporary charm. The kitchen is a true showstopper, complete with granite countertops, sleek cabinetry, and ample space for cooking and entertaining. Each unit features three generously sized bedrooms and two full bathrooms, offering comfort and functionality for tenants or hom
Key facts
- Sleek cabinetry
- Large walk-in closet
- Granite countertops
Tags
Property features AI
Finance
- Other: Property is leased and occupied; Two-unit building; Located in Villas At Settlers Crossing
- Financial info: Listing terms: Cash or Conventional
- HOA & community: Mandatory association dues; Association fee $150
Exterior
- Home design: One-level property; Residential income duplex
- Construction: Brick and frame construction; Composition roof; Slab foundation; Existing property
- Exterior features: Interior lot
Interior
- Kitchen: Dishwasher; Disposal; Microwave
- Bedrooms: 6 bedrooms
- Bathrooms: 4 full bathrooms
- Heating & cooling: Electric heating
- Interior features: Dishwasher; Disposal; Microwave; Water heater
- Laundry & utility: Water heater
Neighborhood map
What this means for you Summary
Snapshot
- This is a 2 × 3-bed/2.0-bath units multifamily listed at $345k. Condition is rated good.
Deal economics
- At list price, monthly cash flow is $47 ($565/yr) — positive. Per door: $24/mo.
- The deal already cash-flows at list — no discount required.
- To meet the 1% rule (rent ≥ 1% of price), the offer needs to be $309k (10.3% below list).
- Recommended offer: $309k (10.3% below list) — sets the bar for 1% rule.
- Cap rate 6.5% vs local median 4.8% in El Reno — top-decile yield for the area; either an underpriced asset or a hidden risk that comps aren't pricing in. Stress-test before assuming the spread holds.
Location & tenants
- Location reads 67/100 on livability (#95 in OK) — a middle-class / working-renter tenant base. Strengths: cost of living A+, housing A+, crime B+; Watch: health & safety C-, amenities F, commute F.
- El Reno (town): math 12% / reading 15% proficiency, ranked #232 of 270 in OK (top 86%) — low school quality limits family demand, transient renter base, plan for 1-2y turnover; 68% free/reduced lunch — lower-income household profile, screen leases tightly.
- Zoned schools: Lincoln Learning Ctr (math 12% / reading 12%, grade F, #667 of 845 statewide, top 82%, 384 students, 0% FRL); Etta Dale Jhs (math 7% / reading 13%, grade F, #277 of 345 statewide, top 83%, 444 students, 0% FRL); El Reno Hs (math 16% / reading 19%, grade F, #307 of 447 statewide, top 69%, 980 students, 0% FRL) — zoned schools average 0% FRL vs 68% district-wide (68 pts lower); this property's tenant base skews higher-income than the district average.
- Market conditions: Rents rising fast (+4.2%/yr); 281 active listings in the ZIP; 3 comparable units currently listed for rent nearby; rentals at typical pace (median 24d on market — plan ~3-4 weeks tenant-placement turnaround); 260 units permitted in Canadian County in 2024 (0 in 5+ unit buildings).
- At $3,094/mo this rent would consume 62% of the median local household income ($60k/yr) (locally 580% of renters already pay >50% of income on rent) — very limited rent-growth headroom before tenants either downsize or default.
Forward outlook
- Local home prices are declining (-3.0%/yr); year-one equity from $2k of loan paydown is wiped out by about $10k of value loss. Plan a longer hold.
- Canadian County population projected at +64% by 2050 — long-run rental-demand tailwind backs the buy-and-hold thesis.
Negotiation context
- It's been on market 104 days — a 9% lower offer ($314k) is reasonable based on typical stale-listing flexibility.
Risks & watch-outs
- Climate carrying-cost: extreme-heat days projected 7→19/yr by 2055 (HVAC capex compounding) — expect insurance premiums to compound above CPI over the hold.
Questions for the listing agent
- It's been on market 104 days. Have you received any prior offers? Is the seller open to a 10% concession, seller financing, or rate buy-down credit?
- Can we see the unit-by-unit rent roll, current vacancy, and any below-market leases? What's the average tenancy length?
- What capital expenditures (roof, boiler, parking lot, exteriors) have been made in the last 5 years, and what's planned in the next 2?
- What does the HOA fee cover, when was the last increase, and are there any pending special assessments or reserve-fund shortfalls?
- Why hasn't it sold? Are there any deal-killer items the seller is aware of (foundation, flood, title, zoning, code violations)?
- Is there a deadline driving the sale (1031 exchange, divorce, estate, relocation)? That informs how much negotiation room exists.
- Schools are F-rated, which usually means shorter tenancies and higher turnover. Who's the typical renter profile here, and what's been the actual vacancy rate?
- The area grade is low — what's the realistic commute time and amenity access for the typical tenant pool here? Any planned neighborhood developments (good or bad) we should know about?
- What's the average days-on-market for RENTAL listings here right now (not sales)? A rising rental-DOM trend means longer vacancies and softer asking-rent achievability than the comps imply.
- What's the recent tenant-quality profile in this submarket — average credit score on applications, eviction rate, late-payment / NSF rate, and stable-employment percentage? A property-management company in the area should have these aggregated.
- How much new apartment / multifamily construction is in the pipeline within 1–3 miles? Heavy new supply (>2% of stock underway) typically softens rents 12–24 months out; light construction supports rent growth.
Investment metrics
- 1% rule
- 0.90% ✗
- Cap rate
- 6.46%
- Cash-on-cash
- 0.58%
- DSCR
- 1.03
- GRM
- 9.3
CMA / ARV
- ARV (on-the-fly)
- $352,500
- Comps found
- 5
Show comp detail 5 sales within ~0.75 mi
| Address | Dist | Beds/Ba | Sqft | Sold | Price | $/sf | Match |
|---|---|---|---|---|---|---|---|
| 1818 Post Oak Rd #1820 | 0.09mi | 6/4.0 | 2,500 (0%) | 1mo | $335,000 | $134 | 95 |
| 1859 Cypress Ln | 0.09mi | 6/4.0 | 2,450 (-2%) | 6mo | $345,000 | $141 | 88 |
| 1835 Cypress Ln | 0.10mi | 6/4.0 | 2,450 (-2%) | 6mo | $345,000 | $141 | 88 |
| 1858 Cypress Ln | 0.05mi | 6/4.0 | 2,450 (-2%) | 12mo | $349,900 | $143 | 84 |
| 1507 N Pavy Pkwy | 0.57mi | 6/4.0 | 2,400 (-4%) | 24mo | $345,000 | $144 | 47 |
Match score weights: distance 35% · size 25% · config 20% · recency 20%. Top-matched comps best support the ARV.
Projected returns pro-forma
-3.0% appreciation · 4.19% rent growth · sell at horizon
- IRR
- -14.0%
- Equity multiple
- 0.49×
- Total profit
- $-49,106
- Equity at exit
- $51,441
- IRR
- -3.4%
- Equity multiple
- 0.76×
- Total profit
- $-22,922
- Equity at exit
- $29,829
Cash invested: $96,600 (down + closing). Projections, not guarantees.
Landlord ↔ Tenant lean methodology
- Overall (STATE)
- 83 Strongly Landlord-Friendly
- State Oklahoma
- 83 Strongly Landlord-Friendly · R+20
- County
- — inherits STATE
- City
- — inherits STATE
ZIP-level market 73036
- Home prices YoY
- -3.3%
- Rents YoY
- 4.2%
- Active inventory
- 281
- Price-to-rent
- 18.6×
Monthly cashflow live
- Estimated rent
- $3,094 high interval (Pro) →
- Mortgage (P&I)
- −$1,809
- Tax est. 1.5%
- −$431 /mo · $5,175/yr
- Insurance
- −$144
- HOA
- −$13
- Vacancy / Maint / Mgmt
- −$650
- Net cashflow
- $47
Break-even live
Sensitivity live
| Price | -10% $285 | -5% $166 | +0% $47 | +5% $-72 | +10% $-191 |
|---|---|---|---|---|---|
| Rent | -10% $-197 | -5% $-75 | +0% $47 | +5% $169 | +10% $291 |
| Rate | -1.0pp $221 | -0.5pp $135 | base $47 | +0.5pp $-42 | +1.0pp $-133 |
2-unit breakdown (identical units grouped — click to expand)
| Units | Beds | Baths | Est. rent |
|---|---|---|---|
| 2× units | 3 | 2 | $3,094 |
| #1 | 3 | 2 | $1,547 |
| #2 | 3 | 2 | $1,547 |
| Total (2 units) | $3,094 | ||
UW: 25.0% down · 7.5% · 30yr · 1.5% tax · 5.0% vac · 8.0% maint · 8.0% mgmt
Financing live
Cash to close
- Down payment
- $86,250
- Closing costs
- $10,350
- Reserves months
- —
- Total cash needed
- —
Loan-product check · same deal, 3 products live
Conventional
25% down · 7.5% · 30yr
- Down + closing
- —
- Monthly P&I
- —
- Monthly cashflow
- —
- DSCR
- —
- Eligible?
- —
Personal DTI + credit; lowest rate.
DSCR
20% down · 8.5% · 30yr
- Down + closing
- —
- Monthly P&I
- —
- Monthly cashflow
- —
- DSCR
- —
- Eligible?
- —
No personal income docs; deal must DSCR.
Hard money
10% down · 12.0% · 12mo
- Down + closing
- —
- Monthly P&I
- —
- Monthly cashflow
- —
- DSCR
- —
- Eligible?
- —
Short-term bridge; refi at stabilization.
Rent comps 3 comps
| Address | Beds | Baths | Sqft | Rent | $/sqft | DOM | Units | Dist |
|---|---|---|---|---|---|---|---|---|
| 1609 Maroon Dr El Reno, OK | 5.0 | 3.0 | 2483 | $2,049 | $0.83 | 3d | 1 | 0.32mi |
| 1705 Ruby Dr El Reno, OK | 5.0 | 2.5 | 2107 | $1,985 | $0.94 | 25d | 1 | 0.43mi |
| 1705 Ruby Dr El Reno, OK | 5.0 | 2.5 | 2213 | $1,985 | $0.90 | 23d | 1 | 0.43mi |
HOA detail
- Monthly dues
- $13 · $156/yr
Listing history 16 events
-
2026-06-21days on market $345,000 Active 104 DOM
-
2026-06-18days on market $345,000 Active 101 DOM
-
2026-06-17days on market $345,000 Active 100 DOM
-
2026-06-16days on market $345,000 Active 99 DOM
-
2026-06-15days on market $345,000 Active 98 DOM
-
2026-06-13days on market $345,000 Active 96 DOM
-
2026-06-13days on market $345,000 Active 95 DOM
-
2026-06-09days on market $345,000 Active 92 DOM
-
2026-06-08days on market $345,000 Active 91 DOM
-
2026-06-07days on market $345,000 Active 90 DOM
-
2026-06-05days on market $345,000 Active 87 DOM
-
2026-06-03days on market $345,000 Active 86 DOM
-
2026-06-02days on market $345,000 Active 85 DOM
-
2026-06-01days on market $345,000 Active 84 DOM
-
2026-05-31days on market $345,000 Active 83 DOM
-
2026-03-09$345,000 Active
ⓘ Source: listings_history table (triggers on properties + properties_extension) + one-shot
backfill from property_details.listing_events for pre-trigger history.
Climate risk First Street
- Flood 1/10 Low FEMA zone X (unshaded) · 0% chance over 30 yrs
- Wildfire 2/10 Low
- Heat 6/10 Major 7 d/yr ≥107°F today · 19 d/yr by 30 yrs out
- Wind 3/10 Moderate 6% chance of damaging wind over 30 yrs
- Air quality 2/10 Low 1 unhealthy d/yr today · 2 by 30 yrs out
Nearby sold comps map
Loading sold comps map…
Walkable amenities ~0.75 mi
Loading nearby amenities…
Taxation est. · year 1
- Rental income
- $37,128
- − Mortgage interest
- −$19,325
- − Property taxes
- −$5,175
- − Insurance
- −$1,725
- − Repairs & maintenance
- −$2,970
- − Management
- −$2,970
- − HOA
- −$156
- − Depreciation
- −$10,036
- Taxable loss
- −$5,230
- Est. tax savings @ 24.0%
- +$1,255
- After-tax cash flow
- $1,820/yr
For passive investors: Depreciation is non-cash, so a rental often shows a tax loss while cash-flowing — sheltering income. Rental losses are passive: they offset passive income freely, and up to $25,000/yr can offset ordinary (W-2) income if you actively participate and your MAGI is under $100k (phasing out to $0 by $150k); unused losses carry forward. On sale, claimed depreciation is recaptured at up to 25%, and gains may owe capital-gains tax (a 1031 exchange can defer both). Figures are a year-1 estimate at your 24.0% rate — not tax advice; consult a CPA.
Condition & rehab AI · 13 photos
This property is in good condition with no major repairs needed. It has a good roof, exterior, flooring, and interior walls. The property has a good potential for value increase with some cosmetic updates such as painting and landscaping.
Value-add opportunities
- Both Painting the exterior and interior walls — Fresh paint can enhance the curb appeal and interior aesthetics, making the property more attractive to potential buyers and renters.
- Both Landscaping the front yard — A well-maintained front yard can improve the overall appearance of the property and make it more appealing to potential buyers and renters.
Renovation cost estimate screening
Value-add ROI direction
- Both Painting the exterior and interior walls — Fresh paint can enhance the curb appeal and interior aesthetics, making the property more attractive to potential buyers and renters. ↑
- Both Landscaping the front yard — A well-maintained front yard can improve the overall appearance of the property and make it more appealing to potential buyers and renters. ↑
ⓘ Cost ranges are severity-bucket heuristics (US national rule-of-thumb). Get contractor quotes + a written scope before underwriting a rehab budget.
Schools (NCES district)
- District
- El Reno
- NCES district ID
- 4010650
- Math proficiency
- 12% ▼ -15.00%
- Reading proficiency
- 15% ▼ -9.00%
- Median HH income
- $44,689
- Composite
- 12.01/100
- National rank
- #9664
- State rank
- #232 of 270 in OK
Livability — El Reno
- Score
- 67/100
- State rank
- #95
- US rank
- #10933
Category grades
Schools grade is shown separately in the Schools card above.
Census & demographics
- Census place
- El Reno, OK
- County
- Canadian County · 154,341 people
- City population
- 21,387
- Metro
- Oklahoma City, OK
- Population (ZIP)
- 21,387
- Household income
- $59,915
- Rent vs Own
- Severe rent burden
- 580.0
Population outlook (Canadian County) Hauer SSP2
- Today (2025)
- 174,062 people
- By 2030
- 195,170 · +12.1%
- By 2040
- 239,293 · +37.5%
- By 2050
- 285,457 · +64.0%
- By 2075
- 403,766 · +132.0%
- By 2100
- 498,766 · +186.5%
Race, ethnicity, and origin ACS 2023
- Neighborhood character
- Predominantly White (65%)
- Race & ethnicity
- White 65% Hispanic / Latino 17% Two or more races 8% Native American 8% Black 6%
- Hispanic origin (detail)
- Mexican 14%
- Common ancestry
- Slovak 2% Serbian 2% Romanian 1%
- Foreign-born
- 5% · Canada
- Languages at home
- 89% English-only · Spanish 10%
Political lean MEDSL · Canadian
- 2024 margin
- Solid R (+40.4) · D 28.8% · R 69.2% · Other 2.0%
- 2008→2024 swing
- +11.9pp toward D · 2008: -52.2pp · 2024: -40.4pp
- All cycles
- 2024: R+40.4 2020: R+43.3 2016: R+51.2 2012: R+54.4 2008: R+52.2
Not yet ingested
- Civics
- —
Market trends
- HPI YoY
- ▼ -11.37%
- Current HPI
- 334.5896
- Rent YoY
- ▲ 4.19%
- Metro
- Oklahoma City, OK
- State GDP YoY
- ▲ 1.55%
- F500 in state
- 6
Industry mix (Fortune 500 HQ in OK)
| Industry | F500 HQs | Revenue |
|---|---|---|
| Energy | 3 | $48B |
|
||
Price history
1 event — show timeline
- 2026-03-09 Listed $345,000 MLSOK
Cash-flow waterfall
monthlySold comps — $/sqft
last 12 mo · ≤1 miLoading sold comps…