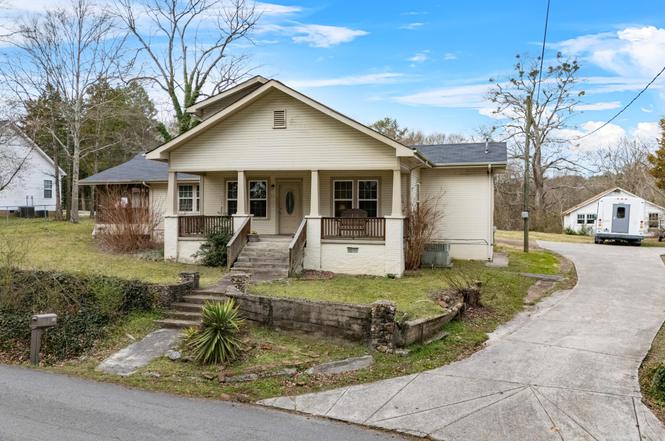
205 Wheeler Ave · Chickamauga, GA
Flood risk 1/10 · Minimal
- FEMA flood zone
- X (unshaded)
- Chance of flooding over 30 yrs
- 0.0%
- Est. flood insurance / yr
- $507 – $1,088
Fire risk 5/10 · Moderate
- Est. fire insurance / yr
- $963 – $1,789
Heat risk 5/10 · Moderate
- Hot days now (above 106°F)
- 7 days/yr
- Hot days in 30 yrs
- 19 days/yr
Wind risk 4/10 · Minor
- Chance of severe wind over 30 yrs
- 14.0%
Air-quality risk 3/10 · Minor
- Unhealthy air days now
- 2 days/yr
- Unhealthy air days in 30 yrs
- 2 days/yr
Risk factors via First Street. Map © Google.
Why this score? — see what drove the F grade
The composite is a weighted blend of 9 inputs, each scored 0–100. Each bar is that input's sub-score; the figure is the points it added to the 100-point composite (weight × sub-score).
- Cash flow +7.6/30.0
- ARV discount +7.5/15.0
- Schools +4.6/10.0
- Livability +3.4/5.0
- Rent growth +2.5/5.0
- Condition / age +2.5/5.0
- 1% rule +2.3/10.0
- DSCR +1.7/10.0
- Appreciation +0.0/10.0
$187,000
🖨 Deal sheet 📄 Offer letter ✓ Due diligence
Listing remarks
INVESTORS SPECIAL!!! This unique opportunity includes two properties sold together, offering ample space for entertaining, growth, and investment potential. The main home is situated within Chickamauga city limits and is zoned for the highly sought-after Chickamauga City Schools. Sold As-Is.
Key facts
- 0.31 acre lot
- Built 1937
- Listed 2 days
Property features AI
Finance
- Other: Additional parcel included (Parcel: 0147 060)
Exterior
- Parking: Concrete driveway
- Security: Smoke detectors
- Utilities: Public water; Public sewer; Electricity connected; Natural gas connected; Cable available; Water connected
- Home design: Single-family home; Two-story; Fixer condition
- Construction: Wood siding; Shingle roof; Combination foundation; Built with approximately 1,962 above-grade finished square feet
- Exterior features: Rain gutters; Outdoor storage; Partial fencing; Back yard; Front yard; Level lot
Interior
- Kitchen: Refrigerator; Microwave; Electric range; Dishwasher; Gas water heater
- Flooring: Carpet; Laminate; Tile
- Bathrooms: Two full bathrooms; One half bathroom
- Heating & cooling: Central heating (natural gas); Central air conditioning
- Interior features: Storage space; Primary suite located on the main floor
- Laundry & utility: Washer hookup; Electric dryer hookup; Laundry located on the main level (in bathroom)
Neighborhood map
What this means for you Summary
Snapshot
- This is a 4-bed/1.0-bath single-family listed at $187k.
Deal economics
- At list price, monthly cash flow is $-221 ($-3k/yr) — negative.
- To cash-flow at today's rent, offer at most $155k (17.1% below list).
- To meet the 1% rule (rent ≥ 1% of price), the offer needs to be $136k (27.5% below list).
- Recommended offer: $136k (27.5% below list) — sets the bar for 1% rule.
- Cap rate 4.9% vs local median 2.4% in Chickamauga — top-decile yield for the area; either an underpriced asset or a hidden risk that comps aren't pricing in. Stress-test before assuming the spread holds.
Location & tenants
- Location reads 68/100 on livability (#133 in GA) — a middle-class / working-renter tenant base. Strengths: crime A+, cost of living A+, housing A+; Watch: amenities F, commute F, health & safety F.
- Chickamauga City (suburban): math 50% / reading 60% proficiency, ranked #10 of 174 in GA (top 6%) — acceptable for families but not a draw, mixed tenant base, ~2y average lease; only 18% free/reduced lunch — higher-income household profile.
- Zoned schools: Chickamauga Elementary School (math 51% / reading 61%, grade C+, #165 of 1,228 statewide, top 14%, 558 students, 14% FRL); Gordon Lee High School (math 42% / reading 67%, grade C-, #21 of 424 statewide, top 5%, 408 students, 12% FRL) — zoned schools at 13% FRL track the district average.
- Market conditions: 160 active listings in the ZIP; 347 units permitted in Walker County in 2024 (24 in 5+ unit buildings).
Forward outlook
- Local home prices are declining (-3.0%/yr); year-one equity from $1k of loan paydown is wiped out by about $6k of value loss. Plan a longer hold.
- Walker County population projected at -16% by 2050 — secular population decline; favor cash flow + early exit over multi-decade hold.
Negotiation context
- Only 2 days on market — expect competitive offers; lowballing is unlikely to land.
- Current owner paid $60k; list at $187k implies a 211% gain — meaningful room to come down on a strong offer.
Risks & watch-outs
- Watch-outs: built in 1937 — expect roof / HVAC / electrical / plumbing capex.
- Climate carrying-cost: moderate wildfire risk; extreme-heat days projected 7→19/yr by 2055 (HVAC capex compounding) — expect insurance premiums to compound above CPI over the hold.
Questions for the listing agent
- What do current leases actually rent for vs. the listed asking? Can we see a recent rent roll and the last 12 months of T-12 income?
- Built in 1937 — when were the roof, HVAC, electrical panel, plumbing, and water heater last replaced?
- Is there a deadline driving the sale (1031 exchange, divorce, estate, relocation)? That informs how much negotiation room exists.
- The area grade is low — what's the realistic commute time and amenity access for the typical tenant pool here? Any planned neighborhood developments (good or bad) we should know about?
- What's the average days-on-market for RENTAL listings here right now (not sales)? A rising rental-DOM trend means longer vacancies and softer asking-rent achievability than the comps imply.
- What's the recent tenant-quality profile in this submarket — average credit score on applications, eviction rate, late-payment / NSF rate, and stable-employment percentage? A property-management company in the area should have these aggregated.
- How much new for-sale + rental construction is in the pipeline within 1–3 miles? Heavy new supply typically softens prices + rents 12–24 months out; constrained supply supports both.
Investment metrics
- 1% rule
- 0.73% ✗
- Cap rate
- 4.87%
- Cash-on-cash
- -5.06%
- DSCR
- 0.77
- GRM
- 11.5
CMA / ARV
No comps found within radius.
Projected returns pro-forma
-3.0% appreciation · 3.0% rent growth · sell at horizon
- IRR
- -24.9%
- Equity multiple
- 0.15×
- Total profit
- $-44,356
- Equity at exit
- $27,882
- IRR
- -20.7%
- Equity multiple
- -0.08×
- Total profit
- $-56,664
- Equity at exit
- $16,168
Cash invested: $52,360 (down + closing). Projections, not guarantees.
Landlord ↔ Tenant lean methodology
- Overall (STATE)
- 90 Strongly Landlord-Friendly
- State Georgia
- 90 Strongly Landlord-Friendly · R+3
- County
- — inherits STATE
- City
- — inherits STATE
ZIP-level market 30707
- Home prices YoY
- -18.9%
- Active inventory
- 160
- Price-to-rent
- 11.5×
Monthly cashflow live
- Estimated rent
- $1,356 medium interval (Pro) →
- Mortgage (P&I)
- −$981
- Tax est. 1.5%
- −$234 /mo · $2,805/yr
- Insurance
- −$78
- HOA
- −$0
- Vacancy / Maint / Mgmt
- −$285
- Net cashflow
- $-221
Break-even live
UW: 25.0% down · 7.5% · 30yr · 1.5% tax · 5.0% vac · 8.0% maint · 8.0% mgmt
Financing live
Cash to close
- Down payment
- $46,750
- Closing costs
- $5,610
- Reserves months
- —
- Total cash needed
- —
Loan-product check · same deal, 3 products live
Conventional
25% down · 7.5% · 30yr
- Down + closing
- —
- Monthly P&I
- —
- Monthly cashflow
- —
- DSCR
- —
- Eligible?
- —
Personal DTI + credit; lowest rate.
DSCR
20% down · 8.5% · 30yr
- Down + closing
- —
- Monthly P&I
- —
- Monthly cashflow
- —
- DSCR
- —
- Eligible?
- —
No personal income docs; deal must DSCR.
Hard money
10% down · 12.0% · 12mo
- Down + closing
- —
- Monthly P&I
- —
- Monthly cashflow
- —
- DSCR
- —
- Eligible?
- —
Short-term bridge; refi at stabilization.
Listing history 3 events
-
2026-06-18days on market $187,000 Active 2 DOM
-
2026-06-17remarks 292-char remark
-
2026-06-17$187,000 Active 1 DOM
ⓘ Source: listings_history table (triggers on properties + properties_extension) + one-shot
backfill from property_details.listing_events for pre-trigger history.
Climate risk First Street
- Flood 1/10 Low FEMA zone X (unshaded) · 0% chance over 30 yrs
- Wildfire 5/10 Major
- Heat 5/10 Major 7 d/yr ≥106°F today · 19 d/yr by 30 yrs out
- Wind 4/10 Moderate 14% chance of damaging wind over 30 yrs
- Air quality 3/10 Moderate 2 unhealthy d/yr today · 2 by 30 yrs out
Nearby sold comps map
Loading sold comps map…
Walkable amenities ~0.75 mi
Loading nearby amenities…
Taxation est. · year 1
- Rental income
- $16,273
- − Mortgage interest
- −$10,475
- − Property taxes
- −$2,805
- − Insurance
- −$935
- − Repairs & maintenance
- −$1,302
- − Management
- −$1,302
- − Depreciation
- −$5,440
- Taxable loss
- −$5,985
- Est. tax savings @ 24.0%
- +$1,436
- After-tax cash flow
- $-1,215/yr
For passive investors: Depreciation is non-cash, so a rental often shows a tax loss while cash-flowing — sheltering income. Rental losses are passive: they offset passive income freely, and up to $25,000/yr can offset ordinary (W-2) income if you actively participate and your MAGI is under $100k (phasing out to $0 by $150k); unused losses carry forward. On sale, claimed depreciation is recaptured at up to 25%, and gains may owe capital-gains tax (a 1031 exchange can defer both). Figures are a year-1 estimate at your 24.0% rate — not tax advice; consult a CPA.
Schools (NCES district)
- District
- Chickamauga City
- NCES district ID
- 1301140
- Math proficiency
- 50% ▼ -7.00%
- Reading proficiency
- 60% ▼ -3.00%
- Median HH income
- $45,292
- Composite
- 46.45/100
- National rank
- #2445
- State rank
- #10 of 174 in GA
Livability — Chickamauga
- Score
- 68/100
- State rank
- #133
- US rank
- #9195
Category grades
Schools grade is shown separately in the Schools card above.
Census & demographics
- Census place
- Chickamauga, GA
- Population (ZIP)
- 16,847
Population outlook (Walker County) Hauer SSP2
- Today (2025)
- 66,050 people
- By 2030
- 64,305 · -2.6%
- By 2040
- 60,127 · -9.0%
- By 2050
- 55,551 · -15.9%
- By 2075
- 44,886 · -32.0%
- By 2100
- 34,015 · -48.5%
Race, ethnicity, and origin ACS 2023
- Neighborhood character
- Predominantly White (93%)
- Race & ethnicity
- White 93% Black 3% Two or more races 3% Hispanic / Latino 2%
- Common ancestry
- Romanian 4% Slovak 3% Lithuanian 3%
- Foreign-born
- 1% · Canada
- Languages at home
- 98% English-only · Spanish 1%
Political lean MEDSL · Walker
- 2024 margin
- Solid R (+59.3) · D 20.1% · R 79.4%
- 2008→2024 swing
- -12.5pp toward R · 2008: -46.8pp · 2024: -59.3pp
- All cycles
- 2024: R+59.3 2020: R+59.3 2016: R+61.5 2012: R+50.2 2008: R+46.8
Not yet ingested
- Civics
- —
Market trends
- HPI YoY
- ▼ -63.05%
- Current HPI
- 270.6502
- Rent YoY
- —
- Metro
- —
- State GDP YoY
- ▲ 2.66%
- F500 in state
- 28
Industry mix (Fortune 500 HQ in GA)
| Industry | F500 HQs | Revenue |
|---|---|---|
| Paper / Packaging | 2 | $29B |
|
||
| Retail | 1 | $160B |
|
||
| Transportation / Logistics | 1 | $91B |
|
||
| Airlines | 1 | $62B |
|
||
| Consumer Goods | 1 | $47B |
|
||
| Utilities | 1 | $25B |
|
||
Price history
+210.6% since first listed9 events — show timeline
- 2026-06-16 Listed $187,000 GCAR
- 2025-11-05 Price Changed $229,000 GCAR
- 2025-10-16 Price Changed $243,000 GCAR
- 2025-08-31 Price Changed $275,000 GCAR
- 2025-07-22 Price Changed $335,000 GCAR
- 2025-07-07 Price Changed $345,000 GCAR
- 2025-06-11 Price Changed $359,000 GCAR
- 2025-04-12 Price Changed $380,000 GCAR
- 2009-08-10 Sold (Public Records) $60,200 Public Records
Property tax history
+5.7%/yrLatest (2025): $314 · -4.6% YoY. Source: county tax records.
Cash-flow waterfall
monthlySold comps — $/sqft
last 12 mo · ≤1 miLoading sold comps…