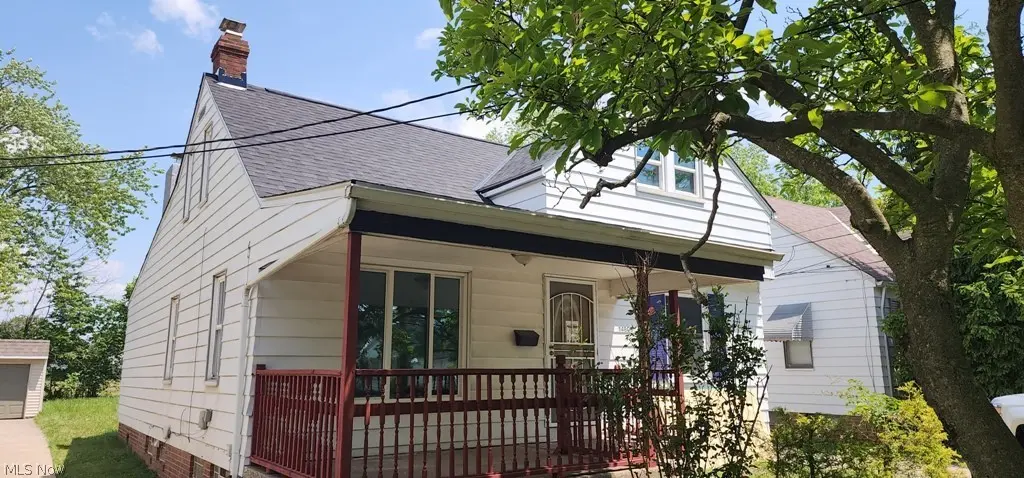
14809 Rockside Rd · Maple Heights, OH
Flood risk 1/10 · Minimal
- FEMA flood zone
- X (unshaded)
- Chance of flooding over 30 yrs
- 0.0%
- Est. flood insurance / yr
- $473 – $860
Fire risk 1/10 · Minimal
- Est. fire insurance / yr
- $713 – $1,323
Heat risk 3/10 · Minor
- Hot days now (above 95°F)
- 7 days/yr
- Hot days in 30 yrs
- 17 days/yr
Wind risk 1/10 · Minimal
- Chance of severe wind over 30 yrs
- —
Air-quality risk 3/10 · Minor
- Unhealthy air days now
- 2 days/yr
- Unhealthy air days in 30 yrs
- 3 days/yr
Risk factors via First Street. Map © Google.
Why this score? — see what drove the C grade
The composite is a weighted blend of 9 inputs, each scored 0–100. Each bar is that input's sub-score; the figure is the points it added to the 100-point composite (weight × sub-score).
- Cash flow +21.6/30.0
- ARV discount +10.5/15.0
- DSCR +6.9/10.0
- 1% rule +6.4/10.0
- Rent growth +5.0/5.0
- Livability +3.5/5.0
- Condition / age +2.5/5.0
- Schools +1.6/10.0
- Appreciation +0.0/10.0
$149,900
🖨 Deal sheet 📄 Offer letter ✓ Due diligence
Listing remarks MLS
Estate, this could be your diamond in the rough! The King of unfinished projects lived here. As is.
Key facts
- 5,575 sq ft lot
- Garage
- Built 1952
Property features AI
Finance
- HOA & community: Access to public transportation
Exterior
- Parking: Detached paved garage; 1-car garage
- Utilities: Public water; Public sewer
- Home design: Two-story home; Aluminum siding
- Construction: Built (per public records); Asphalt/fiberglass roof
- Exterior features: South-facing; Lot dimensions approximately 41 x 136
Interior
- Bedrooms: 2 main-level bedrooms
- Bathrooms: 1 full bathroom (main level)
- Heating & cooling: Forced air gas heating
- Interior features: Full basement; Total of 5 rooms; Property listed as fixer
Neighborhood map
What this means for you Summary
Snapshot
- This is a 3-bed/1.5-bath single-family listed at $150k.
Deal economics
- At list price, monthly cash flow is $227 ($3k/yr) — positive.
- The deal already cash-flows at list — no discount required.
- Meets the 1% rule at list price ($2k rent vs $150k).
Location & tenants
- Location reads 70/100 on livability (#470 in OH) — a middle-class / working-renter tenant base. Strengths: cost of living A+, housing A, health & safety A-; Watch: schools D+, crime D, employment D.
- Maple Heights City (suburban): math 14% / reading 25% proficiency, ranked #630 of 656 in OH (top 96%) — low school quality limits family demand, transient renter base, plan for 1-2y turnover; 78% free/reduced lunch — lower-income household profile, screen leases tightly.
- Market conditions: Rents rising fast (+14.8%/yr); 84 active listings in the ZIP; 32 comparable units currently listed for rent nearby; rentals at typical pace (median 16d on market — plan ~3-4 weeks tenant-placement turnaround); 1,441 units permitted in Cuyahoga County in 2024 (700 in 5+ unit buildings).
- This rent runs 38% of the median local income ($54k/yr) — at the standard rent-burdened threshold; future hikes will face affordability resistance.
Forward outlook
- Local home prices are declining (-3.0%/yr); year-one equity from $1k of loan paydown is wiped out by about $4k of value loss. Plan a longer hold.
- Cuyahoga County population projected to shrink 8% by 2050 — rents likely to lag national; underwrite the cash flow, not the appreciation.
- At projected returns (-3.0% appreciation + 8.0% rent growth), your $42k cash investment doubles in ~9 years — after that, you're playing with house money.
Negotiation context
- Only 1 days on market — expect competitive offers; lowballing is unlikely to land.
- 8 sale attempts since 17y ago with the ask held roughly flat each time — persistent listings suggest the price (not the market) is what's stuck; bring a comps-based counter.
- Current owner paid $80k; list at $150k implies a 87% gain — meaningful room to come down on a strong offer.
Risks & watch-outs
- Watch-outs: built in 1952 — expect roof / HVAC / electrical / plumbing capex.
Questions for the listing agent
- Built in 1952 — when were the roof, HVAC, electrical panel, plumbing, and water heater last replaced?
- Is there a deadline driving the sale (1031 exchange, divorce, estate, relocation)? That informs how much negotiation room exists.
- Schools are D-rated, which usually means shorter tenancies and higher turnover. Who's the typical renter profile here, and what's been the actual vacancy rate?
- Crime grade is D in this area — have there been break-ins, vandalism, or insurance claims at this property in the last 3 years? What carrier currently insures it and at what premium?
- What's the average days-on-market for RENTAL listings here right now (not sales)? A rising rental-DOM trend means longer vacancies and softer asking-rent achievability than the comps imply.
- What's the recent tenant-quality profile in this submarket — average credit score on applications, eviction rate, late-payment / NSF rate, and stable-employment percentage? A property-management company in the area should have these aggregated.
- How much new for-sale + rental construction is in the pipeline within 1–3 miles? Heavy new supply typically softens prices + rents 12–24 months out; constrained supply supports both.
Investment metrics
- 1% rule
- 1.14% ✓
- Cap rate
- 8.11%
- Cash-on-cash
- 6.49%
- DSCR
- 1.29
- GRM
- 7.3
CMA / ARV
- ARV (on-the-fly)
- $160,524
- Comps found
- 12
Show comp detail 12 sales within ~0.75 mi
| Address | Dist | Beds/Ba | Sqft | Sold | Price | $/sf | Match |
|---|---|---|---|---|---|---|---|
| 14413 Krems Ave | 0.35mi | 3/1.5 | 1,314 (-4%) | 3mo | $98,000 | $75 | 74 |
| 5853 Monica Ln | 0.40mi | 3/1.5 | 1,299 (-5%) | 0mo | $169,900 | $131 | 72 |
| 14708 Brunswick Ave | 0.11mi | 3/2.5 | 1,200 (-12%) | 4mo | $120,000 | $100 | 66 |
| 14619 Tokay Ave | 0.26mi | 3/1.0 | 1,230 (-10%) | 3mo | $148,500 | $121 | 66 |
| 13616 Oakview Blvd | 0.66mi | 3/2.0 | 1,414 (+3%) | 0mo | $164 | — | 62 |
| 15800 Northwood Ave | 0.41mi | 3/3.0 | 1,500 (+9%) | 2mo | $250,000 | $167 | 58 |
| 13004 Rockside Rd | 0.72mi | 3/1.0 | 1,319 (-4%) | 0mo | $154,000 | $117 | 58 |
| 13804 Rockside Rd | 0.40mi | 3/1.0 | 1,173 (-14%) | 2mo | $164,500 | $140 | 53 |
| 13741 Grove Dr | 0.57mi | 3/1.5 | 1,565 (+14%) | 3mo | $160,800 | $103 | 48 |
| 13513 York Blvd | 0.64mi | 3/1.5 | 1,170 (-15%) | 1mo | $185,900 | $159 | 45 |
| 13217 Havana Rd | 0.68mi | 3/1.0 | 1,210 (-12%) | 3mo | $132,000 | $109 | 44 |
| 15513 Walvern Blvd | 0.64mi | 4/1.0 (+1) | 1,170 (-15%) | 2mo | $97,000 | $83 | 37 |
Match score weights: distance 35% · size 25% · config 20% · recency 20%. Top-matched comps best support the ARV.
Projected returns pro-forma
-3.0% appreciation · 8.0% rent growth · sell at horizon
- IRR
- -0.4%
- Equity multiple
- 0.98×
- Total profit
- $-733
- Equity at exit
- $22,351
- IRR
- 14.1%
- Equity multiple
- 2.41×
- Total profit
- $59,325
- Equity at exit
- $12,961
Cash invested: $41,972 (down + closing). Projections, not guarantees.
Landlord ↔ Tenant lean methodology
- Overall (STATE)
- 73 Landlord-Friendly
- State Ohio
- 73 Landlord-Friendly · R+6
- County
- — inherits STATE
- City
- — inherits STATE
ZIP-level market 44137
- Home prices YoY
- -34.7%
- Rents YoY
- 14.8%
- Active inventory
- 84
- Price-to-rent
- 7.3×
Monthly cashflow live
- Estimated rent
- $1,705 high interval (Pro) →
- Mortgage (P&I)
- −$786
- Tax from tax record
- −$272 /mo · $3,258/yr
- Insurance
- −$62
- HOA
- −$0
- Vacancy / Maint / Mgmt
- −$358
- Net cashflow
- $227
Break-even live
UW: 25.0% down · 7.5% · 30yr · 1.5% tax · 5.0% vac · 8.0% maint · 8.0% mgmt
Financing live
Cash to close
- Down payment
- $37,475
- Closing costs
- $4,497
- Reserves months
- —
- Total cash needed
- —
Loan-product check · same deal, 3 products live
Conventional
25% down · 7.5% · 30yr
- Down + closing
- —
- Monthly P&I
- —
- Monthly cashflow
- —
- DSCR
- —
- Eligible?
- —
Personal DTI + credit; lowest rate.
DSCR
20% down · 8.5% · 30yr
- Down + closing
- —
- Monthly P&I
- —
- Monthly cashflow
- —
- DSCR
- —
- Eligible?
- —
No personal income docs; deal must DSCR.
Hard money
10% down · 12.0% · 12mo
- Down + closing
- —
- Monthly P&I
- —
- Monthly cashflow
- —
- DSCR
- —
- Eligible?
- —
Short-term bridge; refi at stabilization.
Rent comps 32 comps
| Address | Beds | Baths | Sqft | Rent | $/sqft | DOM | Units | Dist |
|---|---|---|---|---|---|---|---|---|
| 14509 Rockside Rd Maple Heights, OH | 3.0 | 2.0 | 1430 | $2,300 | $1.61 | 1d | 1 | 0.12mi |
| 14519 Tokay Ave Maple Heights, OH | 3.0 | 1.0 | 1230 | $1,325 | $1.08 | 43d | 1 | 0.30mi |
| 15312 Ramage Ave Maple Heights, OH | 3.0 | 1.0 | 1060 | $1,595 | $1.50 | 43d | 1 | 0.31mi |
| 14100 Brunswick Ave Maple Heights, OH | 3.0 | 1.0 | 1157 | $1,475 | $1.27 | 43d | 1 | 0.33mi |
| 16011 Maplewood Ave Maple Heights, OH | 3.0 | 1.0 | 1070 | $1,300 | $1.21 | 43d | 1 | 0.48mi |
| 14205 Corridon Ave Maple Heights, OH | 4.0 | 1.5 | 1236 | $1,650 | $1.33 | 23d | 1 | 0.57mi |
| 16224 Maplewood Ct Maple Heights, OH | 2.0 | 1.0 | 926 | $1,550 | $1.67 | 16d | 1 | 0.59mi |
| 13776 Shady Oak Blvd Cleveland, OH | 4.0 | 1.0 | 1170 | $1,600 | $1.37 | 14d | 1 | 0.74mi |
| 12808 Havana Rd Cleveland, OH | 3.0 | 1.0 | 1056 | $1,350 | $1.28 | 16d | 1 | 0.86mi |
| 5973 Turney Rd Cleveland, OH | 3.0 | 1.5 | 1159 | $1,425 | $1.23 | 23d | 1 | 0.86mi |
| 15414 Corkhill Rd Maple Heights, OH | 3.0 | 1.0 | 1508 | $1,250 | $0.83 | 7d | 1 | 0.87mi |
| 12918 Eastwood Blvd Cleveland, OH | 4.0 | 1.0 | 1170 | $1,295 | $1.11 | 16d | 1 | 0.89mi |
| 5627 Jefferson Ave Maple Heights, OH | 3.0 | 1.0 | 1136 | $1,250 | $1.10 | 7d | 1 | 0.91mi |
| 681 Turney Rd Bedford, OH | 1.0–2.0 | 1.0–1.5 | 795 | $1,500 | $1.89 | 19d | 13 | 0.98mi |
| 681 Turney Rd Bedford, OH | 2.0 | 1.0 | 1030 | $1,500 | $1.46 | 3d | 1 | 0.98mi |
| 5270 Beech Ave Maple Heights, OH | 3.0 | 1.0 | 1401 | $1,350 | $0.96 | 16d | 1 | 1.10mi |
| 5554 Dalewood Ave Maple Heights, OH | 3.0 | 1.0 | 1150 | $1,500 | $1.30 | 11d | 1 | 1.11mi |
| 5508 Grasmere Ave Maple Heights, OH | 3.0 | 2.0 | 1834 | $1,710 | $0.93 | 43d | 1 | 1.15mi |
| 12211 Woodward Blvd Cleveland, OH | 4.0 | 2.0 | 1236 | $1,500 | $1.21 | 10d | 1 | 1.18mi |
| 12214 Shady Oak Blvd Cleveland, OH | 3.0 | 1.0 | 900 | $1,350 | $1.50 | 23d | 1 | 1.19mi |
| 16914 Maple Heights Blvd Maple Heights, OH | 3.0 | 1.0 | 1212 | $1,425 | $1.18 | 10d | 1 | 1.21mi |
| 5713 South Blvd Maple Heights, OH | 3.0 | 1.0 | 1700 | $2,300 | $1.35 | 1d | 1 | 1.21mi |
| 5461 Clement Ave Maple Heights, OH | 3.0 | 1.5 | 1260 | $1,350 | $1.07 | 20d | 1 | 1.22mi |
| 5461 Clement Ave Maple Heights, OH | 3.0 | 1.5 | 1260 | $1,350 | $1.07 | 16d | 1 | 1.23mi |
| 5223 Paine Ave Maple Heights, OH | 4.0 | 1.0 | 1344 | $1,650 | $1.23 | 1d | 1 | 1.23mi |
| 17204 Mapleboro Ave Maple Heights, OH | 3.0 | 1.0 | 1074 | $1,475 | $1.37 | 43d | 1 | 1.24mi |
| 17206 Mapleboro Ave Maple Heights, OH | 3.0 | 1.0 | 1020 | $1,325 | $1.30 | 23d | 1 | 1.24mi |
| 5283 E 133rd St Cleveland, OH | 3.0 | 2.0 | 1176 | $1,495 | $1.27 | 16d | 1 | 1.28mi |
| 5225 Theodore St Maple Heights, OH | 3.0 | 1.0 | 1785 | $1,450 | $0.81 | 4d | 1 | 1.38mi |
| 601 W Glendale St Bedford, OH | 3.0 | 1.0 | 944 | $1,197 | $1.27 | 16d | 1 | 1.38mi |
| 5074 Miller Ave Maple Heights, OH | 3.0 | 1.0 | 962 | $1,400 | $1.46 | 43d | 1 | 1.42mi |
| 15913 Grant Ave Maple Heights, OH | 3.0 | 1.5 | 1400 | $1,390 | $0.99 | 16d | 1 | 1.48mi |
Listing history 2 events
-
2026-06-18remarks 410-char remark
-
2026-06-18$149,900 Active 1 DOM
ⓘ Source: listings_history table (triggers on properties + properties_extension) + one-shot
backfill from property_details.listing_events for pre-trigger history.
Tax reassessment forecast OH · Partial reset (capped growth)
- Current annual tax
- $3,258 · $272/mo
- Projected year-2 tax
- $3,258 · $272/mo
- Expected delta
- $0/yr ($0/mo · 0.0%)
ⓘ Screening estimate from a state-policy table — verify with the county assessor before closing.
Climate risk First Street
- Flood 1/10 Low FEMA zone X (unshaded) · 0% chance over 30 yrs
- Wildfire 1/10 Low
- Heat 3/10 Moderate 7 d/yr ≥95°F today · 17 d/yr by 30 yrs out
- Wind 1/10 Low
- Air quality 3/10 Moderate 2 unhealthy d/yr today · 3 by 30 yrs out
Nearby sold comps map
Loading sold comps map…
Walkable amenities ~0.75 mi
Loading nearby amenities…
Taxation est. · year 1
- Rental income
- $20,464
- − Mortgage interest
- −$8,397
- − Property taxes
- −$3,258
- − Insurance
- −$750
- − Repairs & maintenance
- −$1,637
- − Management
- −$1,637
- − Depreciation
- −$4,361
- Taxable income
- $425
- Est. tax owed @ 24.0%
- −$102
- After-tax cash flow
- $2,624/yr
For passive investors: Depreciation is non-cash, so a rental often shows a tax loss while cash-flowing — sheltering income. Rental losses are passive: they offset passive income freely, and up to $25,000/yr can offset ordinary (W-2) income if you actively participate and your MAGI is under $100k (phasing out to $0 by $150k); unused losses carry forward. On sale, claimed depreciation is recaptured at up to 25%, and gains may owe capital-gains tax (a 1031 exchange can defer both). Figures are a year-1 estimate at your 24.0% rate — not tax advice; consult a CPA.
Schools (NCES district)
- District
- Maple Heights City
- NCES district ID
- 3904430
- Math proficiency
- 14% ▼ -22.00%
- Reading proficiency
- 25% ▼ -11.00%
- Median HH income
- $38,856
- Composite
- 16.39/100
- National rank
- #9197
- State rank
- #630 of 656 in OH
Livability — Maple Heights
- Score
- 70/100
- State rank
- #470
- US rank
- #7818
Category grades
Schools grade is shown separately in the Schools card above.
Census & demographics
- Census place
- Maple Heights, OH
- County
- Cuyahoga County · 1,090,369 people
- City population
- 23,285
- Metro
- Cleveland-Elyria, OH
- Population (ZIP)
- 23,285
- Household income
- $53,918
- Rent vs Own
- Severe rent burden
- 971.0
Population outlook (Cuyahoga County) Hauer SSP2
- Today (2025)
- 1,244,621 people
- By 2030
- 1,230,093 · -1.2%
- By 2040
- 1,189,108 · -4.5%
- By 2050
- 1,145,706 · -7.9%
- By 2075
- 1,076,557 · -13.5%
- By 2100
- 978,987 · -21.3%
Race, ethnicity, and origin ACS 2023
- Neighborhood character
- Predominantly Black (74%)
- Race & ethnicity
- Black 74% White 20% Two or more races 4% Hispanic / Latino 2%
- Common ancestry
- Romanian 3% Scotch-Irish 2%
- Foreign-born
- 2% · Canada, China
- Languages at home
- 98% English-only · Spanish 1%
Political lean MEDSL · Cuyahoga
- 2024 margin
- Solid D (+31.5) · D 65.4% · R 33.9%
- 2008→2024 swing
- -7.4pp toward R · 2008: 38.9pp · 2024: 31.5pp
- All cycles
- 2024: D+31.5 2020: D+34.1 2016: D+35.0 2012: D+38.7 2008: D+38.9
Not yet ingested
- Civics
- —
Market trends
- HPI YoY
- ▼ -87.37%
- Current HPI
- 164.4326
- Rent YoY
- ▲ 14.82%
- Metro
- Cleveland-Elyria, OH
- State GDP YoY
- ▲ 1.98%
- F500 in state
- 48
Industry mix (Fortune 500 HQ in OH)
| Industry | F500 HQs | Revenue |
|---|---|---|
| Insurance | 3 | $145B |
|
||
| Industrial Machinery | 3 | $49B |
|
||
| Financial Services | 3 | $24B |
|
||
| Consumer Goods | 2 | $93B |
|
||
| Aerospace / Defense | 2 | $47B |
|
||
| Utilities | 2 | $33B |
|
||
Price history
+244.6% since first listed21 events — show timeline
- 2026-06-18 Listed $149,900 MLSNOW
- 2022-01-17 Price Changed $1,350 RENT.
- 2021-08-25 Sold (Public Records) $80,000 Public Records
- 2016-11-23 Sold (MLS) $24,500 MLSNOW
- 2016-11-07 Contingent — MLSNOW
- 2016-08-17 Price Changed $35,000 MLSNOW
- 2016-07-05 Price Changed $42,000 MLSNOW
- 2016-06-09 Listed $49,900 MLSNOW
- 2013-12-31 Listing Removed — MLSNOW
- 2013-06-29 Listed $42,900 MLSNOW
- 2012-06-30 Listing Removed — MLSNOW
- 2012-02-02 Listed $24,900 MLSNOW
- 2011-06-03 Listing Removed — MLSNOW
- 2010-08-25 Listed $29,000 MLSNOW
- 2010-08-23 Listing Removed — MLSNOW
- 2010-02-23 Listed $54,000 MLSNOW
- 2010-01-31 Listing Removed — MLSNOW
- 2009-10-29 Listed $59,900 MLSNOW
- 2009-09-30 Listing Removed — MLSNOW
- 2009-07-14 Listed $69,900 MLSNOW
- 1977-11-01 Sold (Public Records) $43,500 Public Records
Property tax history
+5.5%/yrLatest (2025): $3,258 · -10.2% YoY. Source: county tax records.
Cash-flow waterfall
monthlySold comps — $/sqft
last 12 mo · ≤1 miLoading sold comps…