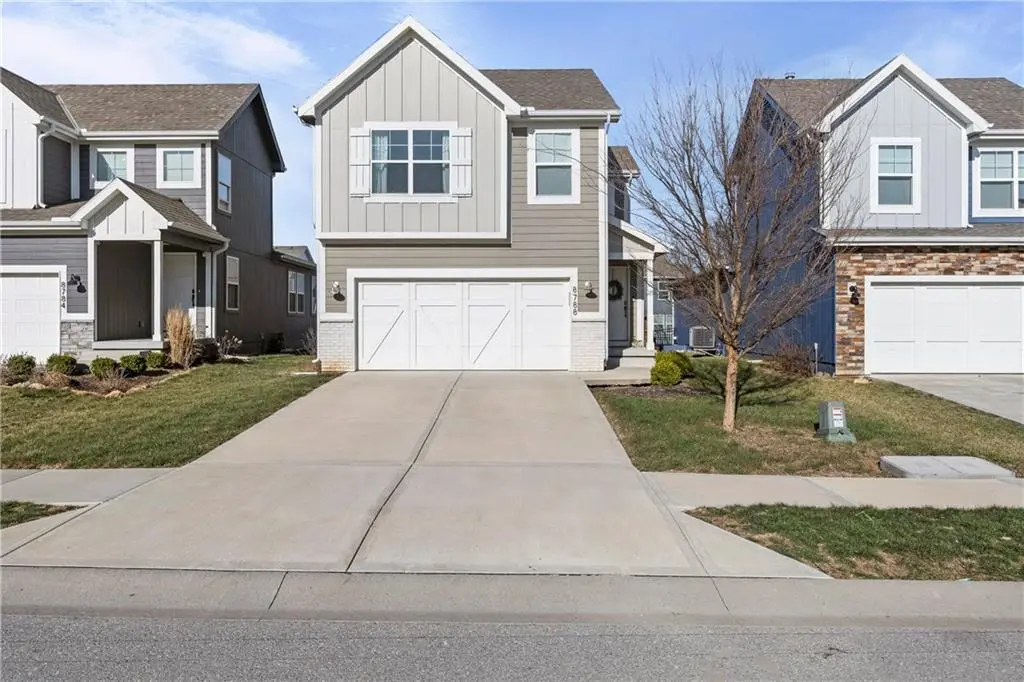
8788 SW 9th St · Blue Springs, MO
Flood risk 1/10 · Minimal
- FEMA flood zone
- X (unshaded)
- Chance of flooding over 30 yrs
- 0.0%
- Est. flood insurance / yr
- $473 – $860
Fire risk 2/10 · Minimal
- Est. fire insurance / yr
- $1,054 – $1,958
Heat risk 4/10 · Minor
- Hot days now (above 107°F)
- 7 days/yr
- Hot days in 30 yrs
- 16 days/yr
Wind risk 2/10 · Minimal
- Chance of severe wind over 30 yrs
- —
Air-quality risk 4/10 · Minor
- Unhealthy air days now
- 5 days/yr
- Unhealthy air days in 30 yrs
- 5 days/yr
Risk factors via First Street. Map © Google.
Why this score? — see what drove the D- grade
The composite is a weighted blend of 9 inputs, each scored 0–100. Each bar is that input's sub-score; the figure is the points it added to the 100-point composite (weight × sub-score).
- ARV discount +13.1/15.0
- Cash flow +7.2/30.0
- Schools +4.6/10.0
- Livability +4.1/5.0
- Rent growth +3.8/5.0
- 1% rule +2.5/10.0
- Condition / age +2.5/5.0
- DSCR +1.3/10.0
- Appreciation +0.0/10.0
$339,000
🖨 Deal sheet 📄 Offer letter ✓ Due diligence
Listing remarks
New Price, Same Great Home!! Nearly new, this 5-year-old Honeydew with a 10-year transferable warranty offers modern design and move-in-ready convenience. The open-concept main level features abundant natural light, a welcoming great room and an entertainer’s kitchen with a large island, upgraded appliances and dining space. Upstairs, the primary suite includes a spa-inspired bath with double vanity, walk-in shower and a spacious closet. Additional features include a whole-home humidifier, water softener and 200-amp electrical service, plus a metal fence and an outdoor patio with metal gate perfect for entertaining. The unfinished basement includes an egress window, sump pump and is s
Key facts
- Water softener
- Spa-inspired bath
- 4,510 sq ft lot
Tags
Property features AI
Finance
- Other: Builder: Clover & Hive; Model: Honeydew; Above-grade living area reported by builder; Age: 3–5 years; 10-year warranty
- HOA & community: Part of Edgewater at Chapman Farms HOA; Annual HOA dues; Community pool; Play area
Exterior
- Parking: Attached parking; Off-street parking; 2-car garage
- Utilities: Public water; Public sewer; Fiber available; Electric air cleaner
- Home design: Single-family residence; 2 stories; Residential property
- Construction: Lap siding with stone trim; Composition roof; Full unfinished basement (stubbed for bath)
- Exterior features: Patio; Metal fencing; City limits lot; Paved road access
Interior
- Kitchen: Dishwasher; Disposal; Microwave; Refrigerator; Electric range
- Bedrooms: 4 bedrooms
- Bathrooms: 2 full baths; 1 half bath
- Heating & cooling: Natural gas heating; Electric cooling
- Interior features: Smart thermostat; Entry; Eat-in kitchen
- Laundry & utility: Washer; Dryer; Laundry on bedroom level; Humidifier; Water softener; Sump pump
Neighborhood map
What this means for you Summary
Snapshot
- This is a 4-bed/2.5-bath single-family listed at $339k.
Deal economics
- At list price, monthly cash flow is $-474 ($-6k/yr) — negative.
- To cash-flow at today's rent, offer at most $255k (24.7% below list).
- To meet the 1% rule (rent ≥ 1% of price), the offer needs to be $255k (24.8% below list).
- Recommended offer: $255k (24.8% below list) — sets the bar for 1% rule.
- Cap rate 4.6% vs local median 3.2% in Blue Springs — top-decile yield for the area; either an underpriced asset or a hidden risk that comps aren't pricing in. Stress-test before assuming the spread holds.
Location & tenants
- Location reads 82/100 on livability (#11 in MO, #1,297 nationally) — a professional / high-income tenant draw. Strengths: cost of living A+, housing A+, health & safety A+; Watch: commute F.
- Lee'S Summit R-VII (suburban): math 46% / reading 55% proficiency, ranked #23 of 324 in MO (top 7%) — acceptable for families but not a draw, mixed tenant base, ~2y average lease; only 16% free/reduced lunch — higher-income household profile.
- Zoned schools: Lee'S Summit North High (math 41% / reading 69%, grade C, #65 of 521 statewide, top 13%, 2,007 students, 22% FRL).
- Market conditions: Rents rising fast (+5.1%/yr); 231 active listings in the ZIP; 14 comparable units currently listed for rent nearby; rentals leasing fast (median 8d on market — plan ~1-2 weeks tenant-placement turnaround); high-income renter base; 4,002 units permitted in Jackson County in 2024 (2,271 in 5+ unit buildings).
Forward outlook
- Local home prices are declining (-3.0%/yr); year-one equity from $2k of loan paydown is wiped out by about $10k of value loss. Plan a longer hold.
- Jackson County population projected at +4% by 2050 — modest demand growth; plan on rents tracking national, not racing it.
Negotiation context
- It's been on market 56 days — a 3% lower offer ($329k) is reasonable based on typical stale-listing flexibility.
- 2 sale attempts since 5y ago; this cycle's ask has dropped $20k (6%) from the opening price — seller is motivated, your offer sets the floor, not the list.
Questions for the listing agent
- What do current leases actually rent for vs. the listed asking? Can we see a recent rent roll and the last 12 months of T-12 income?
- It's been on market 56 days. Have you received any prior offers? Is the seller open to a 25% concession, seller financing, or rate buy-down credit?
- What does the HOA fee cover, when was the last increase, and are there any pending special assessments or reserve-fund shortfalls?
- Is there a deadline driving the sale (1031 exchange, divorce, estate, relocation)? That informs how much negotiation room exists.
- Schools are A-rated — typically a magnet for longer-tenancy family renters. What's the average tenant stay here, and is there a school-zone premium baked into asking?
- The area grade is low — what's the realistic commute time and amenity access for the typical tenant pool here? Any planned neighborhood developments (good or bad) we should know about?
- What's the average days-on-market for RENTAL listings here right now (not sales)? A rising rental-DOM trend means longer vacancies and softer asking-rent achievability than the comps imply.
- What's the recent tenant-quality profile in this submarket — average credit score on applications, eviction rate, late-payment / NSF rate, and stable-employment percentage? A property-management company in the area should have these aggregated.
- How much new for-sale + rental construction is in the pipeline within 1–3 miles? Heavy new supply typically softens prices + rents 12–24 months out; constrained supply supports both.
Investment metrics
- 1% rule
- 0.75% ✗
- Cap rate
- 4.61%
- Cash-on-cash
- -6.00%
- DSCR
- 0.73
- GRM
- 11.1
CMA / ARV
- ARV (median comp)
- $386,839
- List price
- $339,000
- Delta
- -12.37%
- Verdict
- UNDERPRICED
- Comps
- 20 within 1.0 mi
Show comp detail 12 sales within ~0.75 mi
| Address | Dist | Beds/Ba | Sqft | Sold | Price | $/sf | Match |
|---|---|---|---|---|---|---|---|
| 8802 SW 10th St | 0.09mi | 4/2.5 | 1,857 (0%) | 0mo | $342,170 | $184 | 96 |
| 8724 SW Edgewater Dr | 0.11mi | 4/2.5 | 1,857 (0%) | 1mo | $342,974 | $185 | 94 |
| 8753 SW Brickell Dr | 0.11mi | 4/2.5 | 1,857 (0%) | 1mo | $344,974 | $186 | 94 |
| 8749 SW Brickell Dr | 0.12mi | 4/2.5 | 1,857 (0%) | 1mo | $333,333 | $180 | 94 |
| 8765 SW 10th St | 0.13mi | 4/2.5 | 1,857 (0%) | 1mo | $351,970 | $190 | 93 |
| 8786 SW 10th St | 0.09mi | 4/2.5 | 1,681 (-10%) | 0mo | $329,300 | $196 | 80 |
| 8720 SW Edgewater Dr | 0.12mi | 4/2.5 | 1,681 (-10%) | 1mo | $330,043 | $196 | 78 |
| 8712 SW Edgewater Dr | 0.13mi | 4/2.5 | 1,681 (-10%) | 0mo | $319,800 | $190 | 78 |
| 8761 SW 10th St | 0.13mi | 4/2.5 | 1,681 (-10%) | 1mo | $345,123 | $205 | 78 |
| 8745 SW Brickell Dr | 0.13mi | 4/2.5 | 1,681 (-10%) | 1mo | $333,843 | $199 | 78 |
| 8769 SW 10th St | 0.13mi | 4/2.5 | 1,681 (-10%) | 1mo | $330,843 | $197 | 78 |
| 413 SW Redbud Ct | 0.68mi | 3/2.0 (-1) | 1,690 (-9%) | 1mo | $382,407 | $226 | 46 |
Match score weights: distance 35% · size 25% · config 20% · recency 20%. Top-matched comps best support the ARV.
Projected returns pro-forma
-3.0% appreciation · 5.14% rent growth · sell at horizon
- IRR
- -24.0%
- Equity multiple
- 0.16×
- Total profit
- $-79,414
- Equity at exit
- $50,546
- IRR
- -13.9%
- Equity multiple
- 0.12×
- Total profit
- $-83,514
- Equity at exit
- $29,311
Cash invested: $94,920 (down + closing). Projections, not guarantees.
Landlord ↔ Tenant lean methodology
- Overall (STATE)
- 81 Strongly Landlord-Friendly
- State Missouri
- 81 Strongly Landlord-Friendly · R+10
- County
- — inherits STATE
- City
- — inherits STATE
ZIP-level market 64064
- Rents YoY
- 5.1%
- Active inventory
- 231
- Price-to-rent
- 11.1×
Monthly cashflow live
- Estimated rent
- $2,548 high interval (Pro) →
- Mortgage (P&I)
- −$1,778
- Tax from tax record
- −$495 /mo · $5,943/yr
- Insurance
- −$141
- HOA
- −$73
- Vacancy / Maint / Mgmt
- −$535
- Net cashflow
- $-474
Break-even live
UW: 25.0% down · 7.5% · 30yr · 1.5% tax · 5.0% vac · 8.0% maint · 8.0% mgmt
Financing live
Cash to close
- Down payment
- $84,750
- Closing costs
- $10,170
- Reserves months
- —
- Total cash needed
- —
Loan-product check · same deal, 3 products live
Conventional
25% down · 7.5% · 30yr
- Down + closing
- —
- Monthly P&I
- —
- Monthly cashflow
- —
- DSCR
- —
- Eligible?
- —
Personal DTI + credit; lowest rate.
DSCR
20% down · 8.5% · 30yr
- Down + closing
- —
- Monthly P&I
- —
- Monthly cashflow
- —
- DSCR
- —
- Eligible?
- —
No personal income docs; deal must DSCR.
Hard money
10% down · 12.0% · 12mo
- Down + closing
- —
- Monthly P&I
- —
- Monthly cashflow
- —
- DSCR
- —
- Eligible?
- —
Short-term bridge; refi at stabilization.
Rent comps 14 comps
| Address | Beds | Baths | Sqft | Rent | $/sqft | DOM | Units | Dist |
|---|---|---|---|---|---|---|---|---|
| 8724 SW Edgewater Dr Lees Summit, MO | 4.0 | 3.0 | 1857 | $2,700 | $1.45 | 1d | 1 | 0.12mi |
| 8753 SW Brickell Dr Lees Summit, MO | 4.0 | 3.0 | 1857 | $2,700 | $1.45 | 10d | 1 | 0.13mi |
| 8789 SW 10th St Blue Springs, MO | 4.0 | 2.5 | 1700 | $2,650 | $1.56 | 3d | 1 | 0.13mi |
| 8749 SW Brickell Dr Lees Summit, MO | 4.0 | 3.0 | 1681 | $2,650 | $1.58 | 7d | 1 | 0.14mi |
| 9103 SW 2nd St Lee's Summit, MO | 4.0 | 2.5 | 2113 | $2,700 | $1.28 | 43d | 1 | 0.52mi |
| 118 SW Rock Garden Ln Unit 122 Blue Springs, MO | 3.0 | 2.0 | 1250 | $1,750 | $1.40 | 44d | 1 | 0.87mi |
| 209 SW Marigold St Blue Springs, MO | 3.0 | 2.5 | 1580 | $1,865 | $1.18 | 43d | 1 | 0.90mi |
| 9416 SE 2nd St Unit 9416 2nd Blue Springs, MO | 3.0 | 2.0 | 1300 | $1,695 | $1.30 | 3d | 1 | 0.94mi |
| 8119 SW 3rd St Blue Springs, MO | 3.0 | 2.0 | 1253 | $1,695 | $1.35 | 43d | 1 | 0.98mi |
| 102 SW Lily St Blue Springs, MO | 3.0 | 2.5 | 1480 | $1,840 | $1.24 | 1d | 1 | 1.00mi |
| 203 SW Lily St Blue Springs, MO | 3.0 | 2.0 | 1253 | $1,675 | $1.34 | 1d | 1 | 1.00mi |
| 8107 SW 3rd St Blue Springs, MO | 3.0 | 2.0 | 1253 | $1,640 | $1.31 | 21d | 1 | 1.01mi |
| 200 SW Laurel Dr Blue Springs, MO | 3.0 | 2.0 | 1250 | $1,995 | $1.60 | 1d | 1 | 1.04mi |
| 236 SW Little Garden Ln Blue Springs, MO | 2.0–4.0 | 2.5–3.5 | 1668 | $2,635 | $1.58 | 1d | 8 | 1.08mi |
HOA detail
- Monthly dues
- $73 · $876/yr
- Likely covers
- waterelectric
Listing history 20 events
-
2026-06-18days on market $339,000 Active 56 DOM
-
2026-06-17days on market $339,000 Active 55 DOM
-
2026-06-16days on market $339,000 Active 54 DOM
-
2026-06-15days on market $339,000 Active 53 DOM
-
2026-06-13days on market $339,000 Active 51 DOM
-
2026-06-13days on market $339,000 Active 50 DOM
-
2026-06-09days on market $339,000 Active 47 DOM
-
2026-06-08days on market $339,000 Active 46 DOM
-
2026-06-07days on market $339,000 Active 45 DOM
-
2026-06-05days on market $339,000 Active 42 DOM
-
2026-06-03days on market $339,000 Active 41 DOM
-
2026-06-02days on market $339,000 Active 40 DOM
-
2026-06-01days on market $339,000 Active 39 DOM
-
2026-05-31days on market $339,000 Active 38 DOM
-
2026-05-17price $339,000 1087-char remark
-
2026-05-08price $349,000 1087-char remark
-
2026-04-23$359,000 Active 1087-char remark
-
2021-10-04soldstatus Closed
-
2021-05-24$294,625
-
2021-05-24historical
ⓘ Source: listings_history table (triggers on properties + properties_extension) + one-shot
backfill from property_details.listing_events for pre-trigger history.
Tax reassessment forecast MO · Resets to sale price
- Current annual tax
- $5,943 · $495/mo
- Projected year-2 tax
- $5,943 · $495/mo
- Expected delta
- $0/yr ($0/mo · 0.0%)
ⓘ Screening estimate from a state-policy table — verify with the county assessor before closing.
Climate risk First Street
- Flood 1/10 Low FEMA zone X (unshaded) · 0% chance over 30 yrs
- Wildfire 2/10 Low
- Heat 4/10 Moderate 7 d/yr ≥107°F today · 16 d/yr by 30 yrs out
- Wind 2/10 Low
- Air quality 4/10 Moderate 5 unhealthy d/yr today · 5 by 30 yrs out
Nearby sold comps map
Loading sold comps map…
Walkable amenities ~0.75 mi
Loading nearby amenities…
Taxation est. · year 1
- Rental income
- $30,576
- − Mortgage interest
- −$18,989
- − Property taxes
- −$5,943
- − Insurance
- −$1,695
- − Repairs & maintenance
- −$2,446
- − Management
- −$2,446
- − HOA
- −$876
- − Depreciation
- −$9,862
- Taxable loss
- −$11,681
- Est. tax savings @ 24.0%
- +$2,804
- After-tax cash flow
- $-2,889/yr
For passive investors: Depreciation is non-cash, so a rental often shows a tax loss while cash-flowing — sheltering income. Rental losses are passive: they offset passive income freely, and up to $25,000/yr can offset ordinary (W-2) income if you actively participate and your MAGI is under $100k (phasing out to $0 by $150k); unused losses carry forward. On sale, claimed depreciation is recaptured at up to 25%, and gains may owe capital-gains tax (a 1031 exchange can defer both). Figures are a year-1 estimate at your 24.0% rate — not tax advice; consult a CPA.
Schools (NCES district)
- District
- Lee'S Summit R-VII
- NCES district ID
- 2918300
- Math proficiency
- 46% ▼ -12.00%
- Reading proficiency
- 55% ▼ -6.00%
- Median HH income
- $77,031
- Composite
- 45.75/100
- National rank
- #2570
- State rank
- #23 of 324 in MO
Livability — Blue Springs
- Score
- 82/100
- State rank
- #11
- US rank
- #1297
Category grades
Schools grade is shown separately in the Schools card above.
Census & demographics
- Census place
- Blue Springs, MO
- County
- Jackson County · 687,798 people
- City population
- 61,033
- Metro
- Kansas City, MO-KS
- Population (ZIP)
- 20,050
- Household income
- $117,674
- Rent vs Own
- Severe rent burden
- 124.0
Population outlook (Jackson County) Hauer SSP2
- Today (2025)
- 719,589 people
- By 2030
- 731,456 · +1.6%
- By 2040
- 746,689 · +3.8%
- By 2050
- 749,289 · +4.1%
- By 2075
- 736,227 · +2.3%
- By 2100
- 668,210 · -7.1%
Race, ethnicity, and origin ACS 2023
- Neighborhood character
- Predominantly White (80%)
- Race & ethnicity
- White 80% Black 10% Two or more races 5% Hispanic / Latino 4% Asian 2%
- Common ancestry
- Italian 8% Lithuanian 3% Slovak 2%
- Foreign-born
- 3% · Canada, Vietnam
- Languages at home
- 95% English-only · Spanish 2% Tagalog/Filipino 1% Other Indo-European 1%
Political lean MEDSL · Jackson
- 2024 margin
- D (+19.3) · D 58.9% · R 39.5% · Other 1.6%
- 2008→2024 swing
- -6.1pp toward R · 2008: 25.4pp · 2024: 19.3pp
- All cycles
- 2024: D+19.3 2020: D+22.0 2016: D+16.6 2012: D+19.0 2008: D+25.4
Not yet ingested
- Civics
- —
Market trends
- HPI YoY
- ▼ -178.97%
- Current HPI
- 230.5222
- Rent YoY
- ▲ 5.14%
- Metro
- Kansas City, MO-KS
- State GDP YoY
- ▲ 1.84%
- F500 in state
- 20
Industry mix (Fortune 500 HQ in MO)
| Industry | F500 HQs | Revenue |
|---|---|---|
| Healthcare | 1 | $163B |
|
||
| Insurance | 1 | $21B |
|
||
| Industrial Technology | 1 | $17B |
|
||
| Retail | 1 | $16B |
|
||
| Industrial Distribution | 1 | $10B |
|
||
| Utilities | 1 | $9B |
|
||
Price history
+15.1% since first listed6 events — show timeline
- 2026-05-17 Price Changed $339,000 Heartland MLS as Distributed by MLS Grid
- 2026-05-08 Price Changed $349,000 Heartland MLS as Distributed by MLS Grid
- 2026-04-23 Listed $359,000 Heartland MLS as Distributed by MLS Grid
- 2021-10-04 Sold (MLS) — Heartland MLS as Distributed by MLS Grid
- 2021-05-24 Listing Removed — Heartland MLS as Distributed by MLS Grid
- 2021-05-24 Listed $294,625 Heartland MLS as Distributed by MLS Grid
Property tax history
+67.7%/yrLatest (2025): $5,943 · +40.1% YoY. Source: county tax records.
Cash-flow waterfall
monthlySold comps — $/sqft
last 12 mo · ≤1 miLoading sold comps…