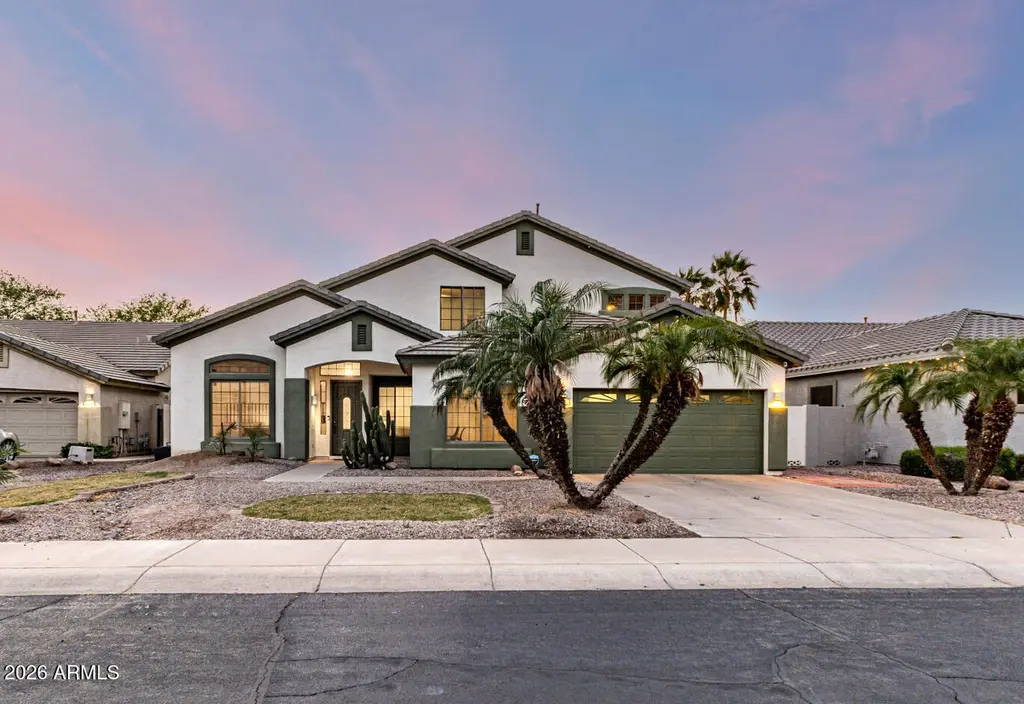
2326 S Porter St · Gilbert, AZ
Flood risk 1/10 · Minimal
- FEMA flood zone
- X (shaded)
- Chance of flooding over 30 yrs
- 0.0%
- Est. flood insurance / yr
- $507 – $1,088
Fire risk 1/10 · Minimal
- Est. fire insurance / yr
- $610 – $1,132
Heat risk 9/10 · Severe
- Hot days now (above 111°F)
- 7 days/yr
- Hot days in 30 yrs
- 19 days/yr
Wind risk 1/10 · Minimal
- Chance of severe wind over 30 yrs
- —
Air-quality risk 2/10 · Minimal
- Unhealthy air days now
- 0 days/yr
- Unhealthy air days in 30 yrs
- 1 days/yr
Risk factors via First Street. Map © Google.
Why this score? — see what drove the D- grade
The composite is a weighted blend of 9 inputs, each scored 0–100. Each bar is that input's sub-score; the figure is the points it added to the 100-point composite (weight × sub-score).
- ARV discount +15.0/15.0
- Cash flow +7.4/30.0
- Schools +4.6/10.0
- Livability +4.4/5.0
- Condition / age +2.5/5.0
- Rent growth +2.4/5.0
- DSCR +1.5/10.0
- 1% rule +1.1/10.0
- Appreciation +0.0/10.0
$680,000
🖨 Deal sheet 📄 Offer letter ✓ Due diligence
Listing remarks MLS
Located in the highly sought-after Lindsay Estates, this popular Engle floorplan offers exceptional space and functionality. Open and bright with soaring vaulted ceilings, this 6-bedroom, 3-bath home plus formal living and dining areas. The open kitchen transitions into the extended family room just a few steps below, maintaining an airy, connected feel while offering a cozy, defined gathering space. All five bedrooms are generously oversized with walk-in closets. New HVAC systems installed in 2024. New carpet throughout. Ideally located between Downtown Gilbert and San Tan Village with convenient access to shopping, dining, entertainment, and Loop 202. Located within the A+ rated Gilbert Public School District, this home offers outstanding space, location, and lifestyle.
Key facts
- Engle floorplan
- Formal living areas
- Bonus room
Tags
Neighborhood map
What this means for you Summary
Snapshot
- This is a 6-bed/4.0-bath single-family listed at $680k.
Deal economics
- At list price, monthly cash flow is $-875 ($-10k/yr) — negative.
- To cash-flow at today's rent, offer at most $525k (22.7% below list).
- To meet the 1% rule (rent ≥ 1% of price), the offer needs to be $414k (39.1% below list).
- Recommended offer: $414k (39.1% below list) — sets the bar for 1% rule.
- Cap rate 4.7% vs local median 3.2% in Gilbert — top-decile yield for the area; either an underpriced asset or a hidden risk that comps aren't pricing in. Stress-test before assuming the spread holds.
Location & tenants
- Location reads 87/100 on livability (#1 in AZ, #240 nationally) — a professional / high-income tenant draw. Strengths: schools A+, amenities A+, employment A+; Watch: health & safety C-, cost of living F.
- Gilbert Unified District (4239) (suburban): math 49% / reading 52% proficiency, ranked #38 of 249 in AZ (top 15%) — acceptable for families but not a draw, mixed tenant base, ~2y average lease; only 14% free/reduced lunch — higher-income household profile.
- Market conditions: Rents soft (-0.4%/yr); 225 active listings in the ZIP; 2 comparable units currently listed for rent nearby; high-income renter base; 36,011 units permitted in Maricopa County in 2024 (12,801 in 5+ unit buildings).
- This rent runs 42% of the median local income ($118k/yr) — at the standard rent-burdened threshold; future hikes will face affordability resistance.
Forward outlook
- Local home prices are declining (-3.0%/yr); year-one equity from $5k of loan paydown is wiped out by about $20k of value loss. Plan a longer hold.
- Maricopa County population projected at +38% by 2050 — long-run rental-demand tailwind backs the buy-and-hold thesis.
Negotiation context
- It's been on market 101 days — a 9% lower offer ($619k) is reasonable based on typical stale-listing flexibility.
Risks & watch-outs
- Climate carrying-cost: extreme-heat days projected 7→19/yr by 2055 (HVAC capex compounding) — expect insurance premiums to compound above CPI over the hold.
Questions for the listing agent
- What do current leases actually rent for vs. the listed asking? Can we see a recent rent roll and the last 12 months of T-12 income?
- It's been on market 101 days. Have you received any prior offers? Is the seller open to a 39% concession, seller financing, or rate buy-down credit?
- What does the HOA fee cover, when was the last increase, and are there any pending special assessments or reserve-fund shortfalls?
- Why hasn't it sold? Are there any deal-killer items the seller is aware of (foundation, flood, title, zoning, code violations)?
- Is there a deadline driving the sale (1031 exchange, divorce, estate, relocation)? That informs how much negotiation room exists.
- Schools are A-rated — typically a magnet for longer-tenancy family renters. What's the average tenant stay here, and is there a school-zone premium baked into asking?
- The area grade is low — what's the realistic commute time and amenity access for the typical tenant pool here? Any planned neighborhood developments (good or bad) we should know about?
- What's the average days-on-market for RENTAL listings here right now (not sales)? A rising rental-DOM trend means longer vacancies and softer asking-rent achievability than the comps imply.
- What's the recent tenant-quality profile in this submarket — average credit score on applications, eviction rate, late-payment / NSF rate, and stable-employment percentage? A property-management company in the area should have these aggregated.
- How much new for-sale + rental construction is in the pipeline within 1–3 miles? Heavy new supply typically softens prices + rents 12–24 months out; constrained supply supports both.
Investment metrics
- 1% rule
- 0.61% ✗
- Cap rate
- 4.75%
- Cash-on-cash
- -5.51%
- DSCR
- 0.75
- GRM
- 13.7
CMA / ARV
- ARV (median comp)
- $848,978
- List price
- $680,000
- Delta
- -19.90%
- Verdict
- UNDERPRICED
- Comps
- 20 within 1.0 mi
Show comp detail 12 sales within ~0.75 mi
| Address | Dist | Beds/Ba | Sqft | Sold | Price | $/sf | Match |
|---|---|---|---|---|---|---|---|
| 2135 S Porter St | 0.22mi | 5/3.0 (-1) | 3,348 (-5%) | 0mo | $730,000 | $218 | 72 |
| 860 E Oakland St | 0.36mi | 5/2.5 (-1) | 3,482 (-1%) | 4mo | $1,010,000 | $290 | 68 |
| 2069 S Sailors Ct | 0.40mi | 6/4.0 | 3,690 (+5%) | 12mo | $845,000 | $229 | 63 |
| 881 E Boston St | 0.29mi | 5/3.0 (-1) | 3,722 (+6%) | 12mo | $895,000 | $240 | 57 |
| 859 E Oakland St | 0.33mi | 5/3.0 (-1) | 3,348 (-5%) | 18mo | $750,000 | $224 | 53 |
| 847 E Del Rio St | 0.57mi | 5/4.0 (-1) | 3,425 (-3%) | 14mo | $845,000 | $247 | 52 |
| 1310 E Parkview Dr | 0.64mi | 5/3.5 (-1) | 3,310 (-6%) | 2mo | $690,000 | $208 | 52 |
| 654 E Hampton Ct | 0.60mi | 6/4.0 | 4,011 (+14%) | 1mo | $1,037,500 | $259 | 48 |
| 1374 E Parkview Dr | 0.68mi | 5/3.5 (-1) | 3,432 (-2%) | 12mo | $850,000 | $248 | 48 |
| 1273 E Hampton Ln | 0.62mi | 5/2.5 (-1) | 3,037 (-14%) | 7mo | $710,000 | $234 | 32 |
| 741 E Vermont Dr | 0.51mi | 5/3.0 (-1) | 4,022 (+14%) | 18mo | $900,000 | $224 | 28 |
| 1808 S Sailors Way | 0.71mi | 5/3.0 (-1) | 4,010 (+14%) | 11mo | $1,175,000 | $293 | 25 |
Match score weights: distance 35% · size 25% · config 20% · recency 20%. Top-matched comps best support the ARV.
Projected returns pro-forma
-3.0% appreciation · 0.0% rent growth · sell at horizon
- IRR
- -28.7%
- Equity multiple
- 0.06×
- Total profit
- $-178,333
- Equity at exit
- $101,390
- IRR
- -42.6%
- Equity multiple
- -0.44×
- Total profit
- $-275,093
- Equity at exit
- $58,794
Cash invested: $190,400 (down + closing). Projections, not guarantees.
Landlord ↔ Tenant lean methodology
- Overall (STATE)
- 87 Strongly Landlord-Friendly
- State Arizona
- 87 Strongly Landlord-Friendly · R+3
- County
- — inherits STATE
- City
- — inherits STATE
ZIP-level market 85295
- Home prices YoY
- -7.5%
- Rents YoY
- -0.4%
- Active inventory
- 225
- Price-to-rent
- 13.7×
Monthly cashflow live
- Estimated rent
- $4,143 medium interval (Pro) →
- Mortgage (P&I)
- −$3,566
- Tax from tax record
- −$223 /mo · $2,674/yr
- Insurance
- −$283
- HOA
- −$76
- Vacancy / Maint / Mgmt
- −$870
- Net cashflow
- $-875
Break-even live
UW: 25.0% down · 7.5% · 30yr · 1.5% tax · 5.0% vac · 8.0% maint · 8.0% mgmt
Financing live
Cash to close
- Down payment
- $170,000
- Closing costs
- $20,400
- Reserves months
- —
- Total cash needed
- —
Loan-product check · same deal, 3 products live
Conventional
25% down · 7.5% · 30yr
- Down + closing
- —
- Monthly P&I
- —
- Monthly cashflow
- —
- DSCR
- —
- Eligible?
- —
Personal DTI + credit; lowest rate.
DSCR
20% down · 8.5% · 30yr
- Down + closing
- —
- Monthly P&I
- —
- Monthly cashflow
- —
- DSCR
- —
- Eligible?
- —
No personal income docs; deal must DSCR.
Hard money
10% down · 12.0% · 12mo
- Down + closing
- —
- Monthly P&I
- —
- Monthly cashflow
- —
- DSCR
- —
- Eligible?
- —
Short-term bridge; refi at stabilization.
Rent comps 2 comps
| Address | Beds | Baths | Sqft | Rent | $/sqft | DOM | Units | Dist |
|---|---|---|---|---|---|---|---|---|
| 2665 S Velvendo Dr Gilbert, AZ | 5.0 | 3.5 | 3771 | $5,200 | $1.38 | 5d | 1 | 0.43mi |
| 587 E Benrich Dr Gilbert, AZ | 5.0 | 3.0 | 2877 | $4,195 | $1.46 | 24d | 1 | 1.05mi |
HOA detail
- Monthly dues
- $76 · $912/yr
Listing history 11 events
-
2026-06-09status $680,000 Pending 101 DOM
-
2026-06-08days on market $680,000 Active 101 DOM
-
2026-06-07days on market $680,000 Active 100 DOM
-
2026-06-04days on market $680,000 Active 97 DOM
-
2026-06-03days on market $680,000 Active 96 DOM
-
2026-06-02days on market $680,000 Active 95 DOM
-
2026-06-01days on market $680,000 Active 94 DOM
-
2026-05-31days on market $680,000 Active 93 DOM
-
2026-04-24price $680,000 782-char remark
Show marketing remark (782 chars)
Located in the highly sought-after Lindsay Estates, this popular Engle floorplan offers exceptional space and functionality. Open and bright with soaring vaulted ceilings, this 6-bedroom, 3-bath home plus formal living and dining areas. The open kitchen transitions into the extended family room just a few steps below, maintaining an airy, connected feel while offering a cozy, defined gathering space. All five bedrooms are generously oversized with walk-in closets. New HVAC systems installed in 2024. New carpet throughout. Ideally located between Downtown Gilbert and San Tan Village with convenient access to shopping, dining, entertainment, and Loop 202. Located within the A+ rated Gilbert Public School District, this home offers outstanding space, location, and lifestyle.
-
2026-03-27price $684,900 782-char remark
Show marketing remark (782 chars)
Located in the highly sought-after Lindsay Estates, this popular Engle floorplan offers exceptional space and functionality. Open and bright with soaring vaulted ceilings, this 6-bedroom, 3-bath home plus formal living and dining areas. The open kitchen transitions into the extended family room just a few steps below, maintaining an airy, connected feel while offering a cozy, defined gathering space. All five bedrooms are generously oversized with walk-in closets. New HVAC systems installed in 2024. New carpet throughout. Ideally located between Downtown Gilbert and San Tan Village with convenient access to shopping, dining, entertainment, and Loop 202. Located within the A+ rated Gilbert Public School District, this home offers outstanding space, location, and lifestyle.
-
2026-02-27$699,000 Active 782-char remark
Show marketing remark (782 chars)
Located in the highly sought-after Lindsay Estates, this popular Engle floorplan offers exceptional space and functionality. Open and bright with soaring vaulted ceilings, this 6-bedroom, 3-bath home plus formal living and dining areas. The open kitchen transitions into the extended family room just a few steps below, maintaining an airy, connected feel while offering a cozy, defined gathering space. All five bedrooms are generously oversized with walk-in closets. New HVAC systems installed in 2024. New carpet throughout. Ideally located between Downtown Gilbert and San Tan Village with convenient access to shopping, dining, entertainment, and Loop 202. Located within the A+ rated Gilbert Public School District, this home offers outstanding space, location, and lifestyle.
ⓘ Source: listings_history table (triggers on properties + properties_extension) + one-shot
backfill from property_details.listing_events for pre-trigger history.
Tax reassessment forecast AZ · Resets to sale price
- Current annual tax
- $2,674 · $223/mo
- Projected year-2 tax
- $4,488 · $374/mo
- Expected delta
- +$1,814/yr (+$151/mo · 67.8%)
ⓘ Screening estimate from a state-policy table — verify with the county assessor before closing.
Climate risk First Street
- Flood 1/10 Low FEMA zone X (shaded) · 0% chance over 30 yrs
- Wildfire 1/10 Low
- Heat 9/10 Extreme 7 d/yr ≥111°F today · 19 d/yr by 30 yrs out
- Wind 1/10 Low
- Air quality 2/10 Low 0 unhealthy d/yr today · 1 by 30 yrs out
Nearby sold comps map
Loading sold comps map…
Walkable amenities ~0.75 mi
Loading nearby amenities…
Taxation est. · year 1
- Rental income
- $49,720
- − Mortgage interest
- −$38,091
- − Property taxes
- −$2,674
- − Insurance
- −$3,400
- − Repairs & maintenance
- −$3,978
- − Management
- −$3,978
- − HOA
- −$912
- − Depreciation
- −$19,782
- Taxable loss
- −$23,094
- Est. tax savings @ 24.0%
- +$5,542
- After-tax cash flow
- $-4,957/yr
For passive investors: Depreciation is non-cash, so a rental often shows a tax loss while cash-flowing — sheltering income. Rental losses are passive: they offset passive income freely, and up to $25,000/yr can offset ordinary (W-2) income if you actively participate and your MAGI is under $100k (phasing out to $0 by $150k); unused losses carry forward. On sale, claimed depreciation is recaptured at up to 25%, and gains may owe capital-gains tax (a 1031 exchange can defer both). Figures are a year-1 estimate at your 24.0% rate — not tax advice; consult a CPA.
Schools (NCES district)
- District
- Gilbert Unified District (4239)
- NCES district ID
- 0403400
- Math proficiency
- 49% ▼ -8.00%
- Reading proficiency
- 52% ▼ -7.00%
- Median HH income
- $74,715
- Composite
- 45.55/100
- National rank
- #2600
- State rank
- #38 of 249 in AZ
Livability — Gilbert
- Score
- 87/100
- State rank
- #1
- US rank
- #240
Category grades
Schools grade is shown separately in the Schools card above.
Census & demographics
- Census place
- Gilbert, AZ
- County
- Maricopa County · 4,537,380 people
- City population
- 281,769
- Metro
- Phoenix-Mesa-Chandler, AZ
- Population (ZIP)
- 56,744
- Household income
- $118,467
- Rent vs Own
- Severe rent burden
- 1596.0
Population outlook (Maricopa County) Hauer SSP2
- Today (2025)
- 4,979,203 people
- By 2030
- 5,378,229 · +8.0%
- By 2040
- 6,156,598 · +23.6%
- By 2050
- 6,872,376 · +38.0%
- By 2075
- 8,401,270 · +68.7%
- By 2100
- 9,247,439 · +85.7%
Race, ethnicity, and origin ACS 2023
- Neighborhood character
- Majority White (64%)
- Race & ethnicity
- White 64% Hispanic / Latino 20% Two or more races 12% Asian 6% Black 3% Native American 1%
- Hispanic origin (detail)
- Mexican 15%
- Common ancestry
- Portuguese 3% Slovak 2% Italian 2%
- Foreign-born
- 8% · Canada, Vietnam, China
- Languages at home
- 86% English-only · Spanish 8% Other Asian/Pacific 1% Other Indo-European 1%
Political lean MEDSL · Maricopa
- 2024 margin
- Toss-up / Even · D 47.7% · R 51.2% · Other 1.1%
- 2008→2024 swing
- +7.1pp toward D · 2008: -10.6pp · 2024: -3.5pp
- All cycles
- 2024: R+3.5 2020: D+2.2 2016: R+3.5 2012: R+12.0 2008: R+10.6
Not yet ingested
- Civics
- —
Market trends
- HPI YoY
- ▼ -25.45%
- Current HPI
- 313.2677
- Rent YoY
- ▼ -0.38%
- Metro
- Phoenix-Mesa-Chandler, AZ
- State GDP YoY
- ▲ 4.54%
- F500 in state
- 20
Industry mix (Fortune 500 HQ in AZ)
| Industry | F500 HQs | Revenue |
|---|---|---|
| Technology | 2 | $13B |
|
||
| Mining / Metals | 1 | $23B |
|
||
| Environmental Services | 1 | $16B |
|
||
| Metals / Steel | 1 | $14B |
|
||
| Technology Distribution | 1 | $9B |
|
||
| Homebuilding | 1 | $8B |
|
||
Price history
-2.7% since first listed3 events — show timeline
- 2026-04-24 Price Changed $680,000 ARMLS
- 2026-03-27 Price Changed $684,900 ARMLS
- 2026-02-27 Listed $699,000 ARMLS
Property tax history
+0.6%/yrLatest (2025): $2,674 · +4.0% YoY. Source: county tax records.
Cash-flow waterfall
monthlySold comps — $/sqft
last 12 mo · ≤1 miLoading sold comps…