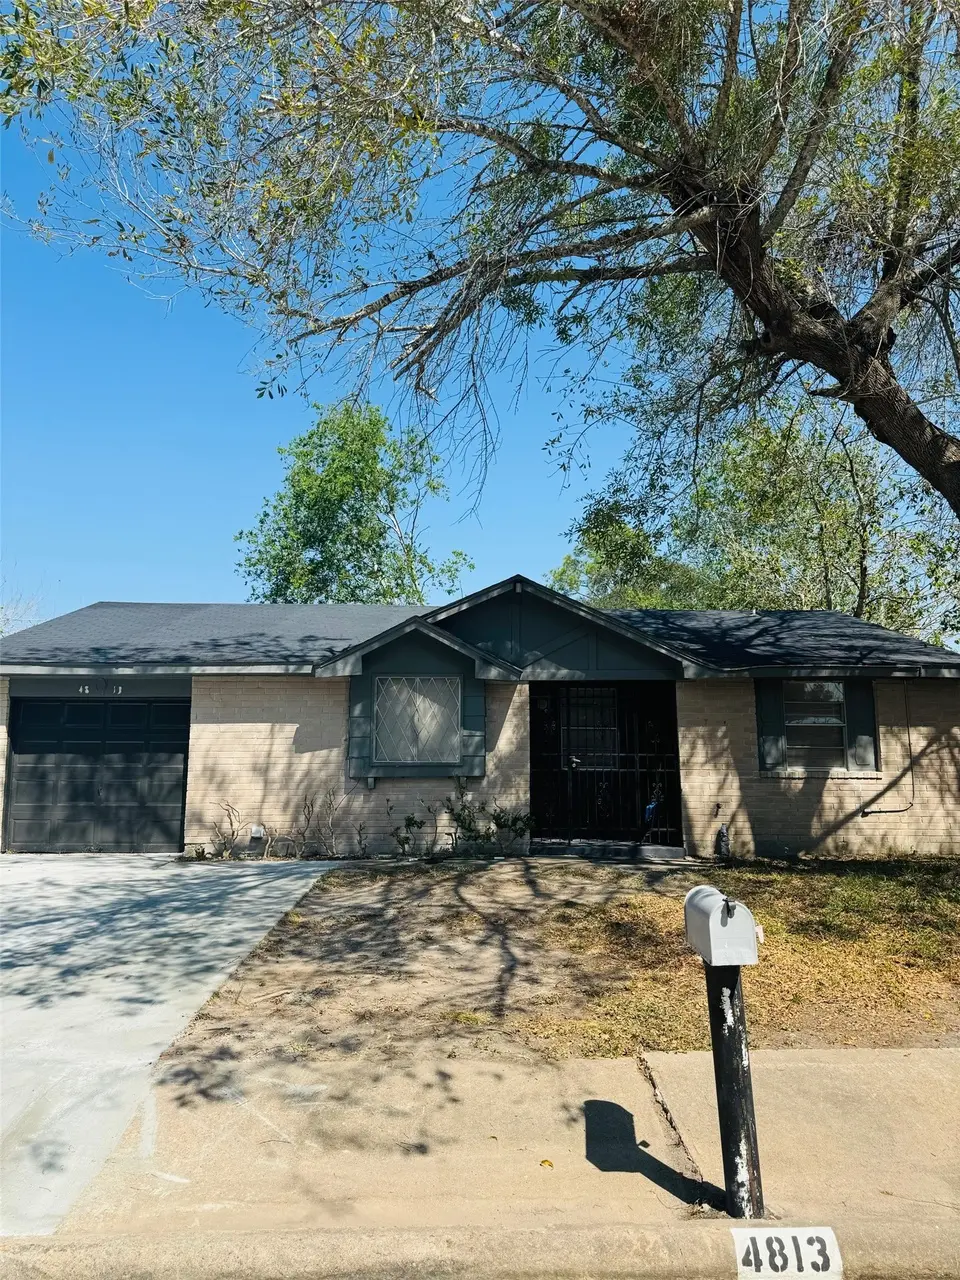
4813 E Ridge Creek Drive Dr · Houston, TX
Flood risk 6/10 · Moderate
- FEMA flood zone
- X (shaded)
- Chance of flooding over 30 yrs
- 0.7%
- Est. flood insurance / yr
- $507 – $1,088
Fire risk 2/10 · Minimal
- Est. fire insurance / yr
- $1,222 – $2,270
Heat risk 9/10 · Severe
- Hot days now (above 110°F)
- 7 days/yr
- Hot days in 30 yrs
- 23 days/yr
Wind risk 9/10 · Severe
- Chance of severe wind over 30 yrs
- 99.0%
Air-quality risk 3/10 · Minor
- Unhealthy air days now
- 2 days/yr
- Unhealthy air days in 30 yrs
- 3 days/yr
Risk factors via First Street. Map © Google.
Why this score? — see what drove the C- grade
The composite is a weighted blend of 9 inputs, each scored 0–100. Each bar is that input's sub-score; the figure is the points it added to the 100-point composite (weight × sub-score).
- Cash flow +16.5/30.0
- ARV discount +10.8/15.0
- 1% rule +5.4/10.0
- DSCR +5.1/10.0
- Schools +4.5/10.0
- Livability +3.7/5.0
- Rent growth +2.9/5.0
- Condition / age +2.5/5.0
- Appreciation +0.0/10.0
$155,000
🖨 Deal sheet 📄 Offer letter ✓ Due diligence
Listing remarks MLS
Great home for beginner. Low tax rate with perfect location. Brand new roof.
Key facts
- Brand new roof
- 4,673 sq ft lot
- Garage
Tags
Neighborhood map
What this means for you Summary
Snapshot
- This is a 2-bed/2.0-bath single-family listed at $155k.
Deal economics
- At list price, monthly cash flow is $92 ($1k/yr) — positive.
- The deal already cash-flows at list — no discount required.
- Meets the 1% rule at list price ($2k rent vs $155k).
- Recommended offer: $136k (12.0% below list) — sets the bar for market timing.
- Cap rate 7.0% vs local median 3.2% in Houston — top-decile yield for the area; either an underpriced asset or a hidden risk that comps aren't pricing in. Stress-test before assuming the spread holds.
Location & tenants
- Location reads 74/100 on livability (#184 in TX, #4,771 nationally) — a middle-class / working-renter tenant base. Strengths: amenities A+, cost of living A+, housing A+; Watch: schools D, crime F.
- Fort Bend ISD (suburban): math 44% / reading 53% proficiency, ranked #140 of 826 in TX (top 17%) — families likely to look elsewhere, expect single-tenant / working-renter base with shorter leases.
- Market conditions: Rents rising (+1.7%/yr); 115 active listings in the ZIP; 10 comparable units currently listed for rent nearby; rentals at typical pace (median 21d on market — plan ~3-4 weeks tenant-placement turnaround); 12,093 units permitted in Fort Bend County in 2024 (815 in 5+ unit buildings).
Forward outlook
- Local home prices are declining (-3.0%/yr); year-one equity from $1k of loan paydown is wiped out by about $5k of value loss. Plan a longer hold.
- Fort Bend County population projected at +75% by 2050 — long-run rental-demand tailwind backs the buy-and-hold thesis.
Negotiation context
- It's been on market 132 days — a 12% lower offer ($136k) is reasonable based on typical stale-listing flexibility.
- 5 sale attempts since 2y ago with the ask held roughly flat each time — persistent listings suggest the price (not the market) is what's stuck; bring a comps-based counter.
Risks & watch-outs
- Climate carrying-cost: major flood risk; severe wind risk, 99% chance of damaging wind over 30y; extreme-heat days projected 7→23/yr by 2055 (HVAC capex compounding) — expect insurance premiums to compound above CPI over the hold.
Questions for the listing agent
- It's been on market 132 days. Have you received any prior offers? Is the seller open to a 12% concession, seller financing, or rate buy-down credit?
- Built in 1972 — when were the roof, HVAC, electrical panel, plumbing, and water heater last replaced?
- What does the HOA fee cover, when was the last increase, and are there any pending special assessments or reserve-fund shortfalls?
- Why hasn't it sold? Are there any deal-killer items the seller is aware of (foundation, flood, title, zoning, code violations)?
- Is there a deadline driving the sale (1031 exchange, divorce, estate, relocation)? That informs how much negotiation room exists.
- Schools are D-rated, which usually means shorter tenancies and higher turnover. Who's the typical renter profile here, and what's been the actual vacancy rate?
- Crime grade is F in this area — have there been break-ins, vandalism, or insurance claims at this property in the last 3 years? What carrier currently insures it and at what premium?
- What's the average days-on-market for RENTAL listings here right now (not sales)? A rising rental-DOM trend means longer vacancies and softer asking-rent achievability than the comps imply.
- What's the recent tenant-quality profile in this submarket — average credit score on applications, eviction rate, late-payment / NSF rate, and stable-employment percentage? A property-management company in the area should have these aggregated.
- How much new for-sale + rental construction is in the pipeline within 1–3 miles? Heavy new supply typically softens prices + rents 12–24 months out; constrained supply supports both.
Investment metrics
- 1% rule
- 1.04% ✓
- Cap rate
- 7.01%
- Cash-on-cash
- 2.55%
- DSCR
- 1.11
- GRM
- 8.0
CMA / ARV
- ARV (median comp)
- $167,208
- List price
- $155,000
- Delta
- -7.30%
- Verdict
- FAIR
- Comps
- 20 within 1.0 mi
Show comp detail 12 sales within ~0.75 mi
| Address | Dist | Beds/Ba | Sqft | Sold | Price | $/sf | Match |
|---|---|---|---|---|---|---|---|
| 5023 Ridgestone St | 0.39mi | 3/1.5 (+1) | 1,077 (+1%) | 4mo | $235,000 | $218 | 69 |
| 5119 Ridgewest St | 0.51mi | 3/1.5 (+1) | 1,018 (-4%) | 2mo | $165,000 | $162 | 61 |
| 16019 Bunker Ridge Rd | 0.11mi | 3/2.0 (+1) | 1,221 (+15%) | 7mo | $209,999 | $172 | 59 |
| 4511 Springridge Rd | 0.36mi | 3/2.0 (+1) | 1,139 (+7%) | 8mo | $180,000 | $158 | 59 |
| 4503 Nexus Rd | 0.41mi | 3/2.0 (+1) | 1,182 (+11%) | 4mo | $184,000 | $156 | 54 |
| 4875 Beechaven St | 0.25mi | 3/2.0 (+1) | 1,209 (+14%) | 10mo | $170,000 | $141 | 52 |
| 5139 Ridgestone St | 0.56mi | 3/1.5 (+1) | 988 (-7%) | 7mo | $160,000 | $162 | 50 |
| 16511 Lazy Ridge Rd | 0.61mi | 3/2.0 (+1) | 1,168 (+10%) | 2mo | $210,000 | $180 | 48 |
| 5111 Raven Ridge Dr | 0.65mi | 3/2.0 (+1) | 1,181 (+11%) | 1mo | $175,000 | $148 | 45 |
| 16319 Clearmont Dr | 0.70mi | 3/2.0 (+1) | 1,177 (+11%) | 1mo | $175,000 | $149 | 44 |
| 5130 Porter Ridge Dr | 0.71mi | 3/2.0 (+1) | 1,181 (+11%) | 11mo | $215,000 | $182 | 34 |
| 5207 Castlecreek Ln | 0.65mi | 3/2.0 (+1) | 908 (-14%) | 15mo | $205,999 | $227 | 28 |
Match score weights: distance 35% · size 25% · config 20% · recency 20%. Top-matched comps best support the ARV.
Projected returns pro-forma
-3.0% appreciation · 1.72% rent growth · sell at horizon
- IRR
- -13.8%
- Equity multiple
- 0.51×
- Total profit
- $-21,211
- Equity at exit
- $23,111
- IRR
- -7.2%
- Equity multiple
- 0.57×
- Total profit
- $-18,744
- Equity at exit
- $13,402
Cash invested: $43,400 (down + closing). Projections, not guarantees.
Landlord ↔ Tenant lean methodology
- Overall (STATE)
- 87 Strongly Landlord-Friendly
- State Texas
- 87 Strongly Landlord-Friendly · R+5
- County
- — inherits STATE
- City
- — inherits STATE
ZIP-level market 77053
- Rents YoY
- 1.7%
- Active inventory
- 115
- Price-to-rent
- 8.0×
Monthly cashflow live
- Estimated rent
- $1,612 high interval (Pro) →
- Mortgage (P&I)
- −$813
- Tax from tax record
- −$288 /mo · $3,454/yr
- Insurance
- −$65
- HOA
- −$16
- Vacancy / Maint / Mgmt
- −$338
- Net cashflow
- $92
Break-even live
UW: 25.0% down · 7.5% · 30yr · 1.5% tax · 5.0% vac · 8.0% maint · 8.0% mgmt
Financing live
Cash to close
- Down payment
- $38,750
- Closing costs
- $4,650
- Reserves months
- —
- Total cash needed
- —
Loan-product check · same deal, 3 products live
Conventional
25% down · 7.5% · 30yr
- Down + closing
- —
- Monthly P&I
- —
- Monthly cashflow
- —
- DSCR
- —
- Eligible?
- —
Personal DTI + credit; lowest rate.
DSCR
20% down · 8.5% · 30yr
- Down + closing
- —
- Monthly P&I
- —
- Monthly cashflow
- —
- DSCR
- —
- Eligible?
- —
No personal income docs; deal must DSCR.
Hard money
10% down · 12.0% · 12mo
- Down + closing
- —
- Monthly P&I
- —
- Monthly cashflow
- —
- DSCR
- —
- Eligible?
- —
Short-term bridge; refi at stabilization.
Rent comps 10 comps
| Address | Beds | Baths | Sqft | Rent | $/sqft | DOM | Units | Dist |
|---|---|---|---|---|---|---|---|---|
| 15858 Clarke Springs Dr Unit 15858C Houston, TX | 3.0 | 2.0 | 1232 | $1,495 | $1.21 | 20d | 1 | 0.30mi |
| 15858 Clarke Springs Dr Houston, TX | 3.0 | 2.0 | 1232 | $1,495 | $1.21 | 22d | 1 | 0.30mi |
| 15871 Clarke Springs Dr Houston, TX | 3.0 | 2.0 | 1260 | $1,495 | $1.19 | 22d | 1 | 0.31mi |
| 15871 Clarke Springs Dr Unit 15871C Houston, TX | 3.0 | 2.0 | 1260 | $1,495 | $1.19 | 20d | 1 | 0.31mi |
| 15810 Boonridge Rd Houston, TX | 3.0 | 2.0 | 1221 | $1,750 | $1.43 | 43d | 1 | 0.39mi |
| 15706 Clarke Springs Dr Houston, TX | 3.0 | 2.0 | 1176 | $1,495 | $1.27 | 16d | 1 | 0.52mi |
| 15706 Clarke Springs Dr Unit 15706C Houston, TX | 3.0 | 2.0 | 1176 | $1,495 | $1.27 | 15d | 1 | 0.52mi |
| 5030 Shadowridge Dr Houston, TX | 3.0 | 2.0 | 1310 | $1,800 | $1.37 | 43d | 1 | 0.77mi |
| 5030 Ridgecreek Dr Houston, TX | 3.0 | 2.0 | 1399 | $1,659 | $1.19 | 2d | 1 | 0.82mi |
| 16603 Sentinel Dr Houston, TX | 3.0 | 2.0 | 1296 | $1,799 | $1.39 | 16d | 1 | 1.21mi |
HOA detail
- Monthly dues
- $16 · $192/yr
Listing history 17 events
-
2026-06-18days on market $155,000 Active 132 DOM
-
2026-06-17days on market $155,000 Active 131 DOM
-
2026-06-16days on market $155,000 Active 130 DOM
-
2026-06-15days on market $155,000 Active 129 DOM
-
2026-06-13status $155,000 Active 127 DOM
-
2026-01-20$155,000 Active 76-char remark
Show marketing remark (76 chars)
Great home for beginner. Low tax rate with perfect location. Brand new roof.
-
2025-12-31historical
-
2025-09-02price $159,888
-
2025-06-23$168,888 Active
-
2025-06-02historical
-
2025-04-01status Active
-
2025-03-31historical
-
2025-02-14price $169,999
-
2025-02-14status Active
-
2025-02-04historical
-
2024-11-27price $168,888
-
2024-10-17$178,888 Active
ⓘ Source: listings_history table (triggers on properties + properties_extension) + one-shot
backfill from property_details.listing_events for pre-trigger history.
Tax reassessment forecast TX · Resets to sale price
- Current annual tax
- $3,454 · $288/mo
- Projected year-2 tax
- $3,454 · $288/mo
- Expected delta
- $0/yr ($0/mo · 0.0%)
ⓘ Screening estimate from a state-policy table — verify with the county assessor before closing.
Climate risk First Street
- Flood 6/10 Major FEMA zone X (shaded) · 70% chance over 30 yrs
- Wildfire 2/10 Low
- Heat 9/10 Extreme 7 d/yr ≥110°F today · 23 d/yr by 30 yrs out
- Wind 9/10 Extreme 99% chance of damaging wind over 30 yrs
- Air quality 3/10 Moderate 2 unhealthy d/yr today · 3 by 30 yrs out
Nearby sold comps map
Loading sold comps map…
Walkable amenities ~0.75 mi
Loading nearby amenities…
Taxation est. · year 1
- Rental income
- $19,341
- − Mortgage interest
- −$8,682
- − Property taxes
- −$3,454
- − Insurance
- −$775
- − Repairs & maintenance
- −$1,547
- − Management
- −$1,547
- − HOA
- −$192
- − Depreciation
- −$4,509
- Taxable loss
- −$1,366
- Est. tax savings @ 24.0%
- +$328
- After-tax cash flow
- $1,432/yr
For passive investors: Depreciation is non-cash, so a rental often shows a tax loss while cash-flowing — sheltering income. Rental losses are passive: they offset passive income freely, and up to $25,000/yr can offset ordinary (W-2) income if you actively participate and your MAGI is under $100k (phasing out to $0 by $150k); unused losses carry forward. On sale, claimed depreciation is recaptured at up to 25%, and gains may owe capital-gains tax (a 1031 exchange can defer both). Figures are a year-1 estimate at your 24.0% rate — not tax advice; consult a CPA.
Schools (NCES district)
- District
- Fort Bend ISD
- NCES district ID
- 4819650
- Math proficiency
- 44% ▼ -15.00%
- Reading proficiency
- 53% ▼ -4.00%
- Median HH income
- $82,360
- Composite
- 44.61/100
- National rank
- #2779
- State rank
- #140 of 826 in TX
Livability — Houston
- Score
- 74/100
- State rank
- #184
- US rank
- #4771
Category grades
Schools grade is shown separately in the Schools card above.
Census & demographics
- Census place
- Houston, TX
- County
- Fort Bend County · 836,777 people
- City population
- 3,226,434
- Metro
- Houston-The Woodlands-Sugar Land, TX
- Population (ZIP)
- 30,198
- Household income
- $66,510
- Rent vs Own
- Severe rent burden
- 562.0
Population outlook (Fort Bend County) Hauer SSP2
- Today (2025)
- 1,004,526 people
- By 2030
- 1,153,104 · +14.8%
- By 2040
- 1,453,718 · +44.7%
- By 2050
- 1,753,781 · +74.6%
- By 2075
- 2,455,772 · +144.5%
- By 2100
- 2,930,528 · +191.7%
Race, ethnicity, and origin ACS 2023
- Neighborhood character
- Majority Hispanic (54%)
- Race & ethnicity
- Hispanic / Latino 54% Black 41% Two or more races 22% White 3% Native American 2%
- Hispanic origin (detail)
- Mexican 39%
- Common ancestry
- Lithuanian 1% Portuguese 1% Slovak 1%
- Foreign-born
- 26% · Canada
- Languages at home
- 50% English-only · Spanish 49%
Political lean MEDSL · Fort Bend
- 2024 margin
- Toss-up / Even · D 49.5% · R 47.9% · Other 2.6%
- 2008→2024 swing
- +4.0pp toward D · 2008: -2.4pp · 2024: 1.6pp
- All cycles
- 2024: D+1.6 2020: D+10.6 2016: D+6.6 2012: R+6.8 2008: R+2.4
Not yet ingested
- Civics
- —
Market trends
- HPI YoY
- ▼ -182.09%
- Current HPI
- 266.6541
- Rent YoY
- ▲ 1.72%
- Metro
- Houston-The Woodlands-Sugar Land, TX
- State GDP YoY
- ▲ 3.95%
- F500 in state
- 110
Industry mix (Fortune 500 HQ in TX)
| Industry | F500 HQs | Revenue |
|---|---|---|
| Energy | 16 | $1,198B |
|
||
| Technology | 5 | $198B |
|
||
| Engineering / Construction | 4 | $72B |
|
||
| Energy Services | 3 | $60B |
|
||
| Utilities | 3 | $41B |
|
||
| Healthcare | 2 | $330B |
|
||
Price history
-13.4% since first listed12 events — show timeline
- 2026-01-20 Listed $155,000 HARMLS
- 2025-12-31 Listing Removed — HARMLS
- 2025-09-02 Price Changed $159,888 HARMLS
- 2025-06-23 Listed $168,888 HARMLS
- 2025-06-02 Listing Removed — HARMLS
- 2025-04-01 Relisted — HARMLS
- 2025-03-31 Listing Removed — HARMLS
- 2025-02-14 Price Changed $169,999 HARMLS
- 2025-02-14 Relisted — HARMLS
- 2025-02-04 Listing Removed — HARMLS
- 2024-11-27 Price Changed $168,888 HARMLS
- 2024-10-17 Listed $178,888 HARMLS
Property tax history
+5.1%/yrLatest (2025): $3,454 · +14.4% YoY. Source: county tax records.
Cash-flow waterfall
monthlySold comps — $/sqft
last 12 mo · ≤1 miLoading sold comps…