 Multi-family
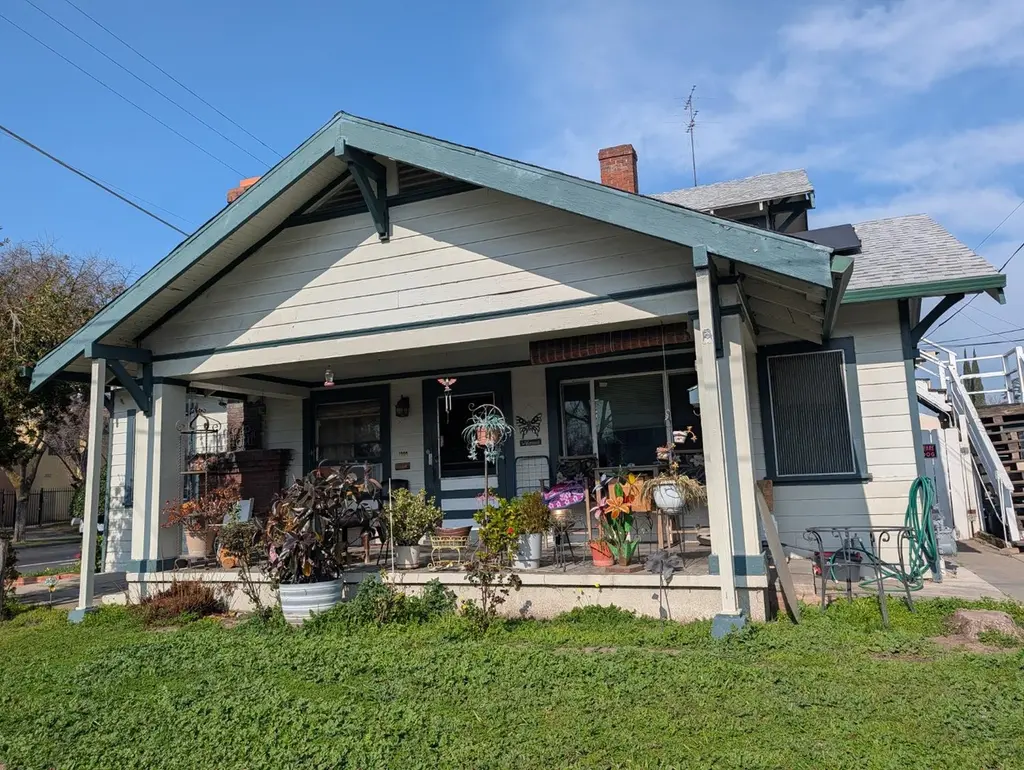
1900 N Eldorado · Stockton, CA
Flood risk 4/10 · Minor
- FEMA flood zone
- X
- Chance of flooding over 30 yrs
- 0.23%
- Est. flood insurance / yr
- $507 – $1,088
Fire risk 1/10 · Minimal
- Est. fire insurance / yr
- $659 – $1,223
Heat risk 7/10 · Major
- Hot days now (above 103°F)
- 7 days/yr
- Hot days in 30 yrs
- 14 days/yr
Wind risk 1/10 · Minimal
- Chance of severe wind over 30 yrs
- —
Air-quality risk 10/10 · Severe
- Unhealthy air days now
- 30 days/yr
- Unhealthy air days in 30 yrs
- 30 days/yr
Risk factors via First Street. Map © Google.
Why this score? — see what drove the D grade
The composite is a weighted blend of 9 inputs, each scored 0–100. Each bar is that input's sub-score; the figure is the points it added to the 100-point composite (weight × sub-score).
- Cash flow +18.8/30.0
- DSCR +5.9/10.0
- ARV discount +4.7/15.0
- 1% rule +3.9/10.0
- Rent growth +3.1/5.0
- Schools +2.9/10.0
- Livability +2.9/5.0
- Condition / age +2.5/5.0
- Appreciation +0.0/10.0
$381,000
🖨 Deal sheet (PDF) 📄 Offer letter ✓ Due diligence
Multi-family units
County records classify this as Multi-Family (2-4 Unit). Listing-text estimate: 1 unit. estimate disagrees with records
Listing remarks
Reduced Price . . Seller says submit offers for consideration . . Large Craftsman style has Lots of potential . . Great Homeowner or investment property . . Zoning Residential Duplex 3 bedroom 2 bath main house approx sqft 1400 and 1 bedroom 1 bath apartment approx sqft 600 . . property has 2 meters . . Garage and attached carport . . Standard lot size 5000'+ good sized rear yard . . Close to UOP and Miracle Mile . .
Key facts
- Close to uop
- Miracle mile
- 5,375 sq ft lot
Tags
Neighborhood map
What this means for you Summary
Snapshot
- This is a 4-bed/3.0-bath multifamily listed at $381k.
Deal economics
- At list price, monthly cash flow is $386 ($5k/yr) — positive.
- The deal already cash-flows at list — no discount required.
- To meet the 1% rule (rent ≥ 1% of price), the offer needs to be $339k (11.0% below list).
- Recommended offer: $335k (12.0% below list) — sets the bar for market timing.
- Cap rate 7.5% vs local median 3.6% in Stockton — top-decile yield for the area; either an underpriced asset or a hidden risk that comps aren't pricing in. Stress-test before assuming the spread holds.
Location & tenants
- Location reads 57/100 on livability (#734 in CA) — a working-class tenant base; expect higher turnover. Strengths: housing A+, health & safety A, amenities A-; Watch: employment C-, crime F, commute F.
- Stockton Unified (urban): math 23% / reading 46% proficiency, ranked #295 of 517 in CA (top 57%) — families likely to look elsewhere, expect single-tenant / working-renter base with shorter leases; 78% free/reduced lunch — lower-income household profile, screen leases tightly.
- Zoned schools: Cleveland Elementary (652 students, 78% FRL); Stagg Senior High (math 12% / reading 32%, grade F, #950 of 1,170 statewide, top 82%, 1,773 students, 71% FRL) — zoned schools at 75% FRL track the district average.
- Zoned-school proficiency averages 22% at this address vs 34% district-wide (-12 pts) — the specific schools serving this property underperform the Stockton Unified average; the district grade overstates school quality for this exact location.
- Market conditions: Rents rising (+2.4%/yr); 140 active listings in the ZIP; 9 comparable units currently listed for rent nearby; rentals lingering (median 46d on market — plan ~5-8 weeks vacancy on turnover, expect pricing pressure); 56% of comp listings sitting > 30 days — soft ceiling on asking rent; solid renter incomes; 3,779 units permitted in San Joaquin County in 2024 (0 in 5+ unit buildings).
- At $3,389/mo this rent would consume 54% of the median local household income ($76k/yr) (locally 1434% of renters already pay >50% of income on rent) — very limited rent-growth headroom before tenants either downsize or default.
Forward outlook
- Local home prices are declining (-3.0%/yr); year-one equity from $3k of loan paydown is wiped out by about $11k of value loss. Plan a longer hold.
- San Joaquin County population projected at +17% by 2050 — long-run rental-demand tailwind backs the buy-and-hold thesis.
Negotiation context
- It's been on market 124 days — a 12% lower offer ($335k) is reasonable based on typical stale-listing flexibility.
- Current owner paid $75k; list at $381k implies a 408% gain — meaningful room to come down on a strong offer.
Risks & watch-outs
- Watch-outs: built in 1921 — expect roof / HVAC / electrical / plumbing capex.
- Climate carrying-cost: extreme-heat days projected 7→14/yr by 2055 (HVAC capex compounding) — expect insurance premiums to compound above CPI over the hold.
Questions for the listing agent
- It's been on market 124 days. Have you received any prior offers? Is the seller open to a 12% concession, seller financing, or rate buy-down credit?
- Built in 1921 — when were the roof, HVAC, electrical panel, plumbing, and water heater last replaced?
- Why hasn't it sold? Are there any deal-killer items the seller is aware of (foundation, flood, title, zoning, code violations)?
- Is there a deadline driving the sale (1031 exchange, divorce, estate, relocation)? That informs how much negotiation room exists.
- Schools are D-rated, which usually means shorter tenancies and higher turnover. Who's the typical renter profile here, and what's been the actual vacancy rate?
- Crime grade is F in this area — have there been break-ins, vandalism, or insurance claims at this property in the last 3 years? What carrier currently insures it and at what premium?
- The area grade is low — what's the realistic commute time and amenity access for the typical tenant pool here? Any planned neighborhood developments (good or bad) we should know about?
- What's the average days-on-market for RENTAL listings here right now (not sales)? A rising rental-DOM trend means longer vacancies and softer asking-rent achievability than the comps imply.
- What's the recent tenant-quality profile in this submarket — average credit score on applications, eviction rate, late-payment / NSF rate, and stable-employment percentage? A property-management company in the area should have these aggregated.
- How much new apartment / multifamily construction is in the pipeline within 1–3 miles? Heavy new supply (>2% of stock underway) typically softens rents 12–24 months out; light construction supports rent growth.
Investment metrics
- 1% rule
- 0.89% ✗
- Cap rate
- 7.51%
- Cash-on-cash
- 4.34%
- DSCR
- 1.19
- GRM
- 9.4
CMA / ARV
- ARV (median comp)
- $358,695
- List price
- $381,000
- Delta
- 6.22%
- Verdict
- FAIR
- Comps
- 20 within 1.0 mi
Show comp detail 2 sales within ~0.75 mi
| Address | Dist | Beds/Ba | Sqft | Sold | Price | $/sf | Match |
|---|---|---|---|---|---|---|---|
| 107 - 109 E Cleveland St | 0.13mi | 4/2.0 | 1,813 (-10%) | 14mo | $443,900 | $245 | 62 |
| 1038 N Commerce St | 0.55mi | 4/3.0 | 2,202 (+10%) | 13mo | $450,000 | $204 | 47 |
Match score weights: distance 35% · size 25% · config 20% · recency 20%. Top-matched comps best support the ARV.
Projected returns pro-forma
-3.0% appreciation · 2.37% rent growth · sell at horizon
- IRR
- -10.2%
- Equity multiple
- 0.63×
- Total profit
- $-39,472
- Equity at exit
- $56,808
- IRR
- -1.7%
- Equity multiple
- 0.89×
- Total profit
- $-12,042
- Equity at exit
- $32,942
Cash invested: $106,680 (down + closing). Projections, not guarantees.
Landlord ↔ Tenant lean methodology
- Overall (STATE)
- 18 Strongly Tenant-Friendly
- State California
- 18 Strongly Tenant-Friendly · D+13
- County
- — inherits STATE
- City
- — inherits STATE
ZIP-level market 95204
- Rents YoY
- 2.4%
- Active inventory
- 140
- Price-to-rent
- 16.5×
Monthly cashflow live
- Estimated rent
- $3,389 high interval (Pro) →
- Mortgage (P&I)
- −$1,998
- Tax from tax record
- −$135 /mo · $1,619/yr
- Insurance
- −$159
- HOA
- −$0
- Vacancy / Maint / Mgmt
- −$712
- Net cashflow
- $386
Break-even live
Sensitivity live
| Price | -10% $601 | -5% $493 | +0% $386 | +5% $278 | +10% $170 |
|---|---|---|---|---|---|
| Rent | -10% $118 | -5% $252 | +0% $386 | +5% $519 | +10% $653 |
| Rate | -1.0pp $577 | -0.5pp $483 | base $386 | +0.5pp $287 | +1.0pp $186 |
2-unit breakdown (identical units grouped — click to expand)
| Units | Beds | Baths | Est. rent |
|---|---|---|---|
| 1× unit | 3 | 2 | $1,926 |
| 1× unit | 1 | 1 | $1,463 |
| Total (2 units) | $3,389 | ||
UW: 25.0% down · 7.5% · 30yr · 1.5% tax · 5.0% vac · 8.0% maint · 8.0% mgmt
Financing live
Cash to close
- Down payment
- $95,250
- Closing costs
- $11,430
- Reserves months
- —
- Total cash needed
- —
Loan-product check · same deal, 3 products live
Conventional
25% down · 7.5% · 30yr
- Down + closing
- —
- Monthly P&I
- —
- Monthly cashflow
- —
- DSCR
- —
- Eligible?
- —
Personal DTI + credit; lowest rate.
DSCR
20% down · 8.5% · 30yr
- Down + closing
- —
- Monthly P&I
- —
- Monthly cashflow
- —
- DSCR
- —
- Eligible?
- —
No personal income docs; deal must DSCR.
Hard money
10% down · 12.0% · 12mo
- Down + closing
- —
- Monthly P&I
- —
- Monthly cashflow
- —
- DSCR
- —
- Eligible?
- —
Short-term bridge; refi at stabilization.
Rent comps 9 comps
| Address | Beds | Baths | Sqft | Rent | $/sqft | DOM | Units | Dist |
|---|---|---|---|---|---|---|---|---|
| 322 Lexington Ave Stockton, CA | 3.0 | 1.0 | 1508 | $2,400 | $1.59 | 45d | 1 | 0.33mi |
| 212 W Euclid Ave Stockton, CA | 3.0 | 2.5 | 1833 | $2,900 | $1.58 | 45d | 1 | 0.79mi |
| 3630 Bonnie Ln Stockton, CA | 5.0 | 2.0 | 1961 | $700 | $0.36 | 25d | 1 | 0.93mi |
| 3520 San Mateo Ave Stockton, CA | 3.0 | 1.0 | 1446 | $2,200 | $1.52 | 25d | 1 | 1.11mi |
| 1164 W Mendocino Ave Stockton, CA | 4.0 | 2.0 | 1577 | $740 | $0.47 | 45d | 1 | 1.11mi |
| 1220 W Mendocino Ave Stockton, CA | 4.0 | 2.0 | 1587 | $700 | $0.44 | 45d | 1 | 1.14mi |
| 1214 N Pershing Ave Stockton, CA | 5.0 | 3.0 | 2650 | $3,450 | $1.30 | 45d | 1 | 1.15mi |
| 1552 Middlefield Ave Stockton, CA | 4.0 | 2.0 | 1542 | $2,400 | $1.56 | 21d | 1 | 1.24mi |
| 1106 W Churchill St Stockton, CA | 5.0 | 3.0 | 1628 | $720 | $0.44 | 4d | 1 | 1.43mi |
Listing history 16 events
-
2026-06-21days on market $381,000 Active 124 DOM
-
2026-06-18days on market $381,000 Active 121 DOM
-
2026-06-17days on market $381,000 Active 120 DOM
-
2026-06-16days on market $381,000 Active 119 DOM
-
2026-06-15days on market $381,000 Active 118 DOM
-
2026-06-14days on market $381,000 Active 116 DOM
-
2026-06-10days on market $381,000 Active 113 DOM
-
2026-06-09days on market $381,000 Active 112 DOM
-
2026-06-08days on market $381,000 Active 111 DOM
-
2026-06-07days on market $381,000 Active 110 DOM
-
2026-06-05days on market $381,000 Active 107 DOM
-
2026-06-03days on market $381,000 Active 106 DOM
-
2026-06-03days on market $381,000 Active 105 DOM
-
2026-06-01days on market $381,000 Active 104 DOM
-
2026-05-31days on market $381,000 Active 103 DOM
-
1998-08-20soldstatus $75,000
ⓘ Source: listings_history table (triggers on properties + properties_extension) + one-shot
backfill from property_details.listing_events for pre-trigger history.
Tax reassessment forecast CA · Resets to sale price
- Current annual tax
- $1,619 · $135/mo
- Projected year-2 tax
- $2,896 · $241/mo
- Expected delta
- +$1,276/yr (+$106/mo · 78.8%)
ⓘ Screening estimate from a state-policy table — verify with the county assessor before closing.
Climate risk First Street
- Flood 4/10 Moderate FEMA zone X · 23% chance over 30 yrs
- Wildfire 1/10 Low
- Heat 7/10 Severe 7 d/yr ≥103°F today · 14 d/yr by 30 yrs out
- Wind 1/10 Low
- Air quality 10/10 Extreme 30 unhealthy d/yr today · 30 by 30 yrs out
Nearby sold comps map
Loading sold comps map…
Walkable amenities ~0.75 mi
Loading nearby amenities…
Taxation est. · year 1
- Rental income
- $40,668
- − Mortgage interest
- −$21,342
- − Property taxes
- −$1,619
- − Insurance
- −$1,905
- − Repairs & maintenance
- −$3,253
- − Management
- −$3,253
- − Depreciation
- −$11,084
- Taxable loss
- −$1,789
- Est. tax savings @ 24.0%
- +$429
- After-tax cash flow
- $5,057/yr
For passive investors: Depreciation is non-cash, so a rental often shows a tax loss while cash-flowing — sheltering income. Rental losses are passive: they offset passive income freely, and up to $25,000/yr can offset ordinary (W-2) income if you actively participate and your MAGI is under $100k (phasing out to $0 by $150k); unused losses carry forward. On sale, claimed depreciation is recaptured at up to 25%, and gains may owe capital-gains tax (a 1031 exchange can defer both). Figures are a year-1 estimate at your 24.0% rate — not tax advice; consult a CPA.
Schools (NCES district)
- District
- Stockton Unified
- NCES district ID
- 0638010
- Math proficiency
- 23% ▲ 2.00%
- Reading proficiency
- 46% ▲ 16.00%
- Median HH income
- $37,563
- Composite
- 28.65/100
- National rank
- #6701
- State rank
- #295 of 517 in CA
Livability — Stockton
- Score
- 57/100
- State rank
- #734
- US rank
- #21638
Category grades
Schools grade is shown separately in the Schools card above.
Census & demographics
- Census place
- Stockton, CA
- County
- San Joaquin County · 729,570 people
- City population
- 332,006
- Metro
- Stockton, CA
- Population (ZIP)
- 31,035
- Household income
- $75,548
- Rent vs Own
- Severe rent burden
- 1434.0
Population outlook (San Joaquin County) Hauer SSP2
- Today (2025)
- 796,965 people
- By 2030
- 828,849 · +4.0%
- By 2040
- 885,611 · +11.1%
- By 2050
- 929,798 · +16.7%
- By 2075
- 994,578 · +24.8%
- By 2100
- 971,291 · +21.9%
Race, ethnicity, and origin ACS 2023
- Neighborhood character
- Diverse neighborhood (Simpson 0.66)
- Race & ethnicity
- Hispanic / Latino 48% White 31% Two or more races 18% Asian 9% Black 7% Native American 2%
- Hispanic origin (detail)
- Mexican 42%
- Common ancestry
- Slovak 2% Russian 1% Italian 1%
- Foreign-born
- 18% · Canada, Vietnam, China
- Languages at home
- 67% English-only · Spanish 27% Other Asian/Pacific 3% Tagalog/Filipino 2%
Political lean MEDSL · San Joaquin
- 2024 margin
- Toss-up / Even · D 48.0% · R 48.9% · Other 3.0%
- 2008→2024 swing
- -11.6pp toward R · 2008: 10.7pp · 2024: -0.9pp
- All cycles
- 2024: R+0.9 2020: D+13.9 2016: D+12.9 2012: D+8.9 2008: D+10.7
Not yet ingested
- Civics
- —
Market trends
- HPI YoY
- ▼ -386.16%
- Current HPI
- 333.3367
- Rent YoY
- ▲ 2.37%
- Metro
- Stockton, CA
- State GDP YoY
- ▲ 3.21%
- F500 in state
- 116
Industry mix (Fortune 500 HQ in CA)
| Industry | F500 HQs | Revenue |
|---|---|---|
| Technology | 27 | $1,492B |
|
||
| Financial Services | 3 | $174B |
|
||
| Retail | 3 | $44B |
|
||
| Insurance | 3 | $26B |
|
||
| Media / Entertainment | 2 | $115B |
|
||
| Pharmaceuticals / Biotech | 2 | $62B |
|
||
Price history
1 event — show timeline
- 1998-08-20 Sold (Public Records) $75,000 Public Records
Property tax history
+1.8%/yrLatest (2025): $1,619 · +1.6% YoY. Source: county tax records.
Cash-flow waterfall
monthlySold comps — $/sqft
last 12 mo · ≤1 miLoading sold comps…