 🏷️ Likely Rental
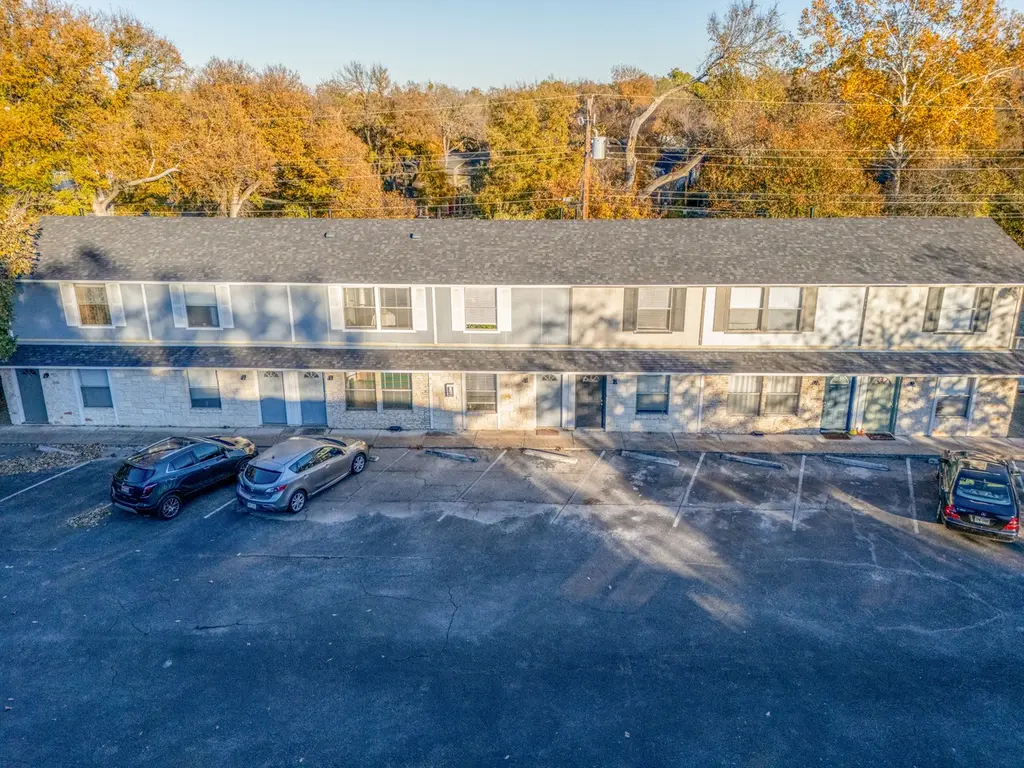
2005 Glen Allen St Unit 106, 107 · Austin, TX
Flood risk 1/10 · Minimal
- FEMA flood zone
- X (unshaded)
- Chance of flooding over 30 yrs
- 0.0%
- Est. flood insurance / yr
- $507 – $1,088
Fire risk 4/10 · Minor
- Est. fire insurance / yr
- $1,222 – $2,270
Heat risk 8/10 · Major
- Hot days now (above 108°F)
- 7 days/yr
- Hot days in 30 yrs
- 21 days/yr
Wind risk 8/10 · Major
- Chance of severe wind over 30 yrs
- 80.0%
Air-quality risk 2/10 · Minimal
- Unhealthy air days now
- 1 days/yr
- Unhealthy air days in 30 yrs
- 1 days/yr
Risk factors via First Street. Map © Google.
Why this score? — see what drove the D+ grade
The composite is a weighted blend of 9 inputs, each scored 0–100. Each bar is that input's sub-score; the figure is the points it added to the 100-point composite (weight × sub-score).
- Cash flow +16.2/30.0
- ARV discount +7.5/15.0
- 1% rule +5.9/10.0
- DSCR +5.0/10.0
- Livability +4.1/5.0
- Schools +3.4/10.0
- Condition / age +2.2/5.0
- Rent growth +1.9/5.0
- Appreciation +0.0/10.0
$310,000
🖨 Deal sheet 📄 Offer letter ✓ Due diligence
Listing remarks MLS
Investor opportunity in Austin’s coveted 78704. Offering a tenant-occupied 2-unit package (Units 106–107) within a 13-unit condominium community. Ideal for investors seeking immediate in-place cash flow and a long-term hold in a high-demand submarket. Both units are currently leased and are being marketed as a turnkey income bundle. Lease terms provide stability and reduced vacancy risk. Due to condominium characteristics and ownership concentration typical of small complexes, buyers should perform their own lender due diligence; cash preferred. Unit-level summary (buyer to verify): Unit 106: Annual tax $4,831.85 | HOA $354/mo | Rent $1,350/mo | Monthly charge $75/mo | Lease through 7/14/2025 Unit 107: Annual tax $4,965.63 | HOA $354/mo | Rent $1,385/mo | Monthly charge $150/mo | Lease through 10/31/2026 Monthly charges are additional income and reflect shared services billed separately from base rent (water/wastewater/trash/pest; assessed per occupancy). Tenants pay electricity. Do not disturb tenants. Showings by appointment only. Prefer access after executed contract, with inspections coordinated to minimize tenant disruption. Other sale structures may be considered (larger bundle or individual units), subject to terms. No seller financing. All information deemed reliable but not guaranteed; buyer to verify HOA, taxes, leases, and all financials.
Key facts
- 4,120 sq ft lot
- Parking
- Built 1976
Neighborhood map
What this means for you Summary
Snapshot
- This is a 4-bed/2.0-bath condo listed at $310k. Condition is rated fair.
Deal economics
- At list price, monthly cash flow is $165 ($2k/yr) — positive.
- The deal already cash-flows at list — no discount required.
- Meets the 1% rule at list price ($3k rent vs $310k).
- Recommended offer: $273k (12.0% below list) — sets the bar for market timing.
- Cap rate 6.9% vs local median 1.8% in Austin — top-decile yield for the area; either an underpriced asset or a hidden risk that comps aren't pricing in. Stress-test before assuming the spread holds.
Location & tenants
- Location reads 82/100 on livability (#16 in TX, #1,208 nationally) — a professional / high-income tenant draw. Strengths: amenities A+, commute A+, employment A+; Watch: cost of living D, crime F.
- Austin ISD (urban): math 33% / reading 44% proficiency, ranked #431 of 826 in TX (top 52%) — families likely to look elsewhere, expect single-tenant / working-renter base with shorter leases.
- Market conditions: Rents soft (-2.4%/yr); 521 active listings in the ZIP; 40 comparable units currently listed for rent nearby; rentals at typical pace (median 20d on market — plan ~3-4 weeks tenant-placement turnaround); solid renter incomes; 17,121 units permitted in Travis County in 2024 (11,963 in 5+ unit buildings).
- This rent runs 38% of the median local income ($107k/yr) — at the standard rent-burdened threshold; future hikes will face affordability resistance.
Forward outlook
- Local home prices are declining (-3.0%/yr); year-one equity from $2k of loan paydown is wiped out by about $9k of value loss. Plan a longer hold.
- Travis County population projected at +60% by 2050 — long-run rental-demand tailwind backs the buy-and-hold thesis.
Negotiation context
- It's been on market 144 days — a 12% lower offer ($273k) is reasonable based on typical stale-listing flexibility.
- 2 sale attempts with the ask held roughly flat each time — persistent listings suggest the price (not the market) is what's stuck; bring a comps-based counter.
Risks & watch-outs
- Climate carrying-cost: severe wind risk, 80% chance of damaging wind over 30y; extreme-heat days projected 7→21/yr by 2055 (HVAC capex compounding) — expect insurance premiums to compound above CPI over the hold.
Questions for the listing agent
- It's been on market 144 days. Have you received any prior offers? Is the seller open to a 12% concession, seller financing, or rate buy-down credit?
- Have any recent inspections been done? Can we get a copy of the seller's disclosures and any deferred-maintenance estimates?
- Built in 1976 — when were the roof, HVAC, electrical panel, plumbing, and water heater last replaced?
- What does the HOA fee cover, when was the last increase, and are there any pending special assessments or reserve-fund shortfalls?
- Any open or pending special assessments — roof, HVAC, plumbing, elevator, façade? What's the per-unit balance and payoff schedule, and is the seller paying it off at close or rolling it to the buyer?
- Why hasn't it sold? Are there any deal-killer items the seller is aware of (foundation, flood, title, zoning, code violations)?
- Is there a deadline driving the sale (1031 exchange, divorce, estate, relocation)? That informs how much negotiation room exists.
- Crime grade is F in this area — have there been break-ins, vandalism, or insurance claims at this property in the last 3 years? What carrier currently insures it and at what premium?
- The area grade is low — what's the realistic commute time and amenity access for the typical tenant pool here? Any planned neighborhood developments (good or bad) we should know about?
- What's the average days-on-market for RENTAL listings here right now (not sales)? A rising rental-DOM trend means longer vacancies and softer asking-rent achievability than the comps imply.
- What's the recent tenant-quality profile in this submarket — average credit score on applications, eviction rate, late-payment / NSF rate, and stable-employment percentage? A property-management company in the area should have these aggregated.
- How much new apartment / multifamily construction is in the pipeline within 1–3 miles? Heavy new supply (>2% of stock underway) typically softens rents 12–24 months out; light construction supports rent growth.
Investment metrics
- 1% rule
- 1.09% ✓
- Cap rate
- 6.93%
- Cash-on-cash
- 2.28%
- DSCR
- 1.10
- GRM
- 7.7
CMA / ARV
- ARV (median comp)
- $645,252
- List price
- $310,000
- Delta
- -51.96%
- Verdict
- UNDERPRICED
- Comps
- 2 within 1.0 mi
Show comp detail 2 sales within ~0.75 mi
| Address | Dist | Beds/Ba | Sqft | Sold | Price | $/sf | Match |
|---|---|---|---|---|---|---|---|
| 1408 Valleyridge Dr Unit A & B | 0.51mi | 4/2.0 | 1,768 (+14%) | 2mo | $699,000 | $395 | 51 |
| 1404 Valleyridge Dr Unit A & B | 0.54mi | 4/2.0 | 1,776 (+14%) | 10mo | $595,000 | $335 | 43 |
Match score weights: distance 35% · size 25% · config 20% · recency 20%. Top-matched comps best support the ARV.
Projected returns pro-forma
-3.0% appreciation · 0.0% rent growth · sell at horizon
- IRR
- -16.6%
- Equity multiple
- 0.43×
- Total profit
- $-49,328
- Equity at exit
- $46,222
- IRR
- -16.3%
- Equity multiple
- 0.23×
- Total profit
- $-66,485
- Equity at exit
- $26,803
Cash invested: $86,800 (down + closing). Projections, not guarantees.
Landlord ↔ Tenant lean methodology
- Overall (STATE)
- 87 Strongly Landlord-Friendly
- State Texas
- 87 Strongly Landlord-Friendly · R+5
- County
- — inherits STATE
- City
- — inherits STATE
ZIP-level market 78704
- Rents YoY
- -2.4%
- Active inventory
- 521
- Price-to-rent
- 7.7×
Monthly cashflow live
- Estimated rent
- $3,369 high interval (Pro) →
- Mortgage (P&I)
- −$1,626
- Tax est. 1.5%
- −$388 /mo · $4,650/yr
- Insurance
- −$129
- HOA
- −$354
- Vacancy / Maint / Mgmt
- −$707
- Net cashflow
- $165
Break-even live
UW: 25.0% down · 7.5% · 30yr · 1.5% tax · 5.0% vac · 8.0% maint · 8.0% mgmt
Financing live
Cash to close
- Down payment
- $77,500
- Closing costs
- $9,300
- Reserves months
- —
- Total cash needed
- —
Loan-product check · same deal, 3 products live
Conventional
25% down · 7.5% · 30yr
- Down + closing
- —
- Monthly P&I
- —
- Monthly cashflow
- —
- DSCR
- —
- Eligible?
- —
Personal DTI + credit; lowest rate.
DSCR
20% down · 8.5% · 30yr
- Down + closing
- —
- Monthly P&I
- —
- Monthly cashflow
- —
- DSCR
- —
- Eligible?
- —
No personal income docs; deal must DSCR.
Hard money
10% down · 12.0% · 12mo
- Down + closing
- —
- Monthly P&I
- —
- Monthly cashflow
- —
- DSCR
- —
- Eligible?
- —
Short-term bridge; refi at stabilization.
Rent comps 40 comps
| Address | Beds | Baths | Sqft | Rent | $/sqft | DOM | Units | Dist |
|---|---|---|---|---|---|---|---|---|
| 3500 Larchmont Cv Unit B Austin, TX | 3.0 | 2.5 | 1188 | $2,495 | $2.10 | 14d | 1 | 0.15mi |
| 3713 Menchaca Rd Unit A Austin, TX | 3.0 | 2.0 | 1100 | $1,895 | $1.72 | 4d | 1 | 0.38mi |
| 3402 S Oak Dr Unit B Austin, TX | 3.0 | 1.5 | 1150 | $1,895 | $1.65 | 23d | 1 | 0.40mi |
| 3402 S Oak Dr Unit B Austin, TX | 3.0 | 1.5 | 1100 | $1,950 | $1.77 | 43d | 1 | 0.40mi |
| 2520 Bluebonnet Ln Austin, TX | 3.0 | 3.5 | 2174 | $4,000 | $1.84 | 12d | 1 | 0.41mi |
| 3503 Southridge Dr Unit B Austin, TX | 3.0 | 1.5 | 1868 | $1,775 | $0.95 | 43d | 1 | 0.43mi |
| 2709 Rae Dell Ave Austin, TX | 3.0 | 2.0 | 1372 | $3,495 | $2.55 | 23d | 1 | 0.43mi |
| 2709 Rae Dell Ave Austin, TX | 3.0 | 2.0 | 1372 | $3,495 | $2.55 | 20d | 1 | 0.43mi |
| 3808 Menchaca Rd Austin, TX | 3.0 | 2.0 | 1298 | $2,950 | $2.27 | 4d | 1 | 0.44mi |
| 2520 Bluebonnet Ln #40 Austin, TX | 3.0 | 3.5 | 2219 | $4,200 | $1.89 | 23d | 1 | 0.45mi |
| 3809 Valley View Rd #10 Austin, TX | 3.0 | 3.5 | 1777 | $3,850 | $2.17 | 14d | 1 | 0.49mi |
| 3809 Valley View Rd Austin, TX | 3.0 | 3.5 | 1795 | $3,848 | $2.14 | 21d | 2 | 0.49mi |
| 3809 Valley View Rd Austin, TX | 3.0 | 3.5 | 1795 | $3,848 | $2.14 | 16d | 2 | 0.49mi |
| 2212 Iva Ln Unit A Austin, TX | 3.0 | 2.5 | 1722 | $3,695 | $2.15 | 43d | 1 | 0.59mi |
| 2404 Thornton Rd Unit A Austin, TX | 4.0 | 3.0 | 2056 | $3,500 | $1.70 | 43d | 1 | 0.60mi |
| 3112 Corbin Ln Austin, TX | 3.0 | 3.0 | 1750 | $4,850 | $2.77 | 43d | 1 | 0.61mi |
| 2910 Cedarview Dr Austin, TX | 3.0 | 2.0 | 2228 | $5,500 | $2.47 | 43d | 1 | 0.62mi |
| 2801 Cedarview Dr Unit B Austin, TX | 3.0 | 3.0 | 1156 | $3,500 | $3.03 | 23d | 1 | 0.65mi |
| 2126 Goodrich Ave Unit 2159 Austin, TX | 3.0 | 2.0 | 1202 | $1,672 | $1.39 | 3d | 1 | 0.67mi |
| 4022 Valley View Rd Unit 2C Austin, TX | 3.0 | 3.5 | 1793 | $4,900 | $2.73 | 43d | 1 | 0.68mi |
| 3700 Garden Villa Ln #1 Austin, TX | 3.0 | 2.0 | 1681 | $4,000 | $2.38 | 43d | 1 | 0.84mi |
| 2105 Goodrich Ave #2 Austin, TX | 4.0 | 2.5 | 2146 | $8,000 | $3.73 | 14d | 1 | 0.84mi |
| 1207 Fieldcrest Dr Austin, TX | 3.0 | 2.0 | 1417 | $3,350 | $2.36 | 20d | 1 | 0.85mi |
| 903 Cardinal Ln Unit A Austin, TX | 3.0 | 2.5 | 2036 | $4,400 | $2.16 | 23d | 1 | 0.93mi |
| 3505 Villa Ct #10 Austin, TX | 4.0 | 3.0 | 1719 | $4,250 | $2.47 | 14d | 1 | 0.93mi |
| 4409 Merle Dr Austin, TX | 3.0 | 1.0 | 1144 | $1,995 | $1.74 | 43d | 1 | 0.95mi |
| 3602 S 2nd St Austin, TX | 3.0 | 2.5 | 1766 | $4,600 | $2.60 | 23d | 1 | 0.98mi |
| 1303 Casey St Unit A Austin, TX | 3.0 | 2.5 | 1426 | $2,700 | $1.89 | 14d | 1 | 1.06mi |
| 1303 Casey St Unit A Austin, TX | 3.0 | 2.5 | 1426 | $2,500 | $1.75 | 4d | 1 | 1.06mi |
| 1217 W Mary St Unit 1250 Austin, TX | 3.0 | 2.0 | 1460 | $2,127 | $1.46 | 3d | 1 | 1.07mi |
| 2314 S 5th St Austin, TX | 3.0 | 2.5 | 1757 | $4,200 | $2.39 | 4d | 1 | 1.07mi |
| 4604 Nevada Path Austin, TX | 3.0 | 3.0 | 1935 | $4,000 | $2.07 | 21d | 1 | 1.15mi |
| 2804 S 1st St #2106 Austin, TX | 3.0 | 3.0 | 1768 | $4,300 | $2.43 | 4d | 1 | 1.16mi |
| 1735 Spyglass Dr #117 Austin, TX | 3.0 | 2.0 | 1576 | $4,500 | $2.86 | 43d | 1 | 1.19mi |
| 1700 Barton Hills Dr Austin, TX | 3.0 | 2.0 | 1720 | $5,995 | $3.49 | 17d | 1 | 1.29mi |
| 4707 Menchaca Rd Austin, TX | 3.0 | 1.0 | 1093 | $2,295 | $2.10 | 4d | 1 | 1.29mi |
| 609 Fletcher St Austin, TX | 3.0 | 2.0 | 1608 | $4,500 | $2.80 | 23d | 1 | 1.36mi |
| 3705 Wilson St Austin, TX | 4.0 | 3.0 | 2212 | $6,250 | $2.83 | 2d | 1 | 1.38mi |
| 2301 S Mopac Expy Austin, TX | 1.0–3.0 | 1.0–2.0 | 994 | $2,672 | $2.69 | 2d | 36 | 1.40mi |
| 2001 S Mopac Expy Austin, TX | 1.0–3.0 | 1.0–3.0 | 1191 | $3,280 | $2.75 | 1d | 19 | 1.41mi |
HOA detail condo
- Monthly dues
- $354 · $4,248/yr
- Likely covers
- watertrashelectric
- Assessments
- None detected in remarks — confirm with the listing agent.
Listing history 16 events
-
2026-06-18days on market $310,000 Active 144 DOM
-
2026-06-17days on market $310,000 Active 143 DOM
-
2026-06-16days on market $310,000 Active 142 DOM
-
2026-06-15days on market $310,000 Active 141 DOM
-
2026-06-13days on market $310,000 Active 139 DOM
-
2026-06-09days on market $310,000 Active 135 DOM
-
2026-06-08days on market $310,000 Active 134 DOM
-
2026-06-07days on market $310,000 Active 133 DOM
-
2026-06-05days on market $310,000 Active 130 DOM
-
2026-06-03days on market $310,000 Active 129 DOM
-
2026-06-02days on market $310,000 Active 128 DOM
-
2026-06-01days on market $310,000 Active 127 DOM
-
2026-05-31days on market $310,000 Active 126 DOM
-
2026-03-06status Active 1384-char remark
Show marketing remark (1384 chars)
Investor opportunity in Austin’s coveted 78704. Offering a tenant-occupied 2-unit package (Units 106–107) within a 13-unit condominium community. Ideal for investors seeking immediate in-place cash flow and a long-term hold in a high-demand submarket. Both units are currently leased and are being marketed as a turnkey income bundle. Lease terms provide stability and reduced vacancy risk. Due to condominium characteristics and ownership concentration typical of small complexes, buyers should perform their own lender due diligence; cash preferred. Unit-level summary (buyer to verify): Unit 106: Annual tax $4,831.85 | HOA $354/mo | Rent $1,350/mo | Monthly charge $75/mo | Lease through 7/14/2025 Unit 107: Annual tax $4,965.63 | HOA $354/mo | Rent $1,385/mo | Monthly charge $150/mo | Lease through 10/31/2026 Monthly charges are additional income and reflect shared services billed separately from base rent (water/wastewater/trash/pest; assessed per occupancy). Tenants pay electricity. Do not disturb tenants. Showings by appointment only. Prefer access after executed contract, with inspections coordinated to minimize tenant disruption. Other sale structures may be considered (larger bundle or individual units), subject to terms. No seller financing. All information deemed reliable but not guaranteed; buyer to verify HOA, taxes, leases, and all financials.
-
2026-02-24historical Active Under Contract 1384-char remark
Show marketing remark (1384 chars)
Investor opportunity in Austin’s coveted 78704. Offering a tenant-occupied 2-unit package (Units 106–107) within a 13-unit condominium community. Ideal for investors seeking immediate in-place cash flow and a long-term hold in a high-demand submarket. Both units are currently leased and are being marketed as a turnkey income bundle. Lease terms provide stability and reduced vacancy risk. Due to condominium characteristics and ownership concentration typical of small complexes, buyers should perform their own lender due diligence; cash preferred. Unit-level summary (buyer to verify): Unit 106: Annual tax $4,831.85 | HOA $354/mo | Rent $1,350/mo | Monthly charge $75/mo | Lease through 7/14/2025 Unit 107: Annual tax $4,965.63 | HOA $354/mo | Rent $1,385/mo | Monthly charge $150/mo | Lease through 10/31/2026 Monthly charges are additional income and reflect shared services billed separately from base rent (water/wastewater/trash/pest; assessed per occupancy). Tenants pay electricity. Do not disturb tenants. Showings by appointment only. Prefer access after executed contract, with inspections coordinated to minimize tenant disruption. Other sale structures may be considered (larger bundle or individual units), subject to terms. No seller financing. All information deemed reliable but not guaranteed; buyer to verify HOA, taxes, leases, and all financials.
-
2026-01-25$310,000 Active 1384-char remark
Show marketing remark (1384 chars)
Investor opportunity in Austin’s coveted 78704. Offering a tenant-occupied 2-unit package (Units 106–107) within a 13-unit condominium community. Ideal for investors seeking immediate in-place cash flow and a long-term hold in a high-demand submarket. Both units are currently leased and are being marketed as a turnkey income bundle. Lease terms provide stability and reduced vacancy risk. Due to condominium characteristics and ownership concentration typical of small complexes, buyers should perform their own lender due diligence; cash preferred. Unit-level summary (buyer to verify): Unit 106: Annual tax $4,831.85 | HOA $354/mo | Rent $1,350/mo | Monthly charge $75/mo | Lease through 7/14/2025 Unit 107: Annual tax $4,965.63 | HOA $354/mo | Rent $1,385/mo | Monthly charge $150/mo | Lease through 10/31/2026 Monthly charges are additional income and reflect shared services billed separately from base rent (water/wastewater/trash/pest; assessed per occupancy). Tenants pay electricity. Do not disturb tenants. Showings by appointment only. Prefer access after executed contract, with inspections coordinated to minimize tenant disruption. Other sale structures may be considered (larger bundle or individual units), subject to terms. No seller financing. All information deemed reliable but not guaranteed; buyer to verify HOA, taxes, leases, and all financials.
ⓘ Source: listings_history table (triggers on properties + properties_extension) + one-shot
backfill from property_details.listing_events for pre-trigger history.
Climate risk First Street
- Flood 1/10 Low FEMA zone X (unshaded) · 0% chance over 30 yrs
- Wildfire 4/10 Moderate
- Heat 8/10 Severe 7 d/yr ≥108°F today · 21 d/yr by 30 yrs out
- Wind 8/10 Severe 80% chance of damaging wind over 30 yrs
- Air quality 2/10 Low 1 unhealthy d/yr today · 1 by 30 yrs out
Nearby sold comps map
Loading sold comps map…
Walkable amenities ~0.75 mi
Loading nearby amenities…
Taxation est. · year 1
- Rental income
- $40,425
- − Mortgage interest
- −$17,365
- − Property taxes
- −$4,650
- − Insurance
- −$1,550
- − Repairs & maintenance
- −$3,234
- − Management
- −$3,234
- − HOA
- −$4,248
- − Depreciation
- −$9,018
- Taxable loss
- −$2,874
- Est. tax savings @ 24.0%
- +$690
- After-tax cash flow
- $2,670/yr
For passive investors: Depreciation is non-cash, so a rental often shows a tax loss while cash-flowing — sheltering income. Rental losses are passive: they offset passive income freely, and up to $25,000/yr can offset ordinary (W-2) income if you actively participate and your MAGI is under $100k (phasing out to $0 by $150k); unused losses carry forward. On sale, claimed depreciation is recaptured at up to 25%, and gains may owe capital-gains tax (a 1031 exchange can defer both). Figures are a year-1 estimate at your 24.0% rate — not tax advice; consult a CPA.
Condition & rehab AI · 8 photos
This multi-family property requires moderate repairs and maintenance, including painting, replacing windows, and exterior siding. The home is currently tenant-occupied and has the potential to be a good investment with the right updates.
Repairs flagged
- Major Roof — Further inspection is recommended to assess the condition of the roof.
- Major Exterior siding — Further inspection is recommended to assess the condition of the exterior siding.
- Major Windows — Further inspection is recommended to assess the condition of the windows.
Value-add opportunities
- Resale Paint interior walls — Fresh paint can enhance the appearance of the interior and make the home more appealing to potential buyers.
- Rental Replace windows — New windows can improve energy efficiency and reduce heating and cooling costs, making the home more attractive to renters.
- Both Replace exterior siding — A new exterior siding can improve the home's curb appeal and increase its overall value.
Renovation cost estimate screening
| Repair item | Severity | Est. cost |
|---|---|---|
| Roof · Further inspection is recommended to assess the condition of the roof. | Major | $15,000–50,000 |
| Exterior siding · Further inspection is recommended to assess the condition of the exterior siding. | Major | $15,000–50,000 |
| Windows · Further inspection is recommended to assess the condition of the windows. | Major | $15,000–50,000 |
| Total estimated repair cost · 3 items | $45,000–150,000 |
Value-add ROI direction
- Resale Paint interior walls — Fresh paint can enhance the appearance of the interior and make the home more appealing to potential buyers. ↑
- Rental Replace windows — New windows can improve energy efficiency and reduce heating and cooling costs, making the home more attractive to renters. ↑
- Both Replace exterior siding — A new exterior siding can improve the home's curb appeal and increase its overall value. ↑
ⓘ Cost ranges are severity-bucket heuristics (US national rule-of-thumb). Get contractor quotes + a written scope before underwriting a rehab budget.
Schools (NCES district)
- District
- Austin ISD
- NCES district ID
- 4808940
- Math proficiency
- 33% ▼ -19.00%
- Reading proficiency
- 44% ▼ -7.00%
- Median HH income
- $54,627
- Composite
- 33.65/100
- National rank
- #5397
- State rank
- #431 of 826 in TX
Livability — Austin
- Score
- 82/100
- State rank
- #16
- US rank
- #1208
Category grades
Schools grade is shown separately in the Schools card above.
Census & demographics
- Census place
- Austin, TX
- County
- Travis County · 1,299,254 people
- City population
- 1,066,854
- Metro
- Austin-Round Rock-Georgetown, TX
- Population (ZIP)
- 50,688
- Household income
- $106,897
- Rent vs Own
- Severe rent burden
- 3283.0
Population outlook (Travis County) Hauer SSP2
- Today (2025)
- 1,545,133 people
- By 2030
- 1,729,269 · +11.9%
- By 2040
- 2,097,596 · +35.8%
- By 2050
- 2,463,890 · +59.5%
- By 2075
- 3,249,374 · +110.3%
- By 2100
- 3,801,868 · +146.1%
Race, ethnicity, and origin ACS 2023
- Neighborhood character
- Diverse neighborhood (Simpson 0.56)
- Race & ethnicity
- White 62% Hispanic / Latino 24% Two or more races 15% Asian 4% Black 3%
- Hispanic origin (detail)
- Mexican 18%
- Common ancestry
- Lithuanian 4% Romanian 2% Italian 2%
- Foreign-born
- 12% · Canada, China, South Korea
- Languages at home
- 79% English-only · Spanish 16% Other Indo-European 1% German/W. Germanic 1%
Political lean MEDSL · Travis
- 2024 margin
- Solid D (+39.3) · D 68.8% · R 29.4% · Other 1.8%
- 2008→2024 swing
- +9.9pp toward D · 2008: 29.4pp · 2024: 39.3pp
- All cycles
- 2024: D+39.3 2020: D+45.0 2016: D+38.9 2012: D+23.9 2008: D+29.4
Not yet ingested
- Civics
- —
Market trends
- HPI YoY
- ▼ -1348.92%
- Current HPI
- 291.6793
- Rent YoY
- ▼ -2.41%
- Metro
- Austin-Round Rock-Georgetown, TX
- State GDP YoY
- ▲ 3.95%
- F500 in state
- 110
Industry mix (Fortune 500 HQ in TX)
| Industry | F500 HQs | Revenue |
|---|---|---|
| Energy | 16 | $1,198B |
|
||
| Technology | 5 | $198B |
|
||
| Engineering / Construction | 4 | $72B |
|
||
| Energy Services | 3 | $60B |
|
||
| Utilities | 3 | $41B |
|
||
| Healthcare | 2 | $330B |
|
||
Price history
3 events — show timeline
- 2026-03-06 Relisted — Unlock MLS
- 2026-02-24 Contingent — Unlock MLS
- 2026-01-25 Listed $310,000 Unlock MLS
Cash-flow waterfall
monthlySold comps — $/sqft
last 12 mo · ≤1 miLoading sold comps…