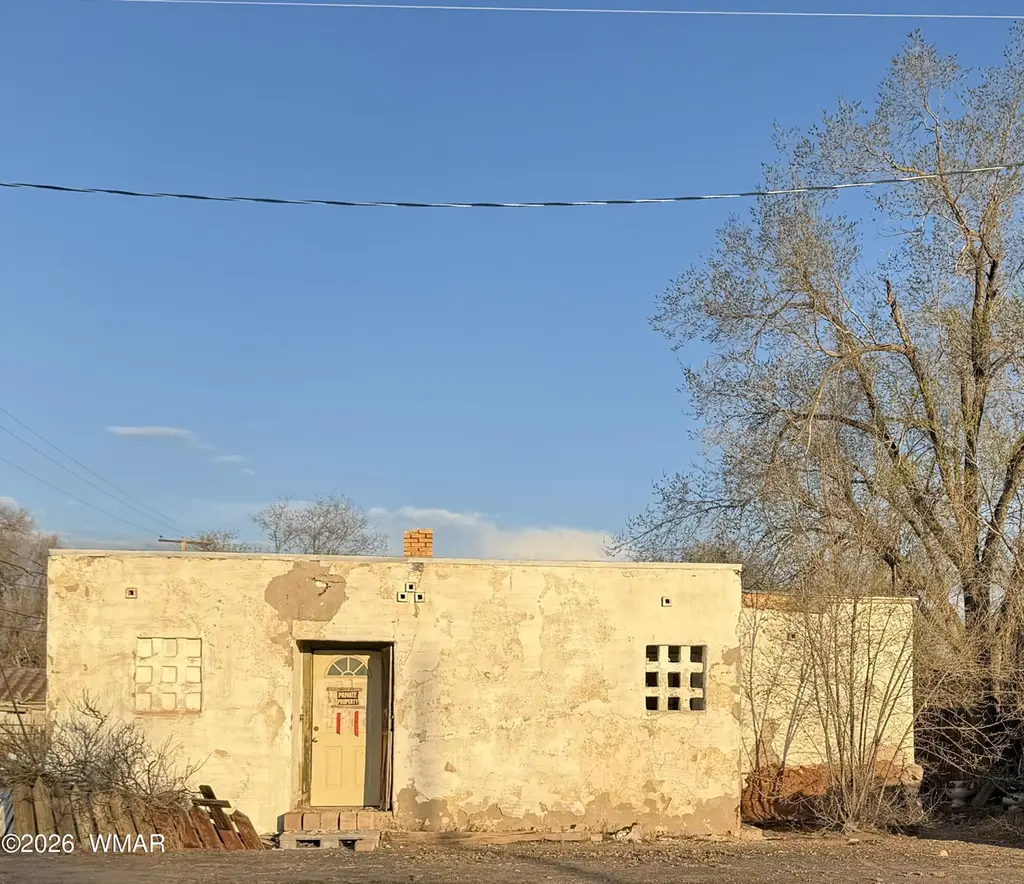
352 N 5th Ave · Holbrook, AZ
Flood risk 1/10 · Minimal
- FEMA flood zone
- X
- Chance of flooding over 30 yrs
- 0.0%
- Est. flood insurance / yr
- $507 – $1,088
Fire risk 1/10 · Minimal
- Est. fire insurance / yr
- $610 – $1,132
Heat risk 4/10 · Minor
- Hot days now (above 96°F)
- 6 days/yr
- Hot days in 30 yrs
- 14 days/yr
Wind risk 1/10 · Minimal
- Chance of severe wind over 30 yrs
- —
Air-quality risk 1/10 · Minimal
- Unhealthy air days now
- 0 days/yr
- Unhealthy air days in 30 yrs
- 0 days/yr
Risk factors via First Street. Map © Google.
Why this score? — see what drove the B+ grade
The composite is a weighted blend of 9 inputs, each scored 0–100. Each bar is that input's sub-score; the figure is the points it added to the 100-point composite (weight × sub-score).
- Cash flow +30.0/30.0
- 1% rule +10.0/10.0
- DSCR +10.0/10.0
- Appreciation +9.0/10.0
- ARV discount +7.5/15.0
- Livability +3.4/5.0
- Rent growth +2.5/5.0
- Schools +1.7/10.0
- Condition / age +1.0/5.0
$44,900
🖨 Deal sheet 📄 Offer letter ✓ Due diligence
Listing remarks MLS
Spacious lot with access from 5th Ave and Arizona and alley access ... Spacius structure with garage ... Offered in current & present ''as-is'' with no warranties as to habitability. Buyer to verify all material facts during the inspection period.
Key facts
- 0.25 acre lot
- Garage
- Built 1963
Neighborhood map
What this means for you Summary
Snapshot
- This is a 3-bed/1.0-bath single-family listed at $45k. Condition is rated poor.
Deal economics
- At list price, monthly cash flow is $896 ($11k/yr) — positive.
- The deal already cash-flows at list — no discount required.
- Meets the 1% rule at list price ($2k rent vs $45k).
- Recommended offer: $41k (9.0% below list) — sets the bar for market timing.
Location & tenants
- Location reads 68/100 on livability (#57 in AZ) — a middle-class / working-renter tenant base. Strengths: cost of living A+, housing A+, health & safety A+; Watch: schools C-, employment D+, crime D-.
- Holbrook Unified District (4389) (town): math 16% / reading 25% proficiency, ranked #185 of 249 in AZ (top 74%) — low school quality limits family demand, transient renter base, plan for 1-2y turnover; 67% free/reduced lunch — lower-income household profile, screen leases tightly.
- Market conditions: 45 active listings in the ZIP; 485 units permitted in Navajo County in 2024 (11 in 5+ unit buildings).
Forward outlook
- In year one you build about $4k of equity ($310 loan paydown + $4k appreciation (8.0% local appreciation)).
- Navajo County population projected at -16% by 2050 — secular population decline; favor cash flow + early exit over multi-decade hold.
- At projected returns (8.0% appreciation + 3.0% rent growth), your $13k cash investment doubles in ~1 year — after that, you're playing with house money.
- By year 8, paydown + projected appreciation supports a ~$32k cash-out refi (75% LTV) — recoverable capital for the next deal without selling this one.
Negotiation context
- It's been on market 98 days — a 9% lower offer ($41k) is reasonable based on typical stale-listing flexibility.
Questions for the listing agent
- It's been on market 98 days. Have you received any prior offers? Is the seller open to a 9% concession, seller financing, or rate buy-down credit?
- Have any recent inspections been done? Can we get a copy of the seller's disclosures and any deferred-maintenance estimates?
- Built in 1963 — when were the roof, HVAC, electrical panel, plumbing, and water heater last replaced?
- Why hasn't it sold? Are there any deal-killer items the seller is aware of (foundation, flood, title, zoning, code violations)?
- Is there a deadline driving the sale (1031 exchange, divorce, estate, relocation)? That informs how much negotiation room exists.
- Crime grade is D in this area — have there been break-ins, vandalism, or insurance claims at this property in the last 3 years? What carrier currently insures it and at what premium?
- What's the average days-on-market for RENTAL listings here right now (not sales)? A rising rental-DOM trend means longer vacancies and softer asking-rent achievability than the comps imply.
- What's the recent tenant-quality profile in this submarket — average credit score on applications, eviction rate, late-payment / NSF rate, and stable-employment percentage? A property-management company in the area should have these aggregated.
- How much new for-sale + rental construction is in the pipeline within 1–3 miles? Heavy new supply typically softens prices + rents 12–24 months out; constrained supply supports both.
Investment metrics
- 1% rule
- 3.39% ✓
- Cap rate
- 30.25%
- Cash-on-cash
- 85.54%
- DSCR
- 4.81
- GRM
- 2.5
CMA / ARV
- ARV (median comp)
- $217,642
- List price
- $44,900
- Delta
- -79.37%
- Verdict
- UNDERPRICED
- Comps
- 20 within 1.0 mi
Show comp detail 10 sales within ~0.75 mi
| Address | Dist | Beds/Ba | Sqft | Sold | Price | $/sf | Match |
|---|---|---|---|---|---|---|---|
| 814 W Erie St | 0.26mi | 4/2.0 (+1) | 2,226 (+2%) | 22mo | $150,000 | $67 | 58 |
| 320 W Florida St | 0.25mi | 3/2.0 | 1,998 (-9%) | 16mo | $250,000 | $125 | 57 |
| 1302 W Florida St | 0.58mi | 3/2.0 | 2,267 (+4%) | 10mo | $357,500 | $158 | 54 |
| 916 N 7Th Ave | 0.34mi | 3/1.3 | 2,005 (-8%) | 21mo | $235,000 | $117 | 51 |
| 138 La Jolla Dr | 0.40mi | 4/2.0 (+1) | 2,159 (-1%) | 24mo | $399,000 | $185 | 50 |
| 207 W Buffalo St | 0.25mi | 4/2.0 (+1) | 1,971 (-10%) | 18mo | $240,000 | $122 | 48 |
| 1219 W Florida St | 0.53mi | 3/2.0 | 2,486 (+14%) | 3mo | $249,500 | $100 | 46 |
| 401 W Romero St | 0.69mi | 4/2.0 (+1) | 2,101 (-4%) | 14mo | $325,000 | $155 | 40 |
| 1313 W Erie St | 0.59mi | 3/2.0 | 1,880 (-14%) | 6mo | $237,500 | $126 | 40 |
| 418 E Hampshire St | 0.69mi | 4/2.0 (+1) | 2,011 (-8%) | 19mo | $295,000 | $147 | 29 |
Match score weights: distance 35% · size 25% · config 20% · recency 20%. Top-matched comps best support the ARV.
Projected returns pro-forma
8.03% appreciation · 3.0% rent growth · sell at horizon
- IRR
- 93.5%
- Equity multiple
- 7.02×
- Total profit
- $75,683
- Equity at exit
- $34,204
- IRR
- 89.8%
- Equity multiple
- 15.10×
- Total profit
- $177,222
- Equity at exit
- $67,982
Cash invested: $12,572 (down + closing). Projections, not guarantees.
Landlord ↔ Tenant lean methodology
- Overall (STATE)
- 87 Strongly Landlord-Friendly
- State Arizona
- 87 Strongly Landlord-Friendly · R+3
- County
- — inherits STATE
- City
- — inherits STATE
ZIP-level market 86025
- Home prices YoY
- 2.9%
- Active inventory
- 45
- Price-to-rent
- 2.5×
Monthly cashflow live
- Estimated rent
- $1,521 medium interval (Pro) →
- Mortgage (P&I)
- −$235
- Tax from tax record
- −$52 /mo · $619/yr
- Insurance
- −$19
- HOA
- −$0
- Vacancy / Maint / Mgmt
- −$320
- Net cashflow
- $896
Break-even live
UW: 25.0% down · 7.5% · 30yr · 1.5% tax · 5.0% vac · 8.0% maint · 8.0% mgmt
Financing live
Cash to close
- Down payment
- $11,225
- Closing costs
- $1,347
- Reserves months
- —
- Total cash needed
- —
Loan-product check · same deal, 3 products live
Conventional
25% down · 7.5% · 30yr
- Down + closing
- —
- Monthly P&I
- —
- Monthly cashflow
- —
- DSCR
- —
- Eligible?
- —
Personal DTI + credit; lowest rate.
DSCR
20% down · 8.5% · 30yr
- Down + closing
- —
- Monthly P&I
- —
- Monthly cashflow
- —
- DSCR
- —
- Eligible?
- —
No personal income docs; deal must DSCR.
Hard money
10% down · 12.0% · 12mo
- Down + closing
- —
- Monthly P&I
- —
- Monthly cashflow
- —
- DSCR
- —
- Eligible?
- —
Short-term bridge; refi at stabilization.
Listing history 16 events
-
2026-06-17status $44,900 Pending 98 DOM
-
2026-06-17days on market $44,900 Active 98 DOM
-
2026-06-16days on market $44,900 Active 97 DOM
-
2026-06-15days on market $44,900 Active 96 DOM
-
2026-06-14days on market $44,900 Active 94 DOM
-
2026-06-12days on market $44,900 Active 93 DOM
-
2026-06-09days on market $44,900 Active 90 DOM
-
2026-06-08days on market $44,900 Active 89 DOM
-
2026-06-07days on market $44,900 Active 88 DOM
-
2026-06-05days on market $44,900 Active 86 DOM
-
2026-06-04days on market $44,900 Active 84 DOM
-
2026-06-02days on market $44,900 Active 83 DOM
-
2026-06-01days on market $44,900 Active 82 DOM
-
2026-05-31days on market $44,900 Active 81 DOM
-
2026-05-31days on market $44,900 Active 80 DOM
-
2026-03-11$44,900 Active 251-char remark
Show marketing remark (251 chars)
Spacious lot with access from 5th Ave and Arizona and alley access ... Spacius structure with garage ... Offered in current & present ''as-is'' with no warranties as to habitability. Buyer to verify all material facts during the inspection period.
ⓘ Source: listings_history table (triggers on properties + properties_extension) + one-shot
backfill from property_details.listing_events for pre-trigger history.
Tax reassessment forecast AZ · Resets to sale price
- Current annual tax
- $619 · $52/mo
- Projected year-2 tax
- $619 · $52/mo
- Expected delta
- $0/yr ($0/mo · 0.0%)
ⓘ Screening estimate from a state-policy table — verify with the county assessor before closing.
Climate risk First Street
- Flood 1/10 Low FEMA zone X · 0% chance over 30 yrs
- Wildfire 1/10 Low
- Heat 4/10 Moderate 6 d/yr ≥96°F today · 14 d/yr by 30 yrs out
- Wind 1/10 Low
- Air quality 1/10 Low 0 unhealthy d/yr today · 0 by 30 yrs out
Nearby sold comps map
Loading sold comps map…
Walkable amenities ~0.75 mi
Loading nearby amenities…
Taxation est. · year 1
- Rental income
- $18,258
- − Mortgage interest
- −$2,515
- − Property taxes
- −$619
- − Insurance
- −$224
- − Repairs & maintenance
- −$1,461
- − Management
- −$1,461
- − Depreciation
- −$1,306
- Taxable income
- $10,672
- Est. tax owed @ 24.0%
- −$2,561
- After-tax cash flow
- $8,193/yr
For passive investors: Depreciation is non-cash, so a rental often shows a tax loss while cash-flowing — sheltering income. Rental losses are passive: they offset passive income freely, and up to $25,000/yr can offset ordinary (W-2) income if you actively participate and your MAGI is under $100k (phasing out to $0 by $150k); unused losses carry forward. On sale, claimed depreciation is recaptured at up to 25%, and gains may owe capital-gains tax (a 1031 exchange can defer both). Figures are a year-1 estimate at your 24.0% rate — not tax advice; consult a CPA.
Condition & rehab AI · 3 photos
This property requires extensive repairs and improvements to become habitable and attractive for resale or rental. Immediate focus should be on the roof, exterior walls, and foundation.
Repairs flagged
- Major Exterior walls — Severe wear and missing siding
- Major Roof — Exposed roof structure
- Major Foundation — Cracked and uneven concrete
- Major Exterior siding — Missing and worn
Value-add opportunities
- Both Landscaping and curb appeal improvements — Enhances property's visual appeal and could attract more buyers
- Both Roof replacement — Critical to the home's structural integrity and safety
- Both Exterior wall repairs and siding replacement — Improves the home's appearance and structural stability
- Both Foundation repair — Stabilizes the structure and prevents further damage
Renovation cost estimate screening
| Repair item | Severity | Est. cost |
|---|---|---|
| Exterior walls · Severe wear and missing siding | Major | $15,000–50,000 |
| Roof · Exposed roof structure | Major | $15,000–50,000 |
| Foundation · Cracked and uneven concrete | Major | $15,000–50,000 |
| Exterior siding · Missing and worn | Major | $15,000–50,000 |
| Total estimated repair cost · 4 items | $60,000–200,000 |
Value-add ROI direction
- Both Landscaping and curb appeal improvements — Enhances property's visual appeal and could attract more buyers ↑
- Both Roof replacement — Critical to the home's structural integrity and safety ↑
- Both Exterior wall repairs and siding replacement — Improves the home's appearance and structural stability ↑
- Both Foundation repair — Stabilizes the structure and prevents further damage ↑
ⓘ Cost ranges are severity-bucket heuristics (US national rule-of-thumb). Get contractor quotes + a written scope before underwriting a rehab budget.
Schools (NCES district)
- District
- Holbrook Unified District (4389)
- NCES district ID
- 0403820
- Math proficiency
- 16% ▼ -13.00%
- Reading proficiency
- 25% ▼ -10.00%
- Median HH income
- $34,437
- Composite
- 16.81/100
- National rank
- #9153
- State rank
- #185 of 249 in AZ
Livability — Holbrook
- Score
- 68/100
- State rank
- #57
- US rank
- #9938
Category grades
Schools grade is shown separately in the Schools card above.
Census & demographics
- Census place
- Holbrook, AZ
- Population (ZIP)
- 5,189
Population outlook (Navajo County) Hauer SSP2
- Today (2025)
- 105,760 people
- By 2030
- 103,301 · -2.3%
- By 2040
- 97,070 · -8.2%
- By 2050
- 88,850 · -16.0%
- By 2075
- 65,180 · -38.4%
- By 2100
- 37,281 · -64.7%
Race, ethnicity, and origin ACS 2023
- Neighborhood character
- Highly diverse neighborhood (Simpson 0.81)
- Race & ethnicity
- Native American 33% White 33% Hispanic / Latino 29% Two or more races 7% Black 4%
- Hispanic origin (detail)
- Mexican 20% Puerto Rican 3%
- Common ancestry
- Lithuanian 4% Serbian 3% Slovak 2%
- Foreign-born
- 2% · Canada
- Languages at home
- 73% English-only · Spanish 11% Chinese 1% German/W. Germanic 1%
Political lean MEDSL · Navajo
- 2024 margin
- R (+17.2) · D 40.9% · R 58.1%
- 2008→2024 swing
- -5.5pp toward R · 2008: -11.7pp · 2024: -17.2pp
- All cycles
- 2024: R+17.2 2020: R+8.2 2016: R+7.9 2012: R+8.4 2008: R+11.7
Not yet ingested
- Civics
- —
Market trends
- HPI YoY
- ▲ 8.03%
- Current HPI
- 281.0415
- Rent YoY
- —
- Metro
- —
- State GDP YoY
- ▲ 4.54%
- F500 in state
- 20
Industry mix (Fortune 500 HQ in AZ)
| Industry | F500 HQs | Revenue |
|---|---|---|
| Technology | 2 | $13B |
|
||
| Mining / Metals | 1 | $23B |
|
||
| Environmental Services | 1 | $16B |
|
||
| Metals / Steel | 1 | $14B |
|
||
| Technology Distribution | 1 | $9B |
|
||
| Homebuilding | 1 | $8B |
|
||
Price history
1 event — show timeline
- 2026-03-11 Listed $44,900 WMMLS
Property tax history
+4.3%/yrLatest (2025): $619 · +5.0% YoY. Source: county tax records.
Cash-flow waterfall
monthlySold comps — $/sqft
last 12 mo · ≤1 miLoading sold comps…