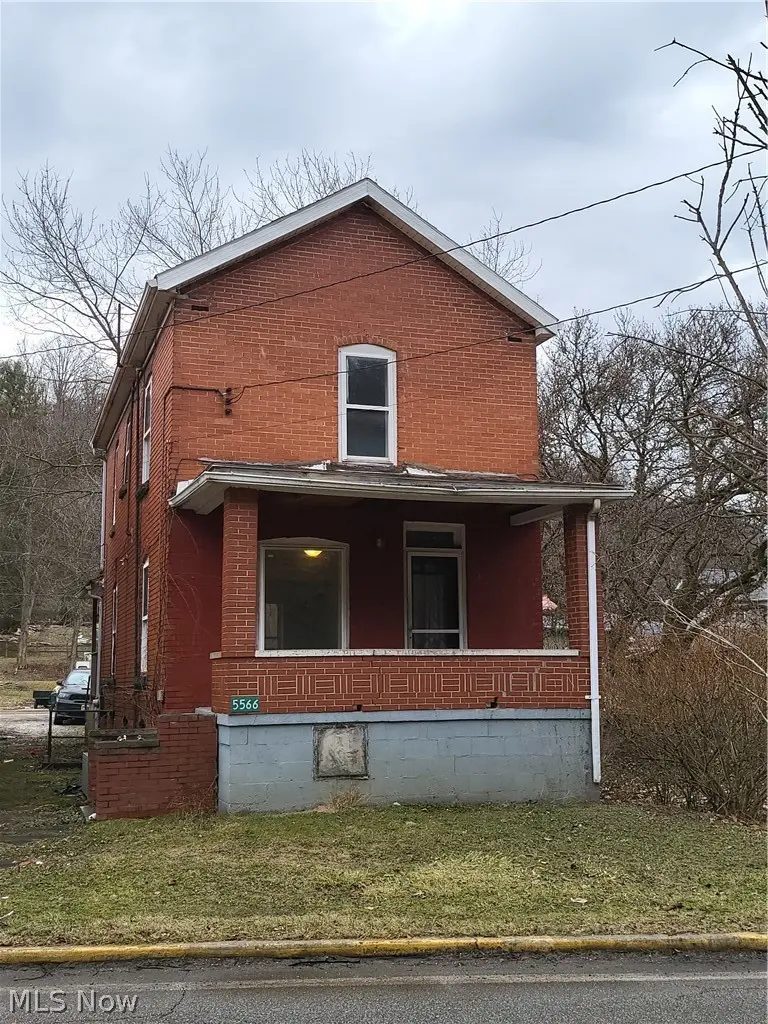
5566 State Route 152 · Dillonvale, OH
Flood risk 8/10 · Major
- FEMA flood zone
- AE
- Chance of flooding over 30 yrs
- 0.99%
- Est. flood insurance / yr
- $2,026 – $9,024
Fire risk 1/10 · Minimal
- Est. fire insurance / yr
- $713 – $1,323
Heat risk 3/10 · Minor
- Hot days now (above 96°F)
- 7 days/yr
- Hot days in 30 yrs
- 19 days/yr
Wind risk 1/10 · Minimal
- Chance of severe wind over 30 yrs
- —
Air-quality risk 2/10 · Minimal
- Unhealthy air days now
- 0 days/yr
- Unhealthy air days in 30 yrs
- 1 days/yr
Risk factors via First Street. Map © Google.
Why this score? — see what drove the B+ grade
The composite is a weighted blend of 9 inputs, each scored 0–100. Each bar is that input's sub-score; the figure is the points it added to the 100-point composite (weight × sub-score).
- Cash flow +30.0/30.0
- 1% rule +10.0/10.0
- DSCR +10.0/10.0
- ARV discount +7.5/15.0
- Appreciation +4.7/10.0
- Schools +4.1/10.0
- Livability +4.1/5.0
- Rent growth +2.5/5.0
- Condition / age +2.5/5.0
$59,900
🖨 Deal sheet (PDF) 📄 Offer letter ✓ Due diligence
Listing remarks
This home features beautiful hardwood floors that add warmth and character throughout. The open-concept living room and kitchen create a spacious, inviting layout—perfect for everyday living or entertaining. With a little TLC, this property offers a great opportunity to make it your own and bring out its full potential. Red Brick home next door also for sale. AS-IS, conventional or cash
Key facts
- 2,613 sq ft lot
- Parking
- Built 1918
Property features AI
Exterior
- Parking: Driveway
- Utilities: Public water; Public sewer
- Home design: 2-story brick home; Fixer condition
- Construction: Built per public records; Block foundation; Asphalt roof; Brick construction; Above-grade living area approximately 1,024
- Exterior features: Waterfront property
Interior
- Kitchen: First-floor kitchen with hardwood flooring
- Bedrooms: Two second-floor bedrooms with hardwood floors
- Flooring: Hardwood flooring in kitchen, living room and bedrooms; Ceramic tile in bathroom
- Bathrooms: One full bathroom (second floor) with ceramic tile flooring
- Heating & cooling: Forced air heating; Central air conditioning
- Interior features: Has basement; Total of 5 rooms
Neighborhood map
What this means for you Summary
Snapshot
- This is a 2-bed/1.0-bath single-family listed at $60k.
Deal economics
- At list price, monthly cash flow is $-86 ($-1k/yr) — negative.
- To cash-flow at today's rent, offer at most $45k (25.3% below list).
- Meets the 1% rule at list price ($941 rent vs $60k).
- Recommended offer: $45k (25.3% below list) — sets the bar for cash-flow.
Location & tenants
- Location reads 82/100 on livability (#71 in OH, #1,093 nationally) — a professional / high-income tenant draw. Strengths: crime A+, cost of living A+, housing A+; Watch: health & safety C-, amenities D.
- Buckeye Local (rural): math 44% / reading 53% proficiency, ranked #471 of 656 in OH (top 72%) — families likely to look elsewhere, expect single-tenant / working-renter base with shorter leases.
- Zoned schools: Buckeye West Elementary School (math 62% / reading 52%, grade C+, #729 of 1,584 statewide, top 48%, 217 students, 62% FRL); Buckeye Local Junior High (math 33% / reading 51%, grade D-, #499 of 654 statewide, top 77%, 209 students, 56% FRL); Buckeye Local High School (388 students, 54% FRL).
- Market conditions: 8 active listings in the ZIP; 2 units permitted in Jefferson County in 2024 (0 in 5+ unit buildings).
Forward outlook
- In year one you build about $32 of equity ($414 loan paydown + $-382 appreciation (-0.6% local appreciation)).
- Jefferson County population projected at -19% by 2050 — secular population decline; favor cash flow + early exit over multi-decade hold.
Negotiation context
- It's been on market 85 days — a 6% lower offer ($56k) is reasonable based on typical stale-listing flexibility.
- 2 sale attempts since 11y ago with the ask held roughly flat each time — persistent listings suggest the price (not the market) is what's stuck; bring a comps-based counter.
Risks & watch-outs
- Watch-outs: flood insurance adds $460/mo; built in 1918 — expect roof / HVAC / electrical / plumbing capex.
- Climate carrying-cost: in FEMA flood zone AE (mandatory federal flood insurance) — expect insurance premiums to compound above CPI over the hold.
Questions for the listing agent
- What do current leases actually rent for vs. the listed asking? Can we see a recent rent roll and the last 12 months of T-12 income?
- It's been on market 85 days. Have you received any prior offers? Is the seller open to a 25% concession, seller financing, or rate buy-down credit?
- Built in 1918 — when were the roof, HVAC, electrical panel, plumbing, and water heater last replaced?
- What's the actual annual flood-insurance premium (NFIP or private), and is the property in a SFHA with mandatory coverage?
- Why hasn't it sold? Are there any deal-killer items the seller is aware of (foundation, flood, title, zoning, code violations)?
- Is there a deadline driving the sale (1031 exchange, divorce, estate, relocation)? That informs how much negotiation room exists.
- Schools are A-rated — typically a magnet for longer-tenancy family renters. What's the average tenant stay here, and is there a school-zone premium baked into asking?
- What's the average days-on-market for RENTAL listings here right now (not sales)? A rising rental-DOM trend means longer vacancies and softer asking-rent achievability than the comps imply.
- What's the recent tenant-quality profile in this submarket — average credit score on applications, eviction rate, late-payment / NSF rate, and stable-employment percentage? A property-management company in the area should have these aggregated.
- How much new for-sale + rental construction is in the pipeline within 1–3 miles? Heavy new supply typically softens prices + rents 12–24 months out; constrained supply supports both.
Investment metrics
- 1% rule
- 1.57% ✓
- Cap rate
- 13.80%
- Cash-on-cash
- 26.80%
- DSCR
- 2.19
- GRM
- 5.3
CMA / ARV
No comps found within radius.
Projected returns pro-forma
-0.64% appreciation · 3.0% rent growth · sell at horizon
- IRR
- -11.7%
- Equity multiple
- 0.48×
- Total profit
- $-8,725
- Equity at exit
- $15,507
- IRR
- -4.6%
- Equity multiple
- 0.54×
- Total profit
- $-7,633
- Equity at exit
- $17,195
Cash invested: $16,772 (down + closing). Projections, not guarantees.
Landlord ↔ Tenant lean methodology
- Overall (STATE)
- 73 Landlord-Friendly
- State Ohio
- 73 Landlord-Friendly · R+6
- County
- — inherits STATE
- City
- — inherits STATE
ZIP-level market 43917
- Home prices YoY
- -0.3%
- Active inventory
- 8
- Price-to-rent
- 5.3×
Monthly cashflow live
- Estimated rent
- $941 medium interval (Pro) →
- Mortgage (P&I)
- −$314
- Tax from tax record
- −$30 /mo · $356/yr
- Insurance
- −$25
- Flood insurance flood zone
- −$460 /mo · $5,525/yr
- HOA
- −$0
- Vacancy / Maint / Mgmt
- −$198
- Net cashflow
- $-86
Break-even live
Sensitivity live
| Price | -10% $-52 | -5% $-69 | +0% $-86 | +5% $-103 | +10% $-120 |
|---|---|---|---|---|---|
| Rent | -10% $-160 | -5% $-123 | +0% $-86 | +5% $-49 | +10% $-12 |
| Rate | -1.0pp $-56 | -0.5pp $-71 | base $-86 | +0.5pp $-101 | +1.0pp $-117 |
UW: 25.0% down · 7.5% · 30yr · 1.5% tax · 5.0% vac · 8.0% maint · 8.0% mgmt
Financing live
Cash to close
- Down payment
- $14,975
- Closing costs
- $1,797
- Reserves months
- —
- Total cash needed
- —
Loan-product check · same deal, 3 products live
Conventional
25% down · 7.5% · 30yr
- Down + closing
- —
- Monthly P&I
- —
- Monthly cashflow
- —
- DSCR
- —
- Eligible?
- —
Personal DTI + credit; lowest rate.
DSCR
20% down · 8.5% · 30yr
- Down + closing
- —
- Monthly P&I
- —
- Monthly cashflow
- —
- DSCR
- —
- Eligible?
- —
No personal income docs; deal must DSCR.
Hard money
10% down · 12.0% · 12mo
- Down + closing
- —
- Monthly P&I
- —
- Monthly cashflow
- —
- DSCR
- —
- Eligible?
- —
Short-term bridge; refi at stabilization.
Listing history 17 events
-
2026-06-21days on market $59,900 Active 85 DOM
-
2026-06-21days on market $59,900 Active 84 DOM
-
2026-06-18days on market $59,900 Active 82 DOM
-
2026-06-17days on market $59,900 Active 81 DOM
-
2026-06-16days on market $59,900 Active 80 DOM
-
2026-06-15days on market $59,900 Active 79 DOM
-
2026-06-13days on market $59,900 Active 77 DOM
-
2026-06-12days on market $59,900 Active 76 DOM
-
2026-06-09days on market $59,900 Active 73 DOM
-
2026-06-08days on market $59,900 Active 72 DOM
-
2026-06-07days on market $59,900 Active 71 DOM
-
2026-06-07days on market $59,900 Active 70 DOM
-
2026-06-04days on market $59,900 Active 67 DOM
-
2026-06-02days on market $59,900 Active 66 DOM
-
2026-06-01days on market $59,900 Active 65 DOM
-
2026-05-31remarks 389-char remark
-
2026-05-31$59,900 Active 64 DOM
ⓘ Source: listings_history table (triggers on properties + properties_extension) + one-shot
backfill from property_details.listing_events for pre-trigger history.
Tax reassessment forecast OH · Partial reset (capped growth)
- Current annual tax
- $356 · $30/mo
- Projected year-2 tax
- $645 · $54/mo
- Expected delta
- +$289/yr (+$24/mo · 81.2%)
ⓘ Screening estimate from a state-policy table — verify with the county assessor before closing.
Climate risk First Street
- Flood 8/10 Severe FEMA zone AE · 99% chance over 30 yrs
- Wildfire 1/10 Low
- Heat 3/10 Moderate 7 d/yr ≥96°F today · 19 d/yr by 30 yrs out
- Wind 1/10 Low
- Air quality 2/10 Low 0 unhealthy d/yr today · 1 by 30 yrs out
Nearby sold comps map
Loading sold comps map…
Walkable amenities ~0.75 mi
Loading nearby amenities…
Taxation est. · year 1
- Rental income
- $11,291
- − Mortgage interest
- −$3,355
- − Property taxes
- −$356
- − Insurance
- −$5,824
- − Repairs & maintenance
- −$903
- − Management
- −$903
- − Depreciation
- −$1,743
- Taxable loss
- −$1,794
- Est. tax savings @ 24.0%
- +$431
- After-tax cash flow
- $-600/yr
For passive investors: Depreciation is non-cash, so a rental often shows a tax loss while cash-flowing — sheltering income. Rental losses are passive: they offset passive income freely, and up to $25,000/yr can offset ordinary (W-2) income if you actively participate and your MAGI is under $100k (phasing out to $0 by $150k); unused losses carry forward. On sale, claimed depreciation is recaptured at up to 25%, and gains may owe capital-gains tax (a 1031 exchange can defer both). Figures are a year-1 estimate at your 24.0% rate — not tax advice; consult a CPA.
Schools (NCES district)
- District
- Buckeye Local
- NCES district ID
- 3904778
- Math proficiency
- 44% ▼ -18.00%
- Reading proficiency
- 53% ▼ -10.00%
- Median HH income
- $41,332
- Composite
- 40.68/100
- National rank
- #3673
- State rank
- #471 of 656 in OH
Livability — Dillonvale
- Score
- 82/100
- State rank
- #71
- US rank
- #1093
Category grades
Schools grade is shown separately in the Schools card above.
Census & demographics
- Census place
- Dillonvale, OH
- County
- Jefferson · 64,369 people
- Metro
- Weirton-Steubenville, WV-OH
- Population (ZIP)
- 2,647
- Household income
- $60,750
- Rent vs Own
- Severe rent burden
- 38.0
Population outlook (Jefferson County) Hauer SSP2
- Today (2025)
- 63,481 people
- By 2030
- 61,067 · -3.8%
- By 2040
- 55,860 · -12.0%
- By 2050
- 51,236 · -19.3%
- By 2075
- 41,804 · -34.1%
- By 2100
- 32,344 · -49.0%
Race, ethnicity, and origin ACS 2023
- Neighborhood character
- Predominantly White (98%)
- Race & ethnicity
- White 98% Hispanic / Latino 2%
- Common ancestry
- Romanian 19% Hungarian 4% Slovak 3%
- Foreign-born
- 0%
Political lean MEDSL · Jefferson
- 2024 margin
- Solid R (+43.9) · D 27.5% · R 71.4% · Other 1.1%
- 2008→2024 swing
- -44.1pp toward R · 2008: 0.2pp · 2024: -43.9pp
- All cycles
- 2024: R+43.9 2020: R+38.4 2016: R+35.7 2012: R+5.5 2008: D+0.2
Not yet ingested
- Civics
- —
Market trends
- HPI YoY
- ▼ -0.64%
- Current HPI
- 234.9381
- Rent YoY
- —
- Metro
- —
- State GDP YoY
- ▲ 1.98%
- F500 in state
- 48
Industry mix (Fortune 500 HQ in OH)
| Industry | F500 HQs | Revenue |
|---|---|---|
| Insurance | 3 | $145B |
|
||
| Industrial Machinery | 3 | $49B |
|
||
| Financial Services | 3 | $24B |
|
||
| Consumer Goods | 2 | $93B |
|
||
| Aerospace / Defense | 2 | $47B |
|
||
| Utilities | 2 | $33B |
|
||
Price history
+50.5% since first listed5 events — show timeline
- 2026-03-28 Listed $59,900 MLSNOW
- 2016-06-22 Listing Removed — MLSNOW
- 2015-10-28 Listed $55,000 MLSNOW
- 2012-03-21 Sold (Public Records) $57,000 Public Records
- 2000-03-29 Sold (Public Records) $39,800 Public Records
Property tax history
+3.5%/yrLatest (2025): $356 · +0.2% YoY. Source: county tax records.
Cash-flow waterfall
monthlySold comps — $/sqft
last 12 mo · ≤1 miLoading sold comps…