 🏷️ Likely Rental
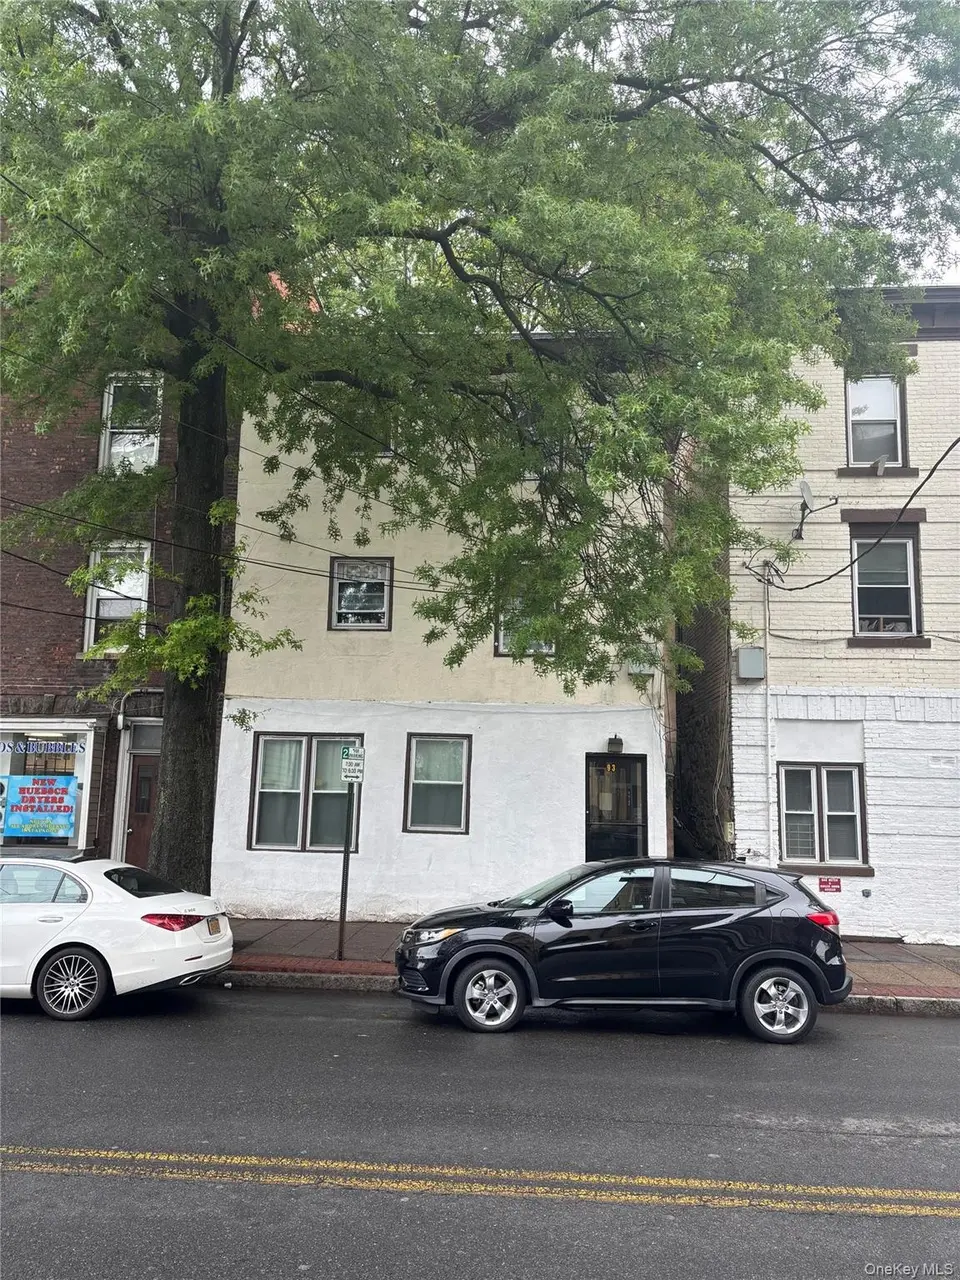
93 Ferris Ave · White Plains, NY
Flood risk 1/10 · Minimal
- FEMA flood zone
- X (unshaded)
- Chance of flooding over 30 yrs
- 0.0%
- Est. flood insurance / yr
- $507 – $1,088
Fire risk 2/10 · Minimal
- Est. fire insurance / yr
- $691 – $1,283
Heat risk 5/10 · Moderate
- Hot days now (above 98°F)
- 7 days/yr
- Hot days in 30 yrs
- 15 days/yr
Wind risk 6/10 · Moderate
- Chance of severe wind over 30 yrs
- 27.0%
Air-quality risk 4/10 · Minor
- Unhealthy air days now
- 3 days/yr
- Unhealthy air days in 30 yrs
- 5 days/yr
Risk factors via First Street. Map © Google.
Why this score? — see what drove the B- grade
The composite is a weighted blend of 9 inputs, each scored 0–100. Each bar is that input's sub-score; the figure is the points it added to the 100-point composite (weight × sub-score).
- Cash flow +24.3/30.0
- ARV discount +15.0/15.0
- DSCR +7.8/10.0
- 1% rule +6.3/10.0
- Schools +4.7/10.0
- Livability +3.6/5.0
- Rent growth +2.5/5.0
- Condition / age +2.5/5.0
- Appreciation +0.0/10.0
$800,000
🖨 Deal sheet 📄 Offer letter ✓ Due diligence
Multi-family units
County records classify this as Multi-Family (2-4 Unit). Listing-text estimate: 3 units. confirmed
Listing remarks MLS
Investors, take note! This three-family property features three spacious one-bedroom units, each equipped with its own gas boiler. Tenants pay their own utilities, and there are no current leases in place, offering flexibility to adjust rents to market value. Conveniently situated near Metro-North Railroad, downtown White Plains, shopping, restaurants, parkways, and highways, this property offers high tenant appeal and rental demand. Don’t miss this incredible opportunity to expand your investment portfolio in a prime location!
Key facts
- Near shopping
- Gas boiler
- 2,178 sq ft lot
Tags
Neighborhood map
What this means for you Summary
Snapshot
- This is a 3 × 1-bed/1.0-bath units multifamily listed at $800k.
Deal economics
- At list price, monthly cash flow is $2k ($19k/yr) — positive. Per door: $537/mo.
- The deal already cash-flows at list — no discount required.
- Meets the 1% rule at list price ($9k rent vs $800k).
- Recommended offer: $704k (12.0% below list) — sets the bar for market timing.
- Cap rate 8.7% vs local median 4.3% in White Plains — top-decile yield for the area; either an underpriced asset or a hidden risk that comps aren't pricing in. Stress-test before assuming the spread holds.
Location & tenants
- Location reads 71/100 on livability (#410 in NY) — a middle-class / working-renter tenant base. Strengths: commute A+, employment A+, crime A-; Watch: amenities F, cost of living F.
- White Plains City School District (urban): math 49% / reading 54% proficiency, ranked #313 of 590 in NY (top 53%) — acceptable for families but not a draw, mixed tenant base, ~2y average lease.
- Market conditions: 111 active listings in the ZIP; 12 comparable units currently listed for rent nearby; rentals at typical pace (median 17d on market — plan ~3-4 weeks tenant-placement turnaround); 954 units permitted in Westchester County in 2024 (649 in 5+ unit buildings).
Forward outlook
- Local home prices are declining (-3.0%/yr); year-one equity from $6k of loan paydown is wiped out by about $24k of value loss. Plan a longer hold.
- Westchester County population projected at +10% by 2050 — modest demand growth; plan on rents tracking national, not racing it.
Negotiation context
- It's been on market 214 days — a 12% lower offer ($704k) is reasonable based on typical stale-listing flexibility.
- 2 sale attempts with the ask held roughly flat each time — persistent listings suggest the price (not the market) is what's stuck; bring a comps-based counter.
Risks & watch-outs
- Watch-outs: built in 1924 — expect roof / HVAC / electrical / plumbing capex.
- Climate carrying-cost: major wind risk, 27% chance of damaging wind over 30y; extreme-heat days projected 7→15/yr by 2055 (HVAC capex compounding) — expect insurance premiums to compound above CPI over the hold.
Questions for the listing agent
- It's been on market 214 days. Have you received any prior offers? Is the seller open to a 12% concession, seller financing, or rate buy-down credit?
- Can we see the unit-by-unit rent roll, current vacancy, and any below-market leases? What's the average tenancy length?
- What capital expenditures (roof, boiler, parking lot, exteriors) have been made in the last 5 years, and what's planned in the next 2?
- Built in 1924 — when were the roof, HVAC, electrical panel, plumbing, and water heater last replaced?
- Why hasn't it sold? Are there any deal-killer items the seller is aware of (foundation, flood, title, zoning, code violations)?
- Is there a deadline driving the sale (1031 exchange, divorce, estate, relocation)? That informs how much negotiation room exists.
- What's the average days-on-market for RENTAL listings here right now (not sales)? A rising rental-DOM trend means longer vacancies and softer asking-rent achievability than the comps imply.
- What's the recent tenant-quality profile in this submarket — average credit score on applications, eviction rate, late-payment / NSF rate, and stable-employment percentage? A property-management company in the area should have these aggregated.
- How much new apartment / multifamily construction is in the pipeline within 1–3 miles? Heavy new supply (>2% of stock underway) typically softens rents 12–24 months out; light construction supports rent growth.
Investment metrics
- 1% rule
- 1.13% ✓
- Cap rate
- 8.71%
- Cash-on-cash
- 8.63%
- DSCR
- 1.38
- GRM
- 7.4
CMA / ARV
- ARV (median comp)
- $1,577,115
- List price
- $800,000
- Delta
- -49.27%
- Verdict
- UNDERPRICED
- Comps
- 20 within 1.0 mi
Show comp detail 2 sales within ~0.75 mi
| Address | Dist | Beds/Ba | Sqft | Sold | Price | $/sf | Match |
|---|---|---|---|---|---|---|---|
| 114-116 Ferris Ave | 0.06mi | 4/2.5 (+1) | 2,032 (-7%) | 13mo | $749,000 | $369 | 68 |
| 63 Grant Ave | 0.61mi | 4/2.0 (+1) | 1,920 (-12%) | 5mo | $803,700 | $419 | 39 |
Match score weights: distance 35% · size 25% · config 20% · recency 20%. Top-matched comps best support the ARV.
Projected returns pro-forma
-3.0% appreciation · 3.0% rent growth · sell at horizon
- IRR
- -3.2%
- Equity multiple
- 0.88×
- Total profit
- $-26,917
- Equity at exit
- $119,283
- IRR
- 6.5%
- Equity multiple
- 1.49×
- Total profit
- $109,204
- Equity at exit
- $69,169
Cash invested: $224,000 (down + closing). Projections, not guarantees.
Landlord ↔ Tenant lean methodology
- Overall (STATE)
- 15 Strongly Tenant-Friendly
- State New York
- 15 Strongly Tenant-Friendly · D+10
- County
- — inherits STATE
- City
- — inherits STATE
ZIP-level market 10603
- Home prices YoY
- -24.2%
- Active inventory
- 111
- Price-to-rent
- 22.1×
Monthly cashflow live
- Estimated rent
- $9,037 high interval (Pro) →
- Mortgage (P&I)
- −$4,195
- Tax est. 1.5%
- −$1,000 /mo · $12,000/yr
- Insurance
- −$333
- HOA
- −$0
- Vacancy / Maint / Mgmt
- −$1,898
- Net cashflow
- $1,611
Break-even live
3-unit breakdown (identical units grouped — click to expand)
| Units | Beds | Baths | Est. rent |
|---|---|---|---|
| 3× units | 1 | 1 | $9,036 |
| #1 | 1 | 1 | $3,012 |
| #2 | 1 | 1 | $3,012 |
| #3 | 1 | 1 | $3,012 |
| Total (3 units) | $9,037 | ||
UW: 25.0% down · 7.5% · 30yr · 1.5% tax · 5.0% vac · 8.0% maint · 8.0% mgmt
Financing live
Cash to close
- Down payment
- $200,000
- Closing costs
- $24,000
- Reserves months
- —
- Total cash needed
- —
Loan-product check · same deal, 3 products live
Conventional
25% down · 7.5% · 30yr
- Down + closing
- —
- Monthly P&I
- —
- Monthly cashflow
- —
- DSCR
- —
- Eligible?
- —
Personal DTI + credit; lowest rate.
DSCR
20% down · 8.5% · 30yr
- Down + closing
- —
- Monthly P&I
- —
- Monthly cashflow
- —
- DSCR
- —
- Eligible?
- —
No personal income docs; deal must DSCR.
Hard money
10% down · 12.0% · 12mo
- Down + closing
- —
- Monthly P&I
- —
- Monthly cashflow
- —
- DSCR
- —
- Eligible?
- —
Short-term bridge; refi at stabilization.
Rent comps 12 comps
| Address | Beds | Baths | Sqft | Rent | $/sqft | DOM | Units | Dist |
|---|---|---|---|---|---|---|---|---|
| 115 N Broadway White Plains, NY | 2.0 | 2.5 | 1450 | $3,750 | $2.59 | 43d | 1 | 0.39mi |
| 25 N Lexington Ave White Plains, NY | 3.0 | 1.0–2.0 | 988 | $7,972 | $8.07 | 1d | 28 | 0.42mi |
| 5 Renaissance Sq Apt 21F White Plains, NY | 2.0 | 2.5 | 1534 | $6,850 | $4.47 | 17d | 1 | 0.54mi |
| 107 Winding Ridge Rd #107 White Plains, NY | 4.0 | 3.5 | 3000 | $7,500 | $2.50 | 24d | 1 | 0.68mi |
| 3 Terrace Ave White Plains, NY | 4.0 | 2.0 | 1820 | $5,500 | $3.02 | 6d | 1 | 0.70mi |
| 234 Martine Ave White Plains, NY | 3.0 | 2.0 | 1460 | $4,195 | $2.87 | 24d | 1 | 0.75mi |
| 240 Martine Ave Apt 4G White Plains, NY | 3.0 | 2.0 | 1460 | $4,195 | $2.87 | 43d | 1 | 0.76mi |
| 26 Montross St White Plains, NY | 3.0 | 1.0 | 1528 | $5,650 | $3.70 | 1d | 1 | 0.78mi |
| 250 Mamaroneck Ave White Plains, NY | 1.0–3.0 | 1.0–2.5 | 1298 | $10,808 | $8.33 | 1d | 126 | 1.02mi |
| 9 Ridgeview Ave White Plains, NY | 3.0 | 1.0 | 1500 | $3,500 | $2.33 | 24d | 1 | 1.09mi |
| 507 Main St E West Harrison, NY | 3.0 | 2.0 | 1800 | $5,000 | $2.78 | 7d | 1 | 1.26mi |
| 82 Quinby Ave White Plains, NY | 4.0 | 1.5 | 2350 | $6,000 | $2.55 | 1d | 1 | 1.32mi |
Listing history 17 events
-
2026-06-18days on market $800,000 Active 214 DOM
-
2026-06-17days on market $800,000 Active 213 DOM
-
2026-06-16days on market $800,000 Active 212 DOM
-
2026-06-15days on market $800,000 Active 211 DOM
-
2026-06-13days on market $800,000 Active 209 DOM
-
2026-06-13days on market $800,000 Active 208 DOM
-
2026-06-09days on market $800,000 Active 205 DOM
-
2026-06-08days on market $800,000 Active 204 DOM
-
2026-06-07days on market $800,000 Active 203 DOM
-
2026-06-04days on market $800,000 Active 200 DOM
-
2026-06-03days on market $800,000 Active 199 DOM
-
2026-06-02days on market $800,000 Active 198 DOM
-
2026-06-01days on market $800,000 Active 197 DOM
-
2026-05-31days on market $800,000 Active 196 DOM
-
2025-11-16historical
-
2025-11-15$800,000 Active 540-char remark
Show marketing remark (540 chars)
Investors, take note! This three-family property features three spacious one-bedroom units, each equipped with its own gas boiler. Tenants pay their own utilities, and there are no current leases in place, offering flexibility to adjust rents to market value. Conveniently situated near Metro-North Railroad, downtown White Plains, shopping, restaurants, parkways, and highways, this property offers high tenant appeal and rental demand. Don’t miss this incredible opportunity to expand your investment portfolio in a prime location!
-
2025-05-15$800,000 Active
ⓘ Source: listings_history table (triggers on properties + properties_extension) + one-shot
backfill from property_details.listing_events for pre-trigger history.
Climate risk First Street
- Flood 1/10 Low FEMA zone X (unshaded) · 0% chance over 30 yrs
- Wildfire 2/10 Low
- Heat 5/10 Major 7 d/yr ≥98°F today · 15 d/yr by 30 yrs out
- Wind 6/10 Major 27% chance of damaging wind over 30 yrs
- Air quality 4/10 Moderate 3 unhealthy d/yr today · 5 by 30 yrs out
Nearby sold comps map
Loading sold comps map…
Walkable amenities ~0.75 mi
Loading nearby amenities…
Taxation est. · year 1
- Rental income
- $108,444
- − Mortgage interest
- −$44,812
- − Property taxes
- −$12,000
- − Insurance
- −$4,000
- − Repairs & maintenance
- −$8,676
- − Management
- −$8,676
- − Depreciation
- −$23,273
- Taxable income
- $7,008
- Est. tax owed @ 24.0%
- −$1,682
- After-tax cash flow
- $17,645/yr
For passive investors: Depreciation is non-cash, so a rental often shows a tax loss while cash-flowing — sheltering income. Rental losses are passive: they offset passive income freely, and up to $25,000/yr can offset ordinary (W-2) income if you actively participate and your MAGI is under $100k (phasing out to $0 by $150k); unused losses carry forward. On sale, claimed depreciation is recaptured at up to 25%, and gains may owe capital-gains tax (a 1031 exchange can defer both). Figures are a year-1 estimate at your 24.0% rate — not tax advice; consult a CPA.
Schools (NCES district)
- District
- White Plains City School District
- NCES district ID
- 3631260
- Math proficiency
- 49% ▼ -6.00%
- Reading proficiency
- 54% ▲ 2.00%
- Median HH income
- $78,366
- Composite
- 46.72/100
- National rank
- #2397
- State rank
- #313 of 590 in NY
Livability — White Plains
- Score
- 71/100
- State rank
- #410
- US rank
- #6801
Category grades
Schools grade is shown separately in the Schools card above.
Census & demographics
- Census place
- White Plains, NY
- City population
- 61,281
- Population (ZIP)
- 19,201
Population outlook (Westchester County) Hauer SSP2
- Today (2025)
- 1,028,035 people
- By 2030
- 1,051,636 · +2.3%
- By 2040
- 1,098,520 · +6.9%
- By 2050
- 1,136,044 · +10.5%
- By 2075
- 1,196,925 · +16.4%
- By 2100
- 1,175,147 · +14.3%
Race, ethnicity, and origin ACS 2023
- Neighborhood character
- Highly diverse neighborhood (Simpson 0.71)
- Race & ethnicity
- Hispanic / Latino 35% White 34% Black 21% Two or more races 13% Asian 5%
- Hispanic origin (detail)
- Mexican 4% Puerto Rican 7% Dominican 3%
- Common ancestry
- Hispanic 3% Romanian 2% Lithuanian 1%
- Foreign-born
- 33% · Canada, Jamaica, China
- Languages at home
- 55% English-only · Spanish 31% Other Indo-European 8% French/Haitian/Cajun 2%
Political lean MEDSL · Westchester
- 2024 margin
- Strong D (+26.3) · D 63.1% · R 36.9%
- 2008→2024 swing
- -1.3pp toward R · 2008: 27.6pp · 2024: 26.3pp
- All cycles
- 2024: D+26.3 2020: D+36.3 2016: D+32.8 2012: D+22.2 2008: D+27.6
Not yet ingested
- Civics
- —
Market trends
- HPI YoY
- ▼ -101.72%
- Current HPI
- 317.8177
- Rent YoY
- —
- Metro
- —
- State GDP YoY
- ▲ 2.60%
- F500 in state
- 92
Industry mix (Fortune 500 HQ in NY)
| Industry | F500 HQs | Revenue |
|---|---|---|
| Financial Services | 10 | $950B |
|
||
| Consumer Goods | 9 | $162B |
|
||
| Insurance | 4 | $225B |
|
||
| Telecommunications | 2 | $144B |
|
||
| Pharmaceuticals | 2 | $112B |
|
||
| Media / Entertainment | 2 | $69B |
|
||
Price history
+0.0% since first listed3 events — show timeline
- 2025-11-16 Listing Removed — OneKey® MLS as Distributed by MLS Grid
- 2025-11-15 Listed $800,000 OneKey® MLS as Distributed by MLS Grid
- 2025-05-15 Listed $800,000 OneKey® MLS as Distributed by MLS Grid
Property tax history
-28.5%/yrLatest (2025): $905 · -0.3% YoY. Source: county tax records.
Cash-flow waterfall
monthlySold comps — $/sqft
last 12 mo · ≤1 miLoading sold comps…