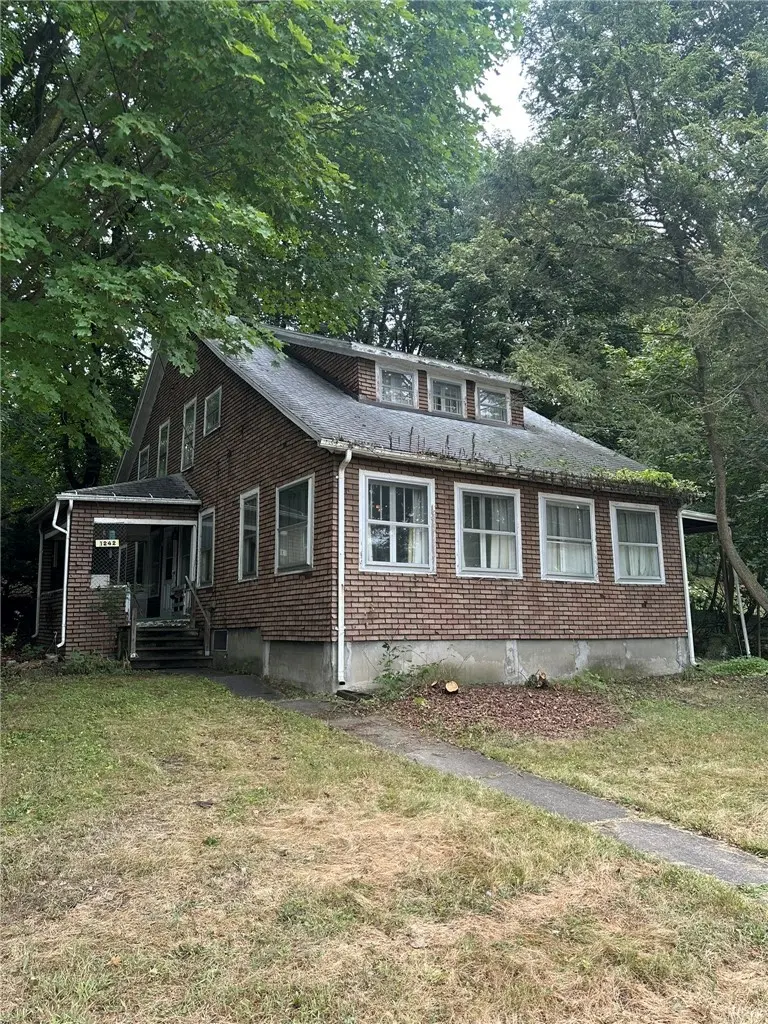
1242 W Church St · West Elmira, NY
Flood risk 8/10 · Major
- FEMA flood zone
- X
- Chance of flooding over 30 yrs
- 0.99%
- Est. flood insurance / yr
- $473 – $860
Fire risk 1/10 · Minimal
- Est. fire insurance / yr
- $691 – $1,283
Heat risk 3/10 · Minor
- Hot days now (above 97°F)
- 8 days/yr
- Hot days in 30 yrs
- 18 days/yr
Wind risk 1/10 · Minimal
- Chance of severe wind over 30 yrs
- 1.0%
Air-quality risk 1/10 · Minimal
- Unhealthy air days now
- 0 days/yr
- Unhealthy air days in 30 yrs
- 0 days/yr
Risk factors via First Street. Map © Google.
Why this score? — see what drove the D- grade
The composite is a weighted blend of 9 inputs, each scored 0–100. Each bar is that input's sub-score; the figure is the points it added to the 100-point composite (weight × sub-score).
- Cash flow +10.3/30.0
- ARV discount +7.5/15.0
- 1% rule +6.1/10.0
- Livability +3.6/5.0
- DSCR +3.0/10.0
- Rent growth +2.5/5.0
- Condition / age +2.5/5.0
- Schools +2.4/10.0
- Appreciation +0.0/10.0
$99,000
🖨 Deal sheet 📄 Offer letter ✓ Due diligence
Listing remarks MLS
Located near Hendy Elementary and the West Elmira Fire Department, this spacious 4-bedroom, 2-bath home offers incredible potential. Once a two-unit apartment house, the property retains its original layout with separate upstairs and downstairs living areas—perfect for those seeking to reconvert it into a duplex or maintain as a single-family residence. Inside, you'll find generously sized rooms throughout, many of which are just waiting to be restored to their former glory. With a bit of vision and TLC, this home can shine once again. Whether you're looking to create a multi-family income property or your dream home in a prime location, this West Elmira gem offers endless possibilities!"
Key facts
- Prime location
- 0.43 acre lot
- Parking
Tags
Neighborhood map
What this means for you Summary
Snapshot
- This is a 3-bed/2.0-bath single-family listed at $99k.
Deal economics
- At list price, monthly cash flow is $-109 ($-1k/yr) — negative.
- To cash-flow at today's rent, offer at most $87k (12.2% below list).
- Meets the 1% rule at list price ($1k rent vs $99k).
- Recommended offer: $87k (12.2% below list) — sets the bar for cash-flow.
- Cap rate 5.6% vs local median 4.6% in West Elmira — meaningfully above typical; check what's discounted (condition, days-on-market, listing class) to confirm the premium yield is real.
Location & tenants
- Location reads 72/100 on livability (#341 in NY) — a middle-class / working-renter tenant base. Strengths: housing A+, health & safety A+, employment A-; Watch: amenities F, commute F.
- Elmira City School District (urban): math 23% / reading 35% proficiency, ranked #580 of 590 in NY (top 98%) — low school quality limits family demand, transient renter base, plan for 1-2y turnover.
- Market conditions: 39 active listings in the ZIP; 1 comparable units currently listed for rent nearby; 91 units permitted in Chemung County in 2024 (63 in 5+ unit buildings).
Forward outlook
- Local home prices are declining (-3.0%/yr); year-one equity from $684 of loan paydown is wiped out by about $3k of value loss. Plan a longer hold.
- Chemung County population projected at -17% by 2050 — secular population decline; favor cash flow + early exit over multi-decade hold.
Negotiation context
- It's been on market 102 days — a 9% lower offer ($90k) is reasonable based on typical stale-listing flexibility.
- 3 sale attempts; this cycle's ask has dropped $40k (29%) from the opening price — seller is motivated, your offer sets the floor, not the list.
Risks & watch-outs
- Watch-outs: property tax is 4.4% of price; flood insurance adds $56/mo; built in 1895 — expect roof / HVAC / electrical / plumbing capex.
- Climate carrying-cost: severe flood risk — expect insurance premiums to compound above CPI over the hold.
Questions for the listing agent
- What do current leases actually rent for vs. the listed asking? Can we see a recent rent roll and the last 12 months of T-12 income?
- It's been on market 102 days. Have you received any prior offers? Is the seller open to a 12% concession, seller financing, or rate buy-down credit?
- Built in 1895 — when were the roof, HVAC, electrical panel, plumbing, and water heater last replaced?
- Property tax is high relative to price — has the assessment been appealed recently, and will the sale trigger a re-assessment?
- What's the actual annual flood-insurance premium (NFIP or private), and is the property in a SFHA with mandatory coverage?
- Why hasn't it sold? Are there any deal-killer items the seller is aware of (foundation, flood, title, zoning, code violations)?
- Is there a deadline driving the sale (1031 exchange, divorce, estate, relocation)? That informs how much negotiation room exists.
- The area grade is low — what's the realistic commute time and amenity access for the typical tenant pool here? Any planned neighborhood developments (good or bad) we should know about?
- What's the average days-on-market for RENTAL listings here right now (not sales)? A rising rental-DOM trend means longer vacancies and softer asking-rent achievability than the comps imply.
- What's the recent tenant-quality profile in this submarket — average credit score on applications, eviction rate, late-payment / NSF rate, and stable-employment percentage? A property-management company in the area should have these aggregated.
- How much new for-sale + rental construction is in the pipeline within 1–3 miles? Heavy new supply typically softens prices + rents 12–24 months out; constrained supply supports both.
Investment metrics
- 1% rule
- 1.11% ✓
- Cap rate
- 5.64%
- Cash-on-cash
- -2.32%
- DSCR
- 0.90
- GRM
- 7.5
CMA / ARV
- ARV (median comp)
- $228,829
- List price
- $99,000
- Delta
- -56.74%
- Verdict
- UNDERPRICED
- Comps
- 20 within 1.0 mi
Show comp detail 12 sales within ~0.75 mi
| Address | Dist | Beds/Ba | Sqft | Sold | Price | $/sf | Match |
|---|---|---|---|---|---|---|---|
| 1518 W Water St | 0.50mi | 4/2.0 (+1) | 2,278 (+0%) | 2mo | $225,000 | $99 | 70 |
| 73 Durland Ave | 0.33mi | 3/2.0 | 2,438 (+8%) | 4mo | $261,900 | $107 | 68 |
| 1307 W Church St | 0.20mi | 3/1.5 | 2,040 (-10%) | 4mo | $245,000 | $120 | 68 |
| 93 Durland Ave | 0.22mi | 4/3.5 (+1) | 2,441 (+8%) | 1mo | $305,000 | $125 | 65 |
| 1249 W Clinton St | 0.25mi | 4/2.5 (+1) | 2,064 (-9%) | 6mo | $274,900 | $133 | 61 |
| 1058 W 2nd St | 0.44mi | 4/2.5 (+1) | 2,394 (+6%) | 9mo | $340,000 | $142 | 56 |
| 1055 W Clinton St | 0.51mi | 3/2.5 | 2,453 (+8%) | 8mo | $299,900 | $122 | 54 |
| 94 Evergreen Ave | 0.64mi | 4/2.0 (+1) | 2,092 (-8%) | 4mo | $195,000 | $93 | 49 |
| 919 Fassett Rd | 0.62mi | 3/3.0 | 2,041 (-10%) | 10mo | $202,000 | $99 | 42 |
| 907 W Clinton St | 0.74mi | 3/2.0 | 1,958 (-14%) | 2mo | $275,000 | $140 | 41 |
| 711 Wall St | 0.73mi | 2/2.0 (-1) | 2,502 (+10%) | 6mo | $271,000 | $108 | 39 |
| 34 Sunnyside Dr | 0.56mi | 4/2.5 (+1) | 1,968 (-13%) | 8mo | $245,900 | $125 | 38 |
Match score weights: distance 35% · size 25% · config 20% · recency 20%. Top-matched comps best support the ARV.
Projected returns pro-forma
-3.0% appreciation · 3.0% rent growth · sell at horizon
- IRR
- -24.0%
- Equity multiple
- 0.18×
- Total profit
- $-22,793
- Equity at exit
- $14,761
- IRR
- -18.5%
- Equity multiple
- -0.01×
- Total profit
- $-27,994
- Equity at exit
- $8,560
Cash invested: $27,720 (down + closing). Projections, not guarantees.
Landlord ↔ Tenant lean methodology
- Overall (STATE)
- 15 Strongly Tenant-Friendly
- State New York
- 15 Strongly Tenant-Friendly · D+10
- County
- — inherits STATE
- City
- — inherits STATE
ZIP-level market 14905
- Home prices YoY
- -9.4%
- Active inventory
- 39
- Price-to-rent
- 7.5×
Monthly cashflow live
- Estimated rent
- $1,100 medium interval (Pro) →
- Mortgage (P&I)
- −$519
- Tax from tax record
- −$362 /mo · $4,346/yr
- Insurance
- −$41
- Flood insurance flood zone
- −$56 /mo · $666/yr
- HOA
- −$0
- Vacancy / Maint / Mgmt
- −$231
- Net cashflow
- $-109
Break-even live
UW: 25.0% down · 7.5% · 30yr · 1.5% tax · 5.0% vac · 8.0% maint · 8.0% mgmt
Financing live
Cash to close
- Down payment
- $24,750
- Closing costs
- $2,970
- Reserves months
- —
- Total cash needed
- —
Loan-product check · same deal, 3 products live
Conventional
25% down · 7.5% · 30yr
- Down + closing
- —
- Monthly P&I
- —
- Monthly cashflow
- —
- DSCR
- —
- Eligible?
- —
Personal DTI + credit; lowest rate.
DSCR
20% down · 8.5% · 30yr
- Down + closing
- —
- Monthly P&I
- —
- Monthly cashflow
- —
- DSCR
- —
- Eligible?
- —
No personal income docs; deal must DSCR.
Hard money
10% down · 12.0% · 12mo
- Down + closing
- —
- Monthly P&I
- —
- Monthly cashflow
- —
- DSCR
- —
- Eligible?
- —
Short-term bridge; refi at stabilization.
Rent comps 1 comps
| Address | Beds | Baths | Sqft | Rent | $/sqft | DOM | Units | Dist |
|---|---|---|---|---|---|---|---|---|
| 715 W Water St Unit A Elmira, NY | 2.0 | 1.0 | 2246 | $1,100 | $0.49 | 43d | 1 | 1.05mi |
Listing history 21 events
-
2026-06-19days on market $99,000 Active 102 DOM
-
2026-06-18days on market $99,000 Active 101 DOM
-
2026-06-17days on market $99,000 Active 100 DOM
-
2026-06-16days on market $99,000 Active 99 DOM
-
2026-06-15days on market $99,000 Active 98 DOM
-
2026-06-14days on market $99,000 Active 96 DOM
-
2026-06-12days on market $99,000 Active 95 DOM
-
2026-06-09days on market $99,000 Active 92 DOM
-
2026-06-08days on market $99,000 Active 91 DOM
-
2026-06-07days on market $99,000 Active 90 DOM
-
2026-06-05days on market $99,000 Active 87 DOM
-
2026-06-03days on market $99,000 Active 86 DOM
-
2026-06-02days on market $99,000 Active 85 DOM
-
2026-06-01days on market $99,000 Active 84 DOM
-
2026-05-31days on market $99,000 Active 83 DOM
-
2026-05-30days on market $99,000 Active 82 DOM
-
2026-04-17price $99,000 708-char remark
Show marketing remark (708 chars)
Located near Hendy Elementary and the West Elmira Fire Department, this spacious 4-bedroom, 2-bath home offers incredible potential. Once a two-unit apartment house, the property retains its original layout with separate upstairs and downstairs living areas—perfect for those seeking to reconvert it into a duplex or maintain as a single-family residence. Inside, you'll find generously sized rooms throughout, many of which are just waiting to be restored to their former glory. With a bit of vision and TLC, this home can shine once again. Whether you're looking to create a multi-family income property or your dream home in a prime location, this West Elmira gem offers endless possibilities!"
-
2026-03-09$139,000 Active 708-char remark
Show marketing remark (708 chars)
Located near Hendy Elementary and the West Elmira Fire Department, this spacious 4-bedroom, 2-bath home offers incredible potential. Once a two-unit apartment house, the property retains its original layout with separate upstairs and downstairs living areas—perfect for those seeking to reconvert it into a duplex or maintain as a single-family residence. Inside, you'll find generously sized rooms throughout, many of which are just waiting to be restored to their former glory. With a bit of vision and TLC, this home can shine once again. Whether you're looking to create a multi-family income property or your dream home in a prime location, this West Elmira gem offers endless possibilities!"
-
2026-02-23historical
-
2025-11-05status Active
-
2025-08-21$179,900 Active
ⓘ Source: listings_history table (triggers on properties + properties_extension) + one-shot
backfill from property_details.listing_events for pre-trigger history.
Tax reassessment forecast NY · Partial reset (capped growth)
- Current annual tax
- $4,346 · $362/mo
- Projected year-2 tax
- $4,346 · $362/mo
- Expected delta
- $0/yr ($0/mo · 0.0%)
ⓘ Screening estimate from a state-policy table — verify with the county assessor before closing.
Climate risk First Street
- Flood 8/10 Severe FEMA zone X · 99% chance over 30 yrs
- Wildfire 1/10 Low
- Heat 3/10 Moderate 8 d/yr ≥97°F today · 18 d/yr by 30 yrs out
- Wind 1/10 Low 100% chance of damaging wind over 30 yrs
- Air quality 1/10 Low 0 unhealthy d/yr today · 0 by 30 yrs out
Nearby sold comps map
Loading sold comps map…
Walkable amenities ~0.75 mi
Loading nearby amenities…
Taxation est. · year 1
- Rental income
- $13,200
- − Mortgage interest
- −$5,546
- − Property taxes
- −$4,346
- − Insurance
- −$1,162
- − Repairs & maintenance
- −$1,056
- − Management
- −$1,056
- − Depreciation
- −$2,880
- Taxable loss
- −$2,845
- Est. tax savings @ 24.0%
- +$683
- After-tax cash flow
- $-626/yr
For passive investors: Depreciation is non-cash, so a rental often shows a tax loss while cash-flowing — sheltering income. Rental losses are passive: they offset passive income freely, and up to $25,000/yr can offset ordinary (W-2) income if you actively participate and your MAGI is under $100k (phasing out to $0 by $150k); unused losses carry forward. On sale, claimed depreciation is recaptured at up to 25%, and gains may owe capital-gains tax (a 1031 exchange can defer both). Figures are a year-1 estimate at your 24.0% rate — not tax advice; consult a CPA.
Schools (NCES district)
- District
- Elmira City School District
- NCES district ID
- 3610560
- Math proficiency
- 23% ▼ -7.00%
- Reading proficiency
- 35% ▲ 7.00%
- Median HH income
- $40,180
- Composite
- 24.39/100
- National rank
- #7688
- State rank
- #580 of 590 in NY
Livability — West Elmira
- Score
- 72/100
- State rank
- #341
- US rank
- #5769
Category grades
Schools grade is shown separately in the Schools card above.
Census & demographics
- Census place
- West Elmira, NY
- City population
- 8,976
- Population (ZIP)
- 8,976
Population outlook (Chemung County) Hauer SSP2
- Today (2025)
- 82,931 people
- By 2030
- 80,356 · -3.1%
- By 2040
- 74,745 · -9.9%
- By 2050
- 69,012 · -16.8%
- By 2075
- 55,689 · -32.8%
- By 2100
- 41,428 · -50.0%
Race, ethnicity, and origin ACS 2023
- Neighborhood character
- Predominantly White (82%)
- Race & ethnicity
- White 82% Two or more races 7% Black 7% Hispanic / Latino 3% Asian 3%
- Common ancestry
- Romanian 4% Lithuanian 3% Slovak 2%
- Foreign-born
- 5% · Canada, China
- Languages at home
- 93% English-only · Spanish 2% Chinese 1% Russian/Polish/Slavic 1%
Political lean MEDSL · Chemung
- 2024 margin
- R (+16.8) · D 41.6% · R 58.4%
- 2008→2024 swing
- -15.6pp toward R · 2008: -1.2pp · 2024: -16.8pp
- All cycles
- 2024: R+16.8 2020: R+13.4 2016: R+20.0 2012: R+2.9 2008: R+1.2
Not yet ingested
- Civics
- —
Market trends
- HPI YoY
- ▼ -26.09%
- Current HPI
- 252.0326
- Rent YoY
- —
- Metro
- —
- State GDP YoY
- ▲ 2.60%
- F500 in state
- 92
Industry mix (Fortune 500 HQ in NY)
| Industry | F500 HQs | Revenue |
|---|---|---|
| Financial Services | 10 | $950B |
|
||
| Consumer Goods | 9 | $162B |
|
||
| Insurance | 4 | $225B |
|
||
| Telecommunications | 2 | $144B |
|
||
| Pharmaceuticals | 2 | $112B |
|
||
| Media / Entertainment | 2 | $69B |
|
||
Price history
-45.0% since first listed5 events — show timeline
- 2026-04-17 Price Changed $99,000 UNYREIS
- 2026-03-09 Listed $139,000 UNYREIS
- 2026-02-23 Listing Removed — UNYREIS
- 2025-11-05 Relisted — UNYREIS
- 2025-08-21 Listed $179,900 UNYREIS
Property tax history
+5.5%/yrLatest (2025): $4,346 · +94.5% YoY. Source: county tax records.
Cash-flow waterfall
monthlySold comps — $/sqft
last 12 mo · ≤1 miLoading sold comps…