 Triplex
🌊 Lakefront
Triplex
🌊 Lakefront
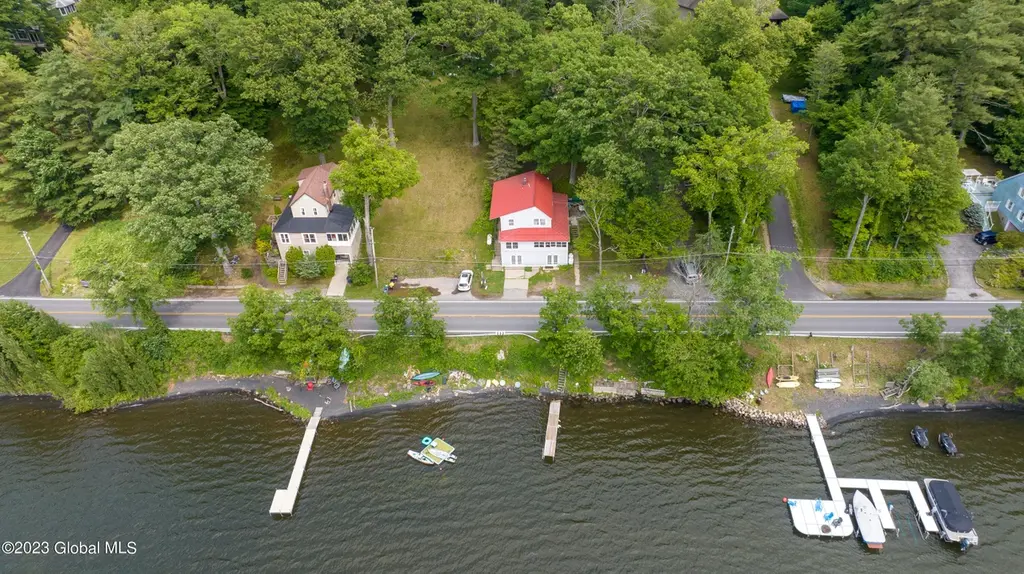
774 Nys Route 9P · Saratoga Springs, NY
Flood risk 1/10 · Minimal
- FEMA flood zone
- X
- Chance of flooding over 30 yrs
- 0.0%
- Est. flood insurance / yr
- $473 – $860
Fire risk 3/10 · Minor
- Est. fire insurance / yr
- $691 – $1,283
Heat risk 3/10 · Minor
- Hot days now (above 96°F)
- 7 days/yr
- Hot days in 30 yrs
- 16 days/yr
Wind risk 3/10 · Minor
- Chance of severe wind over 30 yrs
- 5.0%
Air-quality risk 2/10 · Minimal
- Unhealthy air days now
- 0 days/yr
- Unhealthy air days in 30 yrs
- 1 days/yr
Risk factors via First Street. Map © Google.
Why this score? — see what drove the B grade
The composite is a weighted blend of 9 inputs, each scored 0–100. Each bar is that input's sub-score; the figure is the points it added to the 100-point composite (weight × sub-score).
- Cash flow +30.0/30.0
- 1% rule +10.0/10.0
- DSCR +10.0/10.0
- ARV discount +7.5/15.0
- Schools +5.2/10.0
- Rent growth +4.8/5.0
- Livability +4.1/5.0
- Condition / age +2.5/5.0
- Appreciation +0.0/10.0
$600,000
🖨 Deal sheet 📄 Offer letter ✓ Due diligence
Multi-family units
County records classify this as Multi-Family (2-4 Unit). Listing-text estimate: 3 units. confirmed
Listing remarks MLS
BEAUTIFUL VIEW OF SARATOGA LAKE! 170' PRIV. FRONTAGE! PROPERTY CONSISTS OF2 HOUSES. 1 HSE IS A GRANDFATHERED 3 FAM. THE OTHER A 2 BEDRM MOD. READY TO OCCUPY OR TEAR DOWN & BUILD. GARAGES UNDER OFFSTREET PKG. Very Good Condition
Key facts
- 0.55 acre lot
- 11 parking spots
- Built 1930
Neighborhood map
What this means for you Summary
Snapshot
- This is a 3 × 5-bed/3.0-bath units multifamily listed at $600k.
Deal economics
- At list price, monthly cash flow is $3k ($39k/yr) — positive. Per door: $1k/mo.
- The deal already cash-flows at list — no discount required.
- Meets the 1% rule at list price ($9k rent vs $600k).
- Recommended offer: $582k (3.0% below list) — sets the bar for market timing.
- Cap rate 12.9% vs local median 2.0% in Saratoga Springs — top-decile yield for the area; either an underpriced asset or a hidden risk that comps aren't pricing in. Stress-test before assuming the spread holds.
Location & tenants
- Location reads 82/100 on livability (#83 in NY, #1,284 nationally) — a professional / high-income tenant draw. Strengths: employment A+, housing A+, health & safety A; Watch: amenities D+, cost of living F.
- Stillwater Central School District (suburban): math 56% / reading 60% proficiency, ranked #238 of 590 in NY (top 40%) — acceptable for families but not a draw, mixed tenant base, ~2y average lease.
- Zoned schools: Stillwater Elementary School (math 57% / reading 62%, grade B-, #745 of 2,108 statewide, top 39%, 499 students, 32% FRL); Stillwater Middle School High School (math 55% / reading 62%, grade C, #877 of 1,100 statewide, top 80%, 525 students, 30% FRL).
- Market conditions: Rents rising fast (+9.2%/yr); 474 active listings in the ZIP; 1 comparable units currently listed for rent nearby; solid renter incomes; 1,132 units permitted in Saratoga County in 2024 (378 in 5+ unit buildings).
- At $9,372/mo this rent would consume 110% of the median local household income ($102k/yr) (locally 1424% of renters already pay >50% of income on rent) — very limited rent-growth headroom before tenants either downsize or default.
Forward outlook
- Local home prices are declining (-3.0%/yr); year-one equity from $4k of loan paydown is wiped out by about $18k of value loss. Plan a longer hold.
- Saratoga County population projected at +4% by 2050 — modest demand growth; plan on rents tracking national, not racing it.
- At projected returns (-3.0% appreciation + 8.0% rent growth), your $168k cash investment doubles in ~5 years — after that, you're playing with house money.
Negotiation context
- It's been on market 60 days — a 3% lower offer ($582k) is reasonable based on typical stale-listing flexibility.
- 3 sale attempts since 24y ago; this cycle's ask has dropped $50k (8%) from the opening price — seller is motivated, your offer sets the floor, not the list.
- Current owner paid $360k; list at $600k implies a 67% gain — meaningful room to come down on a strong offer.
Risks & watch-outs
- Watch-outs: built in 1930 — expect roof / HVAC / electrical / plumbing capex.
Questions for the listing agent
- It's been on market 60 days. Have you received any prior offers? Is the seller open to a 3% concession, seller financing, or rate buy-down credit?
- Can we see the unit-by-unit rent roll, current vacancy, and any below-market leases? What's the average tenancy length?
- What capital expenditures (roof, boiler, parking lot, exteriors) have been made in the last 5 years, and what's planned in the next 2?
- Built in 1930 — when were the roof, HVAC, electrical panel, plumbing, and water heater last replaced?
- Is there a deadline driving the sale (1031 exchange, divorce, estate, relocation)? That informs how much negotiation room exists.
- Schools are A-rated — typically a magnet for longer-tenancy family renters. What's the average tenant stay here, and is there a school-zone premium baked into asking?
- This sits on a lake — are riparian / water-frontage rights deeded with the parcel? Any dock permits, shoreline easements, or HOA water-use restrictions?
- What's the documented flood / surge / shoreline-erosion history here (FEMA AND non-FEMA — e.g., storm surge, creek backup, septic-field saturation)?
- Any water-quality or seasonal algae-bloom issues that affect tenant satisfaction or short-term-rental demand?
- What's the average days-on-market for RENTAL listings here right now (not sales)? A rising rental-DOM trend means longer vacancies and softer asking-rent achievability than the comps imply.
- What's the recent tenant-quality profile in this submarket — average credit score on applications, eviction rate, late-payment / NSF rate, and stable-employment percentage? A property-management company in the area should have these aggregated.
- How much new apartment / multifamily construction is in the pipeline within 1–3 miles? Heavy new supply (>2% of stock underway) typically softens rents 12–24 months out; light construction supports rent growth.
Investment metrics
- 1% rule
- 1.56% ✓
- Cap rate
- 12.86%
- Cash-on-cash
- 23.47%
- DSCR
- 2.04
- GRM
- 5.3
CMA / ARV
- ARV (on-the-fly)
- $1,284,826
- Comps found
- 1
Show comp detail 1 sale within ~0.75 mi
| Address | Dist | Beds/Ba | Sqft | Sold | Price | $/sf | Match |
|---|---|---|---|---|---|---|---|
| 728 Route 9p | 0.41mi | 6/3.0 (+1) | 2,750 (+13%) | 22mo | $1,450,000 | $527 | 36 |
Match score weights: distance 35% · size 25% · config 20% · recency 20%. Top-matched comps best support the ARV.
Projected returns pro-forma
-3.0% appreciation · 8.0% rent growth · sell at horizon
- IRR
- 22.1%
- Equity multiple
- 1.96×
- Total profit
- $161,666
- Equity at exit
- $89,462
- IRR
- 33.2%
- Equity multiple
- 4.79×
- Total profit
- $636,135
- Equity at exit
- $51,877
Cash invested: $168,000 (down + closing). Projections, not guarantees.
Landlord ↔ Tenant lean methodology
- Overall (STATE)
- 15 Strongly Tenant-Friendly
- State New York
- 15 Strongly Tenant-Friendly · D+10
- County
- — inherits STATE
- City
- — inherits STATE
ZIP-level market 12866
- Home prices YoY
- -31.8%
- Rents YoY
- 9.2%
- Active inventory
- 474
- Price-to-rent
- 16.0×
Monthly cashflow live
- Estimated rent
- $9,372 medium interval (Pro) →
- Mortgage (P&I)
- −$3,146
- Tax from tax record
- −$722 /mo · $8,666/yr
- Insurance
- −$250
- HOA
- −$0
- Vacancy / Maint / Mgmt
- −$1,968
- Net cashflow
- $3,285
Break-even live
3-unit breakdown (identical units grouped — click to expand)
| Units | Beds | Baths | Est. rent |
|---|---|---|---|
| 3× units | 5 | 3 | $9,372 |
| #1 | 5 | 3 | $3,124 |
| #2 | 5 | 3 | $3,124 |
| #3 | 5 | 3 | $3,124 |
| Total (3 units) | $9,372 | ||
UW: 25.0% down · 7.5% · 30yr · 1.5% tax · 5.0% vac · 8.0% maint · 8.0% mgmt
Financing live
Cash to close
- Down payment
- $150,000
- Closing costs
- $18,000
- Reserves months
- —
- Total cash needed
- —
Loan-product check · same deal, 3 products live
Conventional
25% down · 7.5% · 30yr
- Down + closing
- —
- Monthly P&I
- —
- Monthly cashflow
- —
- DSCR
- —
- Eligible?
- —
Personal DTI + credit; lowest rate.
DSCR
20% down · 8.5% · 30yr
- Down + closing
- —
- Monthly P&I
- —
- Monthly cashflow
- —
- DSCR
- —
- Eligible?
- —
No personal income docs; deal must DSCR.
Hard money
10% down · 12.0% · 12mo
- Down + closing
- —
- Monthly P&I
- —
- Monthly cashflow
- —
- DSCR
- —
- Eligible?
- —
Short-term bridge; refi at stabilization.
Rent comps 1 comps
| Address | Beds | Baths | Sqft | Rent | $/sqft | DOM | Units | Dist |
|---|---|---|---|---|---|---|---|---|
| 9 Woodlake Dr Saratoga Springs, NY | 5.0 | 3.5 | 2762 | $5,194 | $1.88 | 23d | 1 | 0.83mi |
Listing history 10 events
-
2023-08-18status Pending
-
2023-08-01historical Contingent
-
2023-07-21price $600,000
-
2023-06-19$650,000 Active
-
2023-03-22historical Contingent
-
2023-03-22historical
-
2022-12-28$650,000 Active
-
2003-08-26soldstatus $360,000 231-char remark
Show marketing remark (231 chars)
BEAUTIFUL VIEW OF SARATOGA LAKE! 170' PRIV. FRONTAGE! PROPERTY CONSISTS OF2 HOUSES. 1 HSE IS A GRANDFATHERED 3 FAM. THE OTHER A 2 BEDRM MOD. READY TO OCCUPY OR TEAR DOWN & BUILD. GARAGES UNDER OFFSTREET PKG. Very Good Condition
-
2003-02-24historical 231-char remark
Show marketing remark (231 chars)
BEAUTIFUL VIEW OF SARATOGA LAKE! 170' PRIV. FRONTAGE! PROPERTY CONSISTS OF2 HOUSES. 1 HSE IS A GRANDFATHERED 3 FAM. THE OTHER A 2 BEDRM MOD. READY TO OCCUPY OR TEAR DOWN & BUILD. GARAGES UNDER OFFSTREET PKG. Very Good Condition
-
2002-09-25$400,000 231-char remark
Show marketing remark (231 chars)
BEAUTIFUL VIEW OF SARATOGA LAKE! 170' PRIV. FRONTAGE! PROPERTY CONSISTS OF2 HOUSES. 1 HSE IS A GRANDFATHERED 3 FAM. THE OTHER A 2 BEDRM MOD. READY TO OCCUPY OR TEAR DOWN & BUILD. GARAGES UNDER OFFSTREET PKG. Very Good Condition
ⓘ Source: listings_history table (triggers on properties + properties_extension) + one-shot
backfill from property_details.listing_events for pre-trigger history.
Tax reassessment forecast NY · Partial reset (capped growth)
- Current annual tax
- $8,666 · $722/mo
- Projected year-2 tax
- $9,403 · $784/mo
- Expected delta
- +$737/yr (+$61/mo · 8.5%)
ⓘ Screening estimate from a state-policy table — verify with the county assessor before closing.
Climate risk First Street
- Flood 1/10 Low FEMA zone X · 0% chance over 30 yrs
- Wildfire 3/10 Moderate
- Heat 3/10 Moderate 7 d/yr ≥96°F today · 16 d/yr by 30 yrs out
- Wind 3/10 Moderate 5% chance of damaging wind over 30 yrs
- Air quality 2/10 Low 0 unhealthy d/yr today · 1 by 30 yrs out
Nearby sold comps map
Loading sold comps map…
Walkable amenities ~0.75 mi
Loading nearby amenities…
Taxation est. · year 1
- Rental income
- $112,464
- − Mortgage interest
- −$33,609
- − Property taxes
- −$8,666
- − Insurance
- −$3,000
- − Repairs & maintenance
- −$8,997
- − Management
- −$8,997
- − Depreciation
- −$17,455
- Taxable income
- $31,740
- Est. tax owed @ 24.0%
- −$7,618
- After-tax cash flow
- $31,805/yr
For passive investors: Depreciation is non-cash, so a rental often shows a tax loss while cash-flowing — sheltering income. Rental losses are passive: they offset passive income freely, and up to $25,000/yr can offset ordinary (W-2) income if you actively participate and your MAGI is under $100k (phasing out to $0 by $150k); unused losses carry forward. On sale, claimed depreciation is recaptured at up to 25%, and gains may owe capital-gains tax (a 1031 exchange can defer both). Figures are a year-1 estimate at your 24.0% rate — not tax advice; consult a CPA.
Schools (NCES district)
- District
- Stillwater Central School District
- NCES district ID
- 3628110
- Math proficiency
- 56% ▼ -13.00%
- Reading proficiency
- 60% ▲ 2.00%
- Median HH income
- $72,025
- Composite
- 51.51/100
- National rank
- #1721
- State rank
- #238 of 590 in NY
Livability — Saratoga Springs
- Score
- 82/100
- State rank
- #83
- US rank
- #1284
Category grades
Schools grade is shown separately in the Schools card above.
Census & demographics
- County
- Saratoga County · 166,192 people
- City population
- 40,057
- Metro
- Albany-Schenectady-Troy, NY
- Population (ZIP)
- 40,057
- Household income
- $101,901
- Rent vs Own
- Severe rent burden
- 1424.0
Population outlook (Saratoga County) Hauer SSP2
- Today (2025)
- 238,889 people
- By 2030
- 243,681 · +2.0%
- By 2040
- 249,118 · +4.3%
- By 2050
- 248,638 · +4.1%
- By 2075
- 241,675 · +1.2%
- By 2100
- 213,150 · -10.8%
Race, ethnicity, and origin ACS 2023
- Neighborhood character
- Predominantly White (87%)
- Race & ethnicity
- White 87% Two or more races 5% Hispanic / Latino 4% Asian 2% Black 2%
- Common ancestry
- Romanian 6% Lithuanian 5% Slovak 2%
- Foreign-born
- 6% · Canada, South Korea, China
- Languages at home
- 92% English-only · Spanish 2% German/W. Germanic 1% Korean 1%
Political lean MEDSL · Saratoga
- 2024 margin
- Toss-up / Even · D 50.9% · R 49.1%
- 2008→2024 swing
- -1.6pp toward R · 2008: 3.4pp · 2024: 1.8pp
- All cycles
- 2024: D+1.8 2020: D+5.4 2016: R+4.4 2012: D+2.1 2008: D+3.4
Not yet ingested
- Civics
- —
Market trends
- HPI YoY
- ▼ -178.78%
- Current HPI
- 382.7429
- Rent YoY
- ▲ 9.15%
- Metro
- Albany-Schenectady-Troy, NY
- State GDP YoY
- ▲ 2.60%
- F500 in state
- 92
Industry mix (Fortune 500 HQ in NY)
| Industry | F500 HQs | Revenue |
|---|---|---|
| Financial Services | 10 | $950B |
|
||
| Consumer Goods | 9 | $162B |
|
||
| Insurance | 4 | $225B |
|
||
| Telecommunications | 2 | $144B |
|
||
| Pharmaceuticals | 2 | $112B |
|
||
| Media / Entertainment | 2 | $69B |
|
||
Price history
+50.0% since first listed10 events — show timeline
- 2023-08-18 Pending — Global MLS
- 2023-08-01 Contingent — Global MLS
- 2023-07-21 Price Changed $600,000 Global MLS
- 2023-06-19 Listed $650,000 Global MLS
- 2023-03-22 Contingent — Global MLS
- 2023-03-22 Listing Removed — Global MLS
- 2022-12-28 Listed $650,000 Global MLS
- 2003-08-26 Sold (MLS) $360,000 Global MLS
- 2003-02-24 Listing Removed — Global MLS
- 2002-09-25 Listed $400,000 Global MLS
Property tax history
+2.1%/yrLatest (2025): $8,666 · +1.2% YoY. Source: county tax records.
Cash-flow waterfall
monthlySold comps — $/sqft
last 12 mo · ≤1 miLoading sold comps…