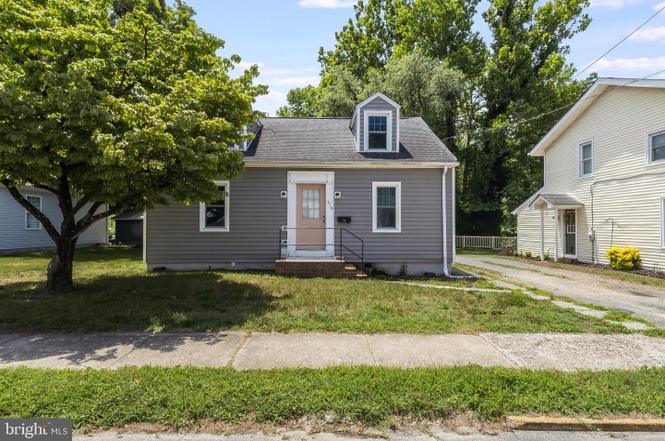
316 E 6th St · Laurel, DE
Flood risk 1/10 · Minimal
- FEMA flood zone
- X (unshaded)
- Chance of flooding over 30 yrs
- 0.0%
- Est. flood insurance / yr
- $473 – $860
Fire risk 1/10 · Minimal
- Est. fire insurance / yr
- $476 – $884
Heat risk 8/10 · Major
- Hot days now (above 105°F)
- 7 days/yr
- Hot days in 30 yrs
- 16 days/yr
Wind risk 7/10 · Major
- Chance of severe wind over 30 yrs
- 76.0%
Air-quality risk 3/10 · Minor
- Unhealthy air days now
- 2 days/yr
- Unhealthy air days in 30 yrs
- 2 days/yr
Risk factors via First Street. Map © Google.
Why this score? — see what drove the B- grade
The composite is a weighted blend of 9 inputs, each scored 0–100. Each bar is that input's sub-score; the figure is the points it added to the 100-point composite (weight × sub-score).
- Cash flow +22.2/30.0
- ARV discount +15.0/15.0
- Appreciation +10.0/10.0
- DSCR +7.1/10.0
- 1% rule +4.7/10.0
- Livability +3.2/5.0
- Rent growth +2.5/5.0
- Condition / age +2.5/5.0
- Schools +1.8/10.0
$175,000
🖨 Deal sheet 📄 Offer letter ✓ Due diligence
Listing remarks MLS
Situated in the Town Limits of Laurel is this 3 bedroom, 1 bathroom single family home with detached 2 car garage. With some TLC, this property can surely shine. Excellent opportunity for an investor. Property is being sold as is. No warrantied expressed or implied.
Key facts
- Hardwood flooring
- Rear patio
- Built-in storage
Tags
Property features AI
Exterior
- Parking: Detached side-entry garage (1-car); Gravel driveway with two driveway spaces; Total of 3 garage/parking spaces
- Utilities: Public water; Public sewer; 200+ amp electrical service with circuit breakers; Tankless hot water (natural gas)
- Home design: Detached home; Estimated 1,300 finished above-grade square feet; Fee simple ownership; Located in a federal flood zone; Two or more access exits
- Construction: Stick built construction with vinyl siding; Block foundation; Partial basement (finished/unfinished status noted); Built year source: Assessor
- Exterior features: Patio(s); Sidewalks; Cleared lot
Interior
- Kitchen: Electric oven/range; Exhaust fan; Refrigerator; Icemaker
- Bedrooms: Two bedrooms on the main level; One bedroom on the upper level
- Bathrooms: One full bathroom on the main level; One full bathroom total
- Heating & cooling: Forced air heating fueled by natural gas; Central air conditioning; Window A/C units
- Interior features: Attic; Window treatments; Ceiling fans
- Laundry & utility: Washer included; Laundry hookups in the basement
Neighborhood map
What this means for you Summary
Snapshot
- This is a 3-bed/1.0-bath single-family listed at $175k.
Deal economics
- At list price, monthly cash flow is $286 ($3k/yr) — positive.
- The deal already cash-flows at list — no discount required.
- To meet the 1% rule (rent ≥ 1% of price), the offer needs to be $170k (3.1% below list).
- Recommended offer: $170k (3.1% below list) — sets the bar for 1% rule.
- Cap rate 8.3% vs local median 3.9% in Laurel — top-decile yield for the area; either an underpriced asset or a hidden risk that comps aren't pricing in. Stress-test before assuming the spread holds.
Location & tenants
- Location reads 63/100 on livability (#57 in DE) — a middle-class / working-renter tenant base. Strengths: cost of living A+, health & safety A+, housing A; Watch: employment D+, schools F, crime F.
- Laurel School District (suburban): math 15% / reading 27% proficiency, ranked #25 of 26 in DE (top 96%) — low school quality limits family demand, transient renter base, plan for 1-2y turnover.
- Market conditions: 92 active listings in the ZIP; 1 comparable units currently listed for rent nearby; 4,354 units permitted in Sussex County in 2024 (344 in 5+ unit buildings).
Forward outlook
- In year one you build about $19k of equity ($1k loan paydown + $18k appreciation (10.0% local appreciation)).
- Sussex County population projected at +25% by 2050 — long-run rental-demand tailwind backs the buy-and-hold thesis.
- At projected returns (10.0% appreciation + 3.0% rent growth), your $49k cash investment doubles in ~3 years — after that, you're playing with house money.
- By year 2, paydown + projected appreciation supports a ~$30k cash-out refi (75% LTV) — recoverable capital for the next deal without selling this one.
Negotiation context
- Only 1 days on market — expect competitive offers; lowballing is unlikely to land.
- 4 sale attempts since 12y ago with the ask held roughly flat each time — persistent listings suggest the price (not the market) is what's stuck; bring a comps-based counter.
- Current owner paid $38k; list at $175k implies a 367% gain — meaningful room to come down on a strong offer.
Risks & watch-outs
- Climate carrying-cost: major wind risk, 76% chance of damaging wind over 30y; extreme-heat days projected 7→16/yr by 2055 (HVAC capex compounding) — expect insurance premiums to compound above CPI over the hold.
Questions for the listing agent
- Is there a deadline driving the sale (1031 exchange, divorce, estate, relocation)? That informs how much negotiation room exists.
- Schools are F-rated, which usually means shorter tenancies and higher turnover. Who's the typical renter profile here, and what's been the actual vacancy rate?
- Crime grade is F in this area — have there been break-ins, vandalism, or insurance claims at this property in the last 3 years? What carrier currently insures it and at what premium?
- What's the average days-on-market for RENTAL listings here right now (not sales)? A rising rental-DOM trend means longer vacancies and softer asking-rent achievability than the comps imply.
- What's the recent tenant-quality profile in this submarket — average credit score on applications, eviction rate, late-payment / NSF rate, and stable-employment percentage? A property-management company in the area should have these aggregated.
- How much new for-sale + rental construction is in the pipeline within 1–3 miles? Heavy new supply typically softens prices + rents 12–24 months out; constrained supply supports both.
Investment metrics
- 1% rule
- 0.97% ✗
- Cap rate
- 8.25%
- Cash-on-cash
- 7.00%
- DSCR
- 1.31
- GRM
- 8.6
CMA / ARV
- ARV (on-the-fly)
- $256,100
- Comps found
- 9
Show comp detail 9 sales within ~0.75 mi
| Address | Dist | Beds/Ba | Sqft | Sold | Price | $/sf | Match |
|---|---|---|---|---|---|---|---|
| 10997 Trussum Pond Rd | 0.28mi | 3/1.0 | 1,340 (+3%) | 7mo | $242,500 | $181 | 76 |
| 32497 Park Dr | 0.26mi | 2/1.5 (-1) | 1,352 (+4%) | 19mo | $320,000 | $237 | 58 |
| 514 E 4th St | 0.19mi | 4/1.5 (+1) | 1,363 (+5%) | 22mo | $180,000 | $132 | 58 |
| 202 West 7 Th St W | 0.42mi | 3/2.0 | 1,300 (0%) | 23mo | $175,000 | $135 | 57 |
| 116 Broad Creek Rd | 0.65mi | 3/1.5 | 1,400 (+8%) | 5mo | $250,000 | $179 | 50 |
| 136 Oak Lane Dr | 0.25mi | 3/1.5 | 1,450 (+12%) | 22mo | $300,000 | $207 | 49 |
| 510 Central Ave S | 0.35mi | 3/2.5 | 1,470 (+13%) | 15mo | $290,000 | $197 | 44 |
| 402-W 7th St | 0.68mi | 3/2.0 | 1,140 (-12%) | 14mo | $235,000 | $206 | 32 |
| 31030 N Poplar St | 0.73mi | 3/2.0 | 1,400 (+8%) | 20mo | $295,000 | $211 | 32 |
Match score weights: distance 35% · size 25% · config 20% · recency 20%. Top-matched comps best support the ARV.
Projected returns pro-forma
10.0% appreciation · 3.0% rent growth · sell at horizon
- IRR
- 29.4%
- Equity multiple
- 3.32×
- Total profit
- $113,442
- Equity at exit
- $157,654
- IRR
- 25.5%
- Equity multiple
- 7.52×
- Total profit
- $319,613
- Equity at exit
- $339,987
Cash invested: $49,000 (down + closing). Projections, not guarantees.
Landlord ↔ Tenant lean methodology
- Overall (STATE)
- 70 Landlord-Friendly
- State Delaware
- 70 Landlord-Friendly · D+7
- County
- — inherits STATE
- City
- — inherits STATE
ZIP-level market 19956
- Home prices YoY
- 10.5%
- Active inventory
- 92
- Price-to-rent
- 8.6×
Monthly cashflow live
- Estimated rent
- $1,695 medium interval (Pro) →
- Mortgage (P&I)
- −$918
- Tax from tax record
- −$63 /mo · $751/yr
- Insurance
- −$73
- HOA
- −$0
- Vacancy / Maint / Mgmt
- −$356
- Net cashflow
- $286
Break-even live
UW: 25.0% down · 7.5% · 30yr · 1.5% tax · 5.0% vac · 8.0% maint · 8.0% mgmt
Financing live
Cash to close
- Down payment
- $43,750
- Closing costs
- $5,250
- Reserves months
- —
- Total cash needed
- —
Loan-product check · same deal, 3 products live
Conventional
25% down · 7.5% · 30yr
- Down + closing
- —
- Monthly P&I
- —
- Monthly cashflow
- —
- DSCR
- —
- Eligible?
- —
Personal DTI + credit; lowest rate.
DSCR
20% down · 8.5% · 30yr
- Down + closing
- —
- Monthly P&I
- —
- Monthly cashflow
- —
- DSCR
- —
- Eligible?
- —
No personal income docs; deal must DSCR.
Hard money
10% down · 12.0% · 12mo
- Down + closing
- —
- Monthly P&I
- —
- Monthly cashflow
- —
- DSCR
- —
- Eligible?
- —
Short-term bridge; refi at stabilization.
Rent comps 1 comps
| Address | Beds | Baths | Sqft | Rent | $/sqft | DOM | Units | Dist |
|---|---|---|---|---|---|---|---|---|
| 1205 W 6th St Laurel, DE | 3.0 | 2.0 | 1440 | $1,695 | $1.18 | 44d | 1 | 1.08mi |
Listing history 2 events
-
2026-06-19remarks 699-char remark
-
2026-06-19$175,000 Active 1 DOM
ⓘ Source: listings_history table (triggers on properties + properties_extension) + one-shot
backfill from property_details.listing_events for pre-trigger history.
Tax reassessment forecast DE · Partial reset (capped growth)
- Current annual tax
- $751 · $63/mo
- Projected year-2 tax
- $883 · $74/mo
- Expected delta
- +$132/yr (+$11/mo · 17.5%)
ⓘ Screening estimate from a state-policy table — verify with the county assessor before closing.
Climate risk First Street
- Flood 1/10 Low FEMA zone X (unshaded) · 0% chance over 30 yrs
- Wildfire 1/10 Low
- Heat 8/10 Severe 7 d/yr ≥105°F today · 16 d/yr by 30 yrs out
- Wind 7/10 Severe 76% chance of damaging wind over 30 yrs
- Air quality 3/10 Moderate 2 unhealthy d/yr today · 2 by 30 yrs out
Nearby sold comps map
Loading sold comps map…
Walkable amenities ~0.75 mi
Loading nearby amenities…
Taxation est. · year 1
- Rental income
- $20,340
- − Mortgage interest
- −$9,803
- − Property taxes
- −$751
- − Insurance
- −$875
- − Repairs & maintenance
- −$1,627
- − Management
- −$1,627
- − Depreciation
- −$5,091
- Taxable income
- $566
- Est. tax owed @ 24.0%
- −$136
- After-tax cash flow
- $3,294/yr
For passive investors: Depreciation is non-cash, so a rental often shows a tax loss while cash-flowing — sheltering income. Rental losses are passive: they offset passive income freely, and up to $25,000/yr can offset ordinary (W-2) income if you actively participate and your MAGI is under $100k (phasing out to $0 by $150k); unused losses carry forward. On sale, claimed depreciation is recaptured at up to 25%, and gains may owe capital-gains tax (a 1031 exchange can defer both). Figures are a year-1 estimate at your 24.0% rate — not tax advice; consult a CPA.
Schools (NCES district)
- District
- Laurel School District
- NCES district ID
- 1000810
- Math proficiency
- 15% ▼ -22.00%
- Reading proficiency
- 27% ▼ -19.00%
- Median HH income
- $47,135
- Composite
- 18.42/100
- National rank
- #8933
- State rank
- #25 of 26 in DE
Livability — Laurel
- Score
- 63/100
- State rank
- #57
- US rank
- #15428
Category grades
Schools grade is shown separately in the Schools card above.
Census & demographics
- Census place
- Laurel, DE
- Population (ZIP)
- 16,274
Population outlook (Sussex County) Hauer SSP2
- Today (2025)
- 248,853 people
- By 2030
- 264,464 · +6.3%
- By 2040
- 290,980 · +16.9%
- By 2050
- 311,259 · +25.1%
- By 2075
- 352,488 · +41.6%
- By 2100
- 367,406 · +47.6%
Race, ethnicity, and origin ACS 2023
- Neighborhood character
- Predominantly White (68%)
- Race & ethnicity
- White 68% Black 16% Hispanic / Latino 14% Two or more races 8%
- Hispanic origin (detail)
- Mexican 1% Puerto Rican 2%
- Common ancestry
- Russian 2% Italian 1% Hispanic 1%
- Foreign-born
- 9% · Canada
- Languages at home
- 86% English-only · Spanish 12% French/Haitian/Cajun 1%
Political lean MEDSL · Sussex
- 2024 margin
- R (+11.0) · D 43.9% · R 54.9% · Other 1.2%
- 2008→2024 swing
- -2.4pp toward R · 2008: -8.6pp · 2024: -11.0pp
- All cycles
- 2024: R+11.0 2020: R+11.2 2016: R+22.0 2012: R+13.0 2008: R+8.6
Not yet ingested
- Civics
- —
Market trends
- HPI YoY
- ▲ 28.72%
- Current HPI
- 301.6055
- Rent YoY
- —
- Metro
- —
- State GDP YoY
- —
- F500 in state
- 0
Price history
+192.2% since first listed7 events — show timeline
- 2026-06-18 Listed $175,000 BRIGHT MLS
- 2020-09-30 Listing Removed — BRIGHT MLS
- 2017-02-24 Sold (MLS) $37,500 BRIGHT MLS
- 2016-04-13 Listed $42,000 BRIGHT MLS
- 2015-10-01 Listing Removed — BRIGHT MLS
- 2014-10-06 Listed $59,900 BRIGHT MLS
- 2014-10-06 Listed $59,900 BRIGHT MLS
Property tax history
+14.4%/yrLatest (2025): $751 · +120.9% YoY. Source: county tax records.
Cash-flow waterfall
monthlySold comps — $/sqft
last 12 mo · ≤1 miLoading sold comps…