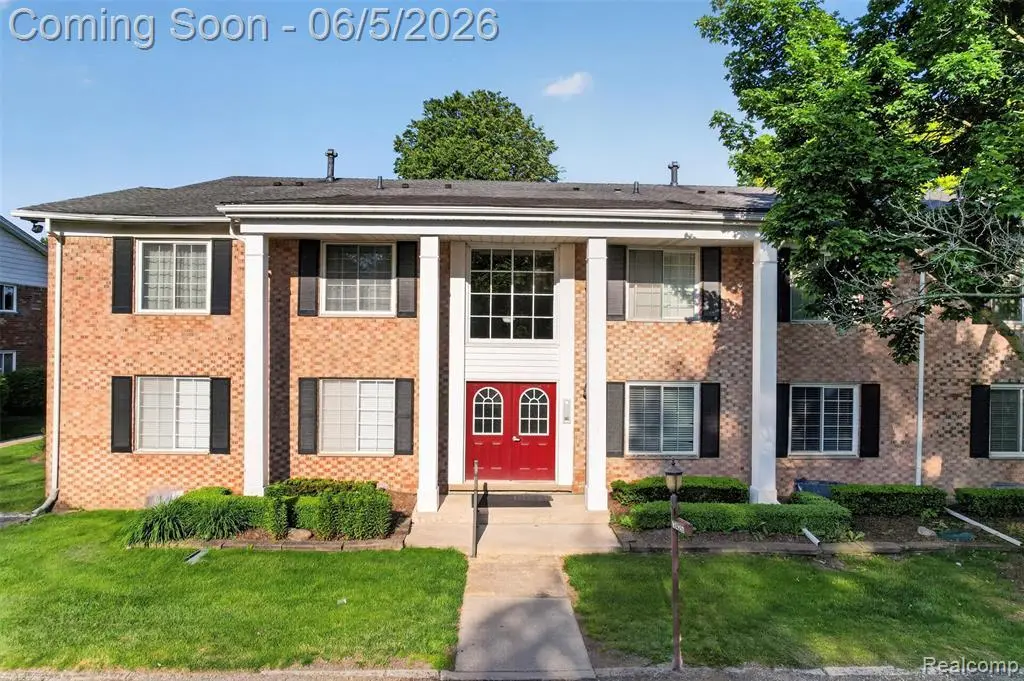
2425 Mulberry Square Sq #42 · Pontiac, MI
Flood risk 1/10 · Minimal
- FEMA flood zone
- X (unshaded)
- Chance of flooding over 30 yrs
- 0.0%
- Est. flood insurance / yr
- $473 – $860
Fire risk 1/10 · Minimal
- Est. fire insurance / yr
- $784 – $1,456
Heat risk 2/10 · Minimal
- Hot days now (above 98°F)
- 7 days/yr
- Hot days in 30 yrs
- 15 days/yr
Wind risk 2/10 · Minimal
- Chance of severe wind over 30 yrs
- —
Air-quality risk 3/10 · Minor
- Unhealthy air days now
- 2 days/yr
- Unhealthy air days in 30 yrs
- 4 days/yr
Risk factors via First Street. Map © Google.
Why this score? — see what drove the D grade
The composite is a weighted blend of 9 inputs, each scored 0–100. Each bar is that input's sub-score; the figure is the points it added to the 100-point composite (weight × sub-score).
- Cash flow +11.1/30.0
- ARV discount +7.5/15.0
- Schools +6.5/10.0
- 1% rule +6.0/10.0
- DSCR +3.2/10.0
- Livability +3.2/5.0
- Rent growth +2.5/5.0
- Condition / age +2.5/5.0
- Appreciation +0.0/10.0
$185,000
🖨 Deal sheet 📄 Offer letter ✓ Due diligence
Listing remarks MLS
Lovely first floor Mulberry Square condo. Updated eat in kitchen with lots of cupboard space. Newer windows and door wall. Your own deck and patio. Walk in closet and full bath in the master. Second bedroom closet has been converted for a computer/desk space but doors could be easily re-installed. Formal dining room and living room overlook the beautiful trees in the commons area. Community offers a pool and club house in a beautiful park-like setting. Large private storage area in the basement with laundry. Unit is at a quiet location, deep within the complex. Two assigned carports. Condo docs uploaded to Realcomp.
Key facts
- $385 HOA
- Community pool
- Built 1969
Property features AI
Finance
- Other: Association phone available
- HOA & community: Monthly association fee (about $385) — includes lawn maintenance, snow removal, trash removal, and clubhouse; Community clubhouse
Exterior
- Parking: Carport
- Utilities: Public water; Natural gas; Gas water heater; Public sewer (assumed through condo utilities)
- Home design: Condominium unit (Condo/Apt 1st floor); Unit number 42; Built in 1969; Subdivision: Mulberry Square
- Construction: Brick and vinyl siding exterior; Asphalt (roof); Basement foundation
- Exterior features: Inground pool; Patio; Paved street access; Pets allowed (cats and dogs; number limit applies)
Interior
- Kitchen: Kitchen on entry level — 10 x 9, ceramic flooring; Breakfast nook on entry level — 10 x 7, ceramic flooring; Dishwasher; Disposal; Microwave; Range/Oven; Refrigerator
- Bedrooms: Bedroom 1 on entry level — 12 x 17, vinyl flooring; Bedroom 2 on entry level — 11 x 12, vinyl flooring; Total of 8 rooms
- Flooring: Vinyl flooring in bedrooms, dining room and family room; Ceramic flooring in kitchen, breakfast nook and bathrooms
- Bathrooms: 2 full bathrooms; Bathroom 1 on entry level — ceramic flooring, about 7 x 10; Bathroom 2 on entry level — ceramic flooring, about 5 x 8
- Heating & cooling: Forced air heating; Natural gas heat and gas water heater; Central air conditioning; Ceiling fans
- Interior features: DSL available; Has basement (partially finished, common areas)
- Laundry & utility: Dryer
Neighborhood map
What this means for you Summary
Snapshot
- This is a 2-bed/2.0-bath condo listed at $185k.
Deal economics
- At list price, monthly cash flow is $-75 ($-902/yr) — negative.
- To cash-flow at today's rent, offer at most $172k (7.2% below list).
- Meets the 1% rule at list price ($2k rent vs $185k).
- Recommended offer: $172k (7.2% below list) — sets the bar for cash-flow.
Location & tenants
- Location reads 64/100 on livability (#499 in MI) — a middle-class / working-renter tenant base. Strengths: commute A+, cost of living A+, housing A+; Watch: health & safety D, schools F, crime F.
- Bloomfield Hills Schools (suburban): math 65% / reading 74% proficiency, ranked #5 of 540 in MI (top 1%) — acceptable for families but not a draw, mixed tenant base, ~2y average lease; only 7% free/reduced lunch — higher-income household profile.
- Market conditions: 138 active listings in the ZIP; 12 comparable units currently listed for rent nearby; rentals leasing fast (median 12d on market — plan ~1-2 weeks tenant-placement turnaround); high-income renter base; 2,614 units permitted in Oakland County in 2024 (721 in 5+ unit buildings).
- This rent is only 14% of the median local income ($178k/yr) — well below the 30% rent-burden line; pricing power to push rent on renewal without tenant pushback.
Forward outlook
- Local home prices are declining (-3.0%/yr); year-one equity from $1k of loan paydown is wiped out by about $6k of value loss. Plan a longer hold.
- Oakland County population projected at +10% by 2050 — modest demand growth; plan on rents tracking national, not racing it.
Negotiation context
- Only 7 days on market — expect competitive offers; lowballing is unlikely to land.
- 3 sale attempts since 23y ago; this cycle's ask is 65% above the opening price — seller raised mid-cycle; expect resistance to lowballs.
- Current owner paid $112k; list at $185k implies a 65% gain — meaningful room to come down on a strong offer.
Questions for the listing agent
- What do current leases actually rent for vs. the listed asking? Can we see a recent rent roll and the last 12 months of T-12 income?
- Built in 1969 — when were the roof, HVAC, electrical panel, plumbing, and water heater last replaced?
- What does the HOA fee cover, when was the last increase, and are there any pending special assessments or reserve-fund shortfalls?
- Any open or pending special assessments — roof, HVAC, plumbing, elevator, façade? What's the per-unit balance and payoff schedule, and is the seller paying it off at close or rolling it to the buyer?
- Is there a deadline driving the sale (1031 exchange, divorce, estate, relocation)? That informs how much negotiation room exists.
- Schools are F-rated, which usually means shorter tenancies and higher turnover. Who's the typical renter profile here, and what's been the actual vacancy rate?
- Crime grade is F in this area — have there been break-ins, vandalism, or insurance claims at this property in the last 3 years? What carrier currently insures it and at what premium?
- The area grade is low — what's the realistic commute time and amenity access for the typical tenant pool here? Any planned neighborhood developments (good or bad) we should know about?
- What's the average days-on-market for RENTAL listings here right now (not sales)? A rising rental-DOM trend means longer vacancies and softer asking-rent achievability than the comps imply.
- What's the recent tenant-quality profile in this submarket — average credit score on applications, eviction rate, late-payment / NSF rate, and stable-employment percentage? A property-management company in the area should have these aggregated.
- How much new apartment / multifamily construction is in the pipeline within 1–3 miles? Heavy new supply (>2% of stock underway) typically softens rents 12–24 months out; light construction supports rent growth.
Investment metrics
- 1% rule
- 1.10% ✓
- Cap rate
- 5.81%
- Cash-on-cash
- -1.74%
- DSCR
- 0.92
- GRM
- 7.5
CMA / ARV
No comps found within radius.
Projected returns pro-forma
-3.0% appreciation · 3.0% rent growth · sell at horizon
- IRR
- -19.0%
- Equity multiple
- 0.33×
- Total profit
- $-34,484
- Equity at exit
- $27,584
- IRR
- -11.2%
- Equity multiple
- 0.32×
- Total profit
- $-35,042
- Equity at exit
- $15,995
Cash invested: $51,800 (down + closing). Projections, not guarantees.
Landlord ↔ Tenant lean methodology
- Overall (STATE)
- 62 Landlord-Friendly
- State Michigan
- 62 Landlord-Friendly · EVEN
- County
- — inherits STATE
- City
- — inherits STATE
ZIP-level market 48302
- Active inventory
- 138
- Price-to-rent
- 7.5×
Monthly cashflow live
- Estimated rent
- $2,044 high interval (Pro) →
- Mortgage (P&I)
- −$970
- Tax from tax record
- −$258 /mo · $3,090/yr
- Insurance
- −$77
- HOA
- −$385
- Vacancy / Maint / Mgmt
- −$429
- Net cashflow
- $-75
Break-even live
UW: 25.0% down · 7.5% · 30yr · 1.5% tax · 5.0% vac · 8.0% maint · 8.0% mgmt
Financing live
Cash to close
- Down payment
- $46,250
- Closing costs
- $5,550
- Reserves months
- —
- Total cash needed
- —
Loan-product check · same deal, 3 products live
Conventional
25% down · 7.5% · 30yr
- Down + closing
- —
- Monthly P&I
- —
- Monthly cashflow
- —
- DSCR
- —
- Eligible?
- —
Personal DTI + credit; lowest rate.
DSCR
20% down · 8.5% · 30yr
- Down + closing
- —
- Monthly P&I
- —
- Monthly cashflow
- —
- DSCR
- —
- Eligible?
- —
No personal income docs; deal must DSCR.
Hard money
10% down · 12.0% · 12mo
- Down + closing
- —
- Monthly P&I
- —
- Monthly cashflow
- —
- DSCR
- —
- Eligible?
- —
Short-term bridge; refi at stabilization.
Rent comps 12 comps
| Address | Beds | Baths | Sqft | Rent | $/sqft | DOM | Units | Dist |
|---|---|---|---|---|---|---|---|---|
| 42522 Woodward Ave Bloomfield Twp, MI | 2.0 | 2.0 | 1300 | $3,300 | $2.54 | 1d | 1 | 0.47mi |
| 42160 Woodward Ave Bloomfield Hills, MI | 2.0 | 2.0 | 1689 | $3,500 | $2.07 | 1d | 1 | 0.48mi |
| 444 N Fox Hills Dr #3 Bloomfield Twp, MI | 2.0 | 2.0 | 1089 | $1,598 | $1.47 | 23d | 1 | 0.51mi |
| 444 N Fox Hills Dr #7 Bloomfield Twp, MI | 2.0 | 2.0 | 1089 | $1,550 | $1.42 | 23d | 1 | 0.51mi |
| 433 Fox Hills Dr S #5 Bloomfield Hills, MI | 2.0 | 2.0 | 1089 | $1,700 | $1.56 | 12d | 1 | 0.55mi |
| 100 W Hickory Grove Rd Bloomfield Hills, MI | 2.0 | 1.0–2.0 | 1032 | $1,625 | $1.57 | 24d | 3 | 0.64mi |
| 100 W Hickory Grove Rd Bloomfield Hills, MI | 2.0 | 1.5–2.0 | 1032 | $1,700 | $1.65 | 12d | 2 | 0.64mi |
| E Fox Hills Dr Bloomfield Twp, MI | 2.0 | 2.0 | 1055 | $1,300 | $1.23 | 16d | 1 | 0.71mi |
| 124 Alice Ave Bloomfield Township, MI | 3.0 | 1.0 | 1440 | $2,000 | $1.39 | 4d | 1 | 0.88mi |
| 489 Central Ave Pontiac, MI | 2.0 | 1.0 | 1140 | $1,195 | $1.05 | 4d | 1 | 1.29mi |
| 442 Central Ave Pontiac, MI | 2.0 | 1.0 | 1500 | $1,250 | $0.83 | 16d | 1 | 1.32mi |
| 442 Central Ave Unit 1 Pontiac, MI | 2.0 | 1.0 | 1500 | $1,500 | $1.00 | 4d | 1 | 1.32mi |
HOA detail condo
- Monthly dues
- $385 · $4,620/yr
- Likely covers
- pool
- Assessments
- None detected in remarks — confirm with the listing agent.
Listing history 9 events
-
2026-06-13statusdays on market $185,000 Pending 7 DOM
-
2026-06-09days on market $185,000 Active Under Contract 5 DOM
-
2026-06-08statusdays on market $185,000 Active Under Contract 4 DOM
-
2026-06-07statusdays on market $185,000 Active 3 DOM
-
2026-06-04days on market $185,000 Coming Soon 6 DOM
-
2026-06-03days on market $185,000 Coming Soon 5 DOM
-
2026-06-02days on market $185,000 Coming Soon 4 DOM
-
2026-06-01days on market $185,000 Coming Soon 3 DOM
-
2026-05-31days on market $185,000 Coming Soon 2 DOM
ⓘ Source: listings_history table (triggers on properties + properties_extension) + one-shot
backfill from property_details.listing_events for pre-trigger history.
Tax reassessment forecast MI · Partial reset (capped growth)
- Current annual tax
- $3,090 · $258/mo
- Projected year-2 tax
- $3,090 · $258/mo
- Expected delta
- $0/yr ($0/mo · 0.0%)
ⓘ Screening estimate from a state-policy table — verify with the county assessor before closing.
Climate risk First Street
- Flood 1/10 Low FEMA zone X (unshaded) · 0% chance over 30 yrs
- Wildfire 1/10 Low
- Heat 2/10 Low 7 d/yr ≥98°F today · 15 d/yr by 30 yrs out
- Wind 2/10 Low
- Air quality 3/10 Moderate 2 unhealthy d/yr today · 4 by 30 yrs out
Nearby sold comps map
Loading sold comps map…
Walkable amenities ~0.75 mi
Loading nearby amenities…
Taxation est. · year 1
- Rental income
- $24,525
- − Mortgage interest
- −$10,363
- − Property taxes
- −$3,090
- − Insurance
- −$925
- − Repairs & maintenance
- −$1,962
- − Management
- −$1,962
- − HOA
- −$4,620
- − Depreciation
- −$5,382
- Taxable loss
- −$3,779
- Est. tax savings @ 24.0%
- +$907
- After-tax cash flow
- $5/yr
For passive investors: Depreciation is non-cash, so a rental often shows a tax loss while cash-flowing — sheltering income. Rental losses are passive: they offset passive income freely, and up to $25,000/yr can offset ordinary (W-2) income if you actively participate and your MAGI is under $100k (phasing out to $0 by $150k); unused losses carry forward. On sale, claimed depreciation is recaptured at up to 25%, and gains may owe capital-gains tax (a 1031 exchange can defer both). Figures are a year-1 estimate at your 24.0% rate — not tax advice; consult a CPA.
Schools (NCES district)
- District
- Bloomfield Hills Schools
- NCES district ID
- 2606090
- Math proficiency
- 65% ▼ -2.00%
- Reading proficiency
- 74% ▲ 2.00%
- Median HH income
- $117,848
- Composite
- 65.41/100
- National rank
- #481
- State rank
- #5 of 540 in MI
Livability — Pontiac
- Score
- 64/100
- State rank
- #499
- US rank
- #14703
Category grades
Schools grade is shown separately in the Schools card above.
Census & demographics
- County
- Oakland County · 1,009,092 people
- City population
- 44,593
- Metro
- Detroit-Warren-Dearborn, MI
- Population (ZIP)
- 17,505
- Household income
- $178,103
- Rent vs Own
- Severe rent burden
- 36.0
Population outlook (Oakland County) Hauer SSP2
- Today (2025)
- 1,335,747 people
- By 2030
- 1,375,100 · +2.9%
- By 2040
- 1,435,385 · +7.5%
- By 2050
- 1,469,250 · +10.0%
- By 2075
- 1,531,946 · +14.7%
- By 2100
- 1,450,485 · +8.6%
Race, ethnicity, and origin ACS 2023
- Neighborhood character
- Predominantly White (75%)
- Race & ethnicity
- White 75% Asian 10% Black 8% Two or more races 5% Hispanic / Latino 3%
- Common ancestry
- Romanian 9% Scotch-Irish 3% Lithuanian 2%
- Foreign-born
- 18% · Canada, South Korea, China
- Languages at home
- 76% English-only · Arabic 7% Other Indo-European 3% French/Haitian/Cajun 2%
Political lean MEDSL · Oakland
- 2024 margin
- D (+10.6) · D 54.4% · R 43.8% · Other 1.9%
- 2008→2024 swing
- -3.9pp toward R · 2008: 14.5pp · 2024: 10.6pp
- All cycles
- 2024: D+10.6 2020: D+14.1 2016: D+8.1 2012: D+8.1 2008: D+14.5
Not yet ingested
- Civics
- —
Market trends
- HPI YoY
- ▼ -229.20%
- Current HPI
- 177.6317
- Rent YoY
- —
- Metro
- Detroit-Warren-Dearborn, MI
- State GDP YoY
- ▲ 1.37%
- F500 in state
- 28
Industry mix (Fortune 500 HQ in MI)
| Industry | F500 HQs | Revenue |
|---|---|---|
| Automotive Parts | 3 | $48B |
|
||
| Automotive | 2 | $372B |
|
||
| Chemicals | 1 | $45B |
|
||
| Automotive Retail | 1 | $29B |
|
||
| Healthcare / Medical Devices | 1 | $23B |
|
||
| Automotive Technology | 1 | $20B |
|
||
Price history
+103.3% since first listed12 events — show timeline
- 2026-05-29 Coming Soon $185,000 MiRealSource-MiMLS
- 2017-06-26 Sold (Public Records) $112,000 Public Records
- 2017-06-22 Sold (MLS) $112,000 MiRealSource-MiMLS
- 2017-06-22 Sold (MLS) $112,000 REALCOMP
- 2017-05-19 Pending — MiRealSource-MiMLS
- 2017-05-19 Pending — REALCOMP
- 2017-05-05 Listed $112,000 MiRealSource-MiMLS
- 2017-05-05 Listed $112,000 REALCOMP
- 2004-02-06 Sold (Public Records) $140,000 Public Records
- 2003-12-29 Sold (MLS) $140,000 REALCOMP
- 2003-11-11 Listed $144,900 REALCOMP
- 1998-01-06 Sold (Public Records) $91,000 Public Records
Property tax history
+12.6%/yrLatest (2025): $3,090 · +2.8% YoY. Source: county tax records.
Cash-flow waterfall
monthlySold comps — $/sqft
last 12 mo · ≤1 miLoading sold comps…