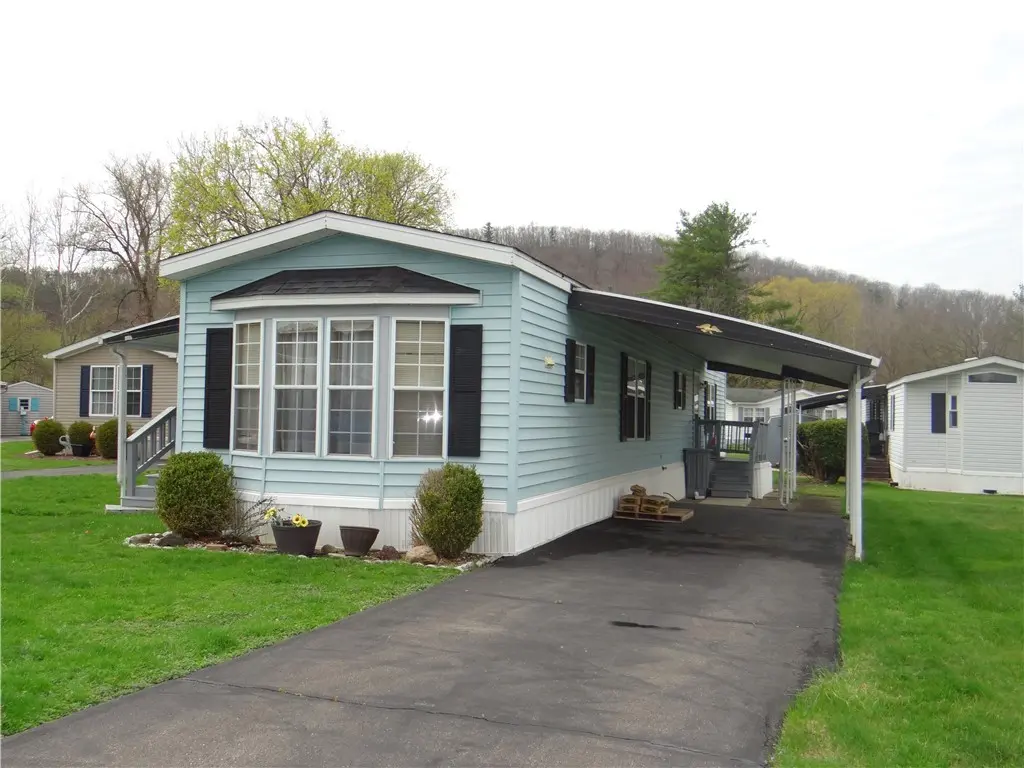
34 Breesport Rd #38 · Horseheads North, NY
Flood risk 6/10 · Moderate
- FEMA flood zone
- AE
- Chance of flooding over 30 yrs
- 0.73%
- Est. flood insurance / yr
- $2,026 – $9,024
Fire risk 3/10 · Minor
- Est. fire insurance / yr
- $691 – $1,283
Heat risk 3/10 · Minor
- Hot days now (above 93°F)
- 7 days/yr
- Hot days in 30 yrs
- 15 days/yr
Wind risk 1/10 · Minimal
- Chance of severe wind over 30 yrs
- 1.0%
Air-quality risk 2/10 · Minimal
- Unhealthy air days now
- 0 days/yr
- Unhealthy air days in 30 yrs
- 1 days/yr
Risk factors via First Street. Map © Google.
Why this score? — see what drove the B grade
The composite is a weighted blend of 9 inputs, each scored 0–100. Each bar is that input's sub-score; the figure is the points it added to the 100-point composite (weight × sub-score).
- Cash flow +30.0/30.0
- 1% rule +10.0/10.0
- DSCR +10.0/10.0
- ARV discount +7.5/15.0
- Schools +4.5/10.0
- Livability +3.2/5.0
- Rent growth +2.5/5.0
- Condition / age +2.5/5.0
- Appreciation +0.0/10.0
$39,900
🖨 Deal sheet 📄 Offer letter ✓ Due diligence
Listing remarks
Nicely maintained 67' x 14' singlewide in 55+ over park with great covered porch. Purchase is subject to Maplehurst Park approval. Lot rent is $600.00/month plush annual taxes of approximately $550.00
Key facts
- Parking
- Built 1992
Neighborhood map
What this means for you Summary
Snapshot
- This is a 2-bed/2.0-bath land listed at $40k.
Deal economics
- At list price, monthly cash flow is $50 ($599/yr) — positive.
- The deal already cash-flows at list — no discount required.
- Meets the 1% rule at list price ($995 rent vs $40k).
Location & tenants
- Location reads 65/100 on livability (#670 in NY) — a middle-class / working-renter tenant base. Strengths: housing A+, crime A-, employment A-; Watch: schools C-, health & safety D, amenities F.
- Horseheads Central School District (suburban): math 44% / reading 58% proficiency, ranked #347 of 590 in NY (top 59%) — acceptable for families but not a draw, mixed tenant base, ~2y average lease.
- Market conditions: 92 active listings in the ZIP; 1 comparable units currently listed for rent nearby; 91 units permitted in Chemung County in 2024 (63 in 5+ unit buildings).
Forward outlook
- Local home prices are declining (-3.0%/yr); year-one equity from $276 of loan paydown is wiped out by about $1k of value loss. Plan a longer hold.
- Chemung County population projected at -17% by 2050 — secular population decline; favor cash flow + early exit over multi-decade hold.
Negotiation context
- Only 0 days on market — expect competitive offers; lowballing is unlikely to land.
- 7 sale attempts since 23y ago with the ask held roughly flat each time — persistent listings suggest the price (not the market) is what's stuck; bring a comps-based counter.
- Current owner paid $18k; list at $40k implies a 122% gain — meaningful room to come down on a strong offer.
Risks & watch-outs
- Watch-outs: flood insurance adds $460/mo.
- Climate carrying-cost: in FEMA flood zone AE (mandatory federal flood insurance) — expect insurance premiums to compound above CPI over the hold.
Questions for the listing agent
- What's the actual annual flood-insurance premium (NFIP or private), and is the property in a SFHA with mandatory coverage?
- Is there a deadline driving the sale (1031 exchange, divorce, estate, relocation)? That informs how much negotiation room exists.
- What's the average days-on-market for RENTAL listings here right now (not sales)? A rising rental-DOM trend means longer vacancies and softer asking-rent achievability than the comps imply.
- What's the recent tenant-quality profile in this submarket — average credit score on applications, eviction rate, late-payment / NSF rate, and stable-employment percentage? A property-management company in the area should have these aggregated.
- How much new for-sale + rental construction is in the pipeline within 1–3 miles? Heavy new supply typically softens prices + rents 12–24 months out; constrained supply supports both.
Investment metrics
- 1% rule
- 2.49% ✓
- Cap rate
- 21.64%
- Cash-on-cash
- 54.81%
- DSCR
- 3.44
- GRM
- 3.3
CMA / ARV
No comps found within radius.
Projected returns pro-forma
-3.0% appreciation · 3.0% rent growth · sell at horizon
- IRR
- -7.2%
- Equity multiple
- 0.73×
- Total profit
- $-2,990
- Equity at exit
- $5,949
- IRR
- 3.2%
- Equity multiple
- 1.24×
- Total profit
- $2,699
- Equity at exit
- $3,450
Cash invested: $11,172 (down + closing). Projections, not guarantees.
Landlord ↔ Tenant lean methodology
- Overall (STATE)
- 15 Strongly Tenant-Friendly
- State New York
- 15 Strongly Tenant-Friendly · D+10
- County
- — inherits STATE
- City
- — inherits STATE
ZIP-level market 14845
- Home prices YoY
- -24.9%
- Active inventory
- 92
- Price-to-rent
- 3.3×
Monthly cashflow live
- Estimated rent
- $995 medium interval (Pro) →
- Mortgage (P&I)
- −$209
- Tax est. 1.5%
- −$50 /mo · $598/yr
- Insurance
- −$17
- Flood insurance flood zone
- −$460 /mo · $5,525/yr
- HOA
- −$0
- Vacancy / Maint / Mgmt
- −$209
- Net cashflow
- $50
Break-even live
UW: 25.0% down · 7.5% · 30yr · 1.5% tax · 5.0% vac · 8.0% maint · 8.0% mgmt
Financing live
Cash to close
- Down payment
- $9,975
- Closing costs
- $1,197
- Reserves months
- —
- Total cash needed
- —
Loan-product check · same deal, 3 products live
Conventional
25% down · 7.5% · 30yr
- Down + closing
- —
- Monthly P&I
- —
- Monthly cashflow
- —
- DSCR
- —
- Eligible?
- —
Personal DTI + credit; lowest rate.
DSCR
20% down · 8.5% · 30yr
- Down + closing
- —
- Monthly P&I
- —
- Monthly cashflow
- —
- DSCR
- —
- Eligible?
- —
No personal income docs; deal must DSCR.
Hard money
10% down · 12.0% · 12mo
- Down + closing
- —
- Monthly P&I
- —
- Monthly cashflow
- —
- DSCR
- —
- Eligible?
- —
Short-term bridge; refi at stabilization.
Rent comps 1 comps
| Address | Beds | Baths | Sqft | Rent | $/sqft | DOM | Units | Dist |
|---|---|---|---|---|---|---|---|---|
| 35 Level Acres Dr Unit B Horseheads, NY | 1.0 | 1.0 | 800 | $995 | $1.24 | 43d | 1 | 0.99mi |
Listing history 18 events
-
2026-04-16historical
-
2026-04-16$39,900
-
2025-10-31historical
-
2025-09-26price $42,995
-
2025-09-07price $45,995
-
2025-09-04price $48,995
-
2025-06-17price $49,900
-
2025-04-28$54,900 Active
-
2021-02-22historical
-
2021-02-19$50,000
-
2007-07-06soldstatus $18,000
-
2007-06-14$18,000
-
2005-06-29soldstatus $17,000
-
2005-04-05$19,500
-
2003-12-03soldstatus $25,000
-
2003-10-31soldstatus $49,500
-
2003-10-28$25,500
-
2003-08-14$52,000
ⓘ Source: listings_history table (triggers on properties + properties_extension) + one-shot
backfill from property_details.listing_events for pre-trigger history.
Climate risk First Street
- Flood 6/10 Major FEMA zone AE · 73% chance over 30 yrs
- Wildfire 3/10 Moderate
- Heat 3/10 Moderate 7 d/yr ≥93°F today · 15 d/yr by 30 yrs out
- Wind 1/10 Low 100% chance of damaging wind over 30 yrs
- Air quality 2/10 Low 0 unhealthy d/yr today · 1 by 30 yrs out
Nearby sold comps map
Loading sold comps map…
Walkable amenities ~0.75 mi
Loading nearby amenities…
Taxation est. · year 1
- Rental income
- $11,940
- − Mortgage interest
- −$2,235
- − Property taxes
- −$598
- − Insurance
- −$5,724
- − Repairs & maintenance
- −$955
- − Management
- −$955
- − Depreciation
- −$1,161
- Taxable income
- $311
- Est. tax owed @ 24.0%
- −$75
- After-tax cash flow
- $524/yr
For passive investors: Depreciation is non-cash, so a rental often shows a tax loss while cash-flowing — sheltering income. Rental losses are passive: they offset passive income freely, and up to $25,000/yr can offset ordinary (W-2) income if you actively participate and your MAGI is under $100k (phasing out to $0 by $150k); unused losses carry forward. On sale, claimed depreciation is recaptured at up to 25%, and gains may owe capital-gains tax (a 1031 exchange can defer both). Figures are a year-1 estimate at your 24.0% rate — not tax advice; consult a CPA.
Schools (NCES district)
- District
- Horseheads Central School District
- NCES district ID
- 3614850
- Math proficiency
- 44% ▼ -19.00%
- Reading proficiency
- 58% ▲ 3.00%
- Median HH income
- $60,594
- Composite
- 44.58/100
- National rank
- #2781
- State rank
- #347 of 590 in NY
Livability — Horseheads North
- Score
- 65/100
- State rank
- #670
- US rank
- #12555
Category grades
Schools grade is shown separately in the Schools card above.
Census & demographics
- Census place
- Horseheads North, NY
- Population (ZIP)
- 20,552
Population outlook (Chemung County) Hauer SSP2
- Today (2025)
- 82,931 people
- By 2030
- 80,356 · -3.1%
- By 2040
- 74,745 · -9.9%
- By 2050
- 69,012 · -16.8%
- By 2075
- 55,689 · -32.8%
- By 2100
- 41,428 · -50.0%
Race, ethnicity, and origin ACS 2023
- Neighborhood character
- Predominantly White (90%)
- Race & ethnicity
- White 90% Two or more races 5% Asian 2% Hispanic / Latino 2% Black 2%
- Common ancestry
- Romanian 6% Slovak 2% Iranian 2%
- Foreign-born
- 6% · Canada, China, South Korea
- Languages at home
- 94% English-only · Spanish 2% Other Asian/Pacific 1% Other Indo-European 1%
Political lean MEDSL · Chemung
- 2024 margin
- R (+16.8) · D 41.6% · R 58.4%
- 2008→2024 swing
- -15.6pp toward R · 2008: -1.2pp · 2024: -16.8pp
- All cycles
- 2024: R+16.8 2020: R+13.4 2016: R+20.0 2012: R+2.9 2008: R+1.2
Not yet ingested
- Civics
- —
Market trends
- HPI YoY
- ▼ -82.23%
- Current HPI
- 247.777
- Rent YoY
- —
- Metro
- —
- State GDP YoY
- ▲ 2.60%
- F500 in state
- 92
Industry mix (Fortune 500 HQ in NY)
| Industry | F500 HQs | Revenue |
|---|---|---|
| Financial Services | 10 | $950B |
|
||
| Consumer Goods | 9 | $162B |
|
||
| Insurance | 4 | $225B |
|
||
| Telecommunications | 2 | $144B |
|
||
| Pharmaceuticals | 2 | $112B |
|
||
| Media / Entertainment | 2 | $69B |
|
||
Price history
-23.3% since first listed18 events — show timeline
- 2026-04-16 Listed $39,900 UNYREIS
- 2026-04-16 Listing Removed — UNYREIS
- 2025-10-31 Listing Removed — UNYREIS
- 2025-09-26 Price Changed $42,995 UNYREIS
- 2025-09-07 Price Changed $45,995 UNYREIS
- 2025-09-04 Price Changed $48,995 UNYREIS
- 2025-06-17 Price Changed $49,900 UNYREIS
- 2025-04-28 Listed $54,900 UNYREIS
- 2021-02-22 Listing Removed — UNYREIS
- 2021-02-19 Listed $50,000 UNYREIS
- 2007-07-06 Sold (MLS) $18,000 UNYREIS
- 2007-06-14 Listed $18,000 UNYREIS
- 2005-06-29 Sold (MLS) $17,000 UNYREIS
- 2005-04-05 Listed $19,500 UNYREIS
- 2003-12-03 Sold (MLS) $25,000 UNYREIS
- 2003-10-31 Sold (MLS) $49,500 UNYREIS
- 2003-10-28 Listed $25,500 UNYREIS
- 2003-08-14 Listed $52,000 UNYREIS
Property tax history
+17.3%/yrLatest (2025): $90,383 · +10.7% YoY. Source: county tax records.
Cash-flow waterfall
monthlySold comps — $/sqft
last 12 mo · ≤1 miLoading sold comps…