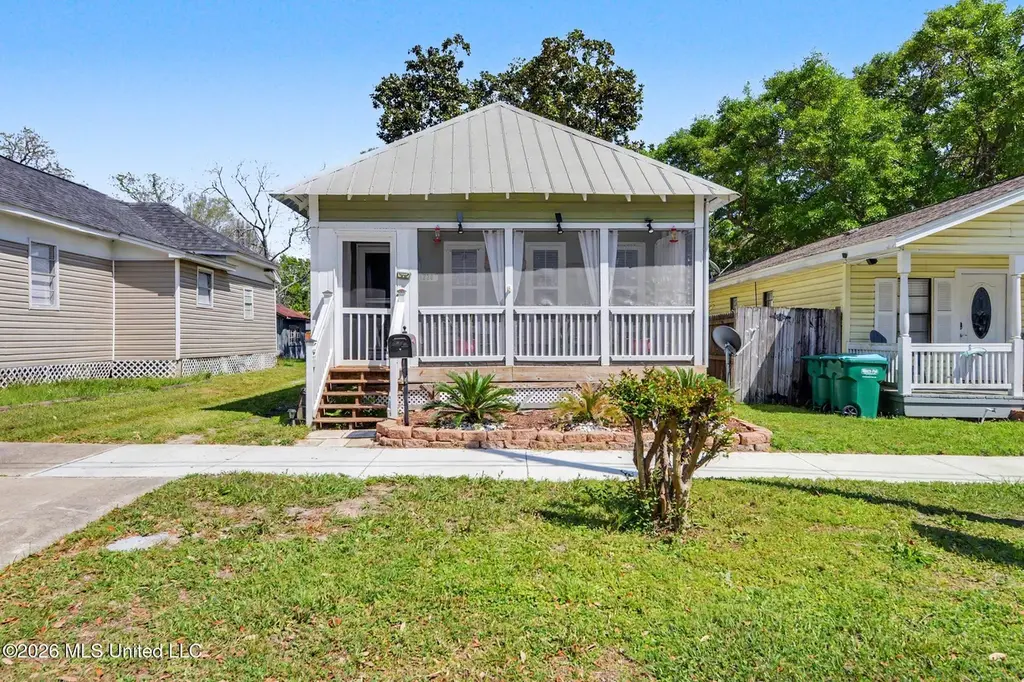
1220 33rd Ave · Gulfport, MS
Flood risk 6/10 · Moderate
- FEMA flood zone
- X (shaded)
- Chance of flooding over 30 yrs
- 0.72%
- Est. flood insurance / yr
- $507 – $1,088
Fire risk 1/10 · Minimal
- Est. fire insurance / yr
- $1,241 – $2,305
Heat risk 10/10 · Severe
- Hot days now (above 106°F)
- 7 days/yr
- Hot days in 30 yrs
- 24 days/yr
Wind risk 9/10 · Severe
- Chance of severe wind over 30 yrs
- 99.0%
Air-quality risk 1/10 · Minimal
- Unhealthy air days now
- 0 days/yr
- Unhealthy air days in 30 yrs
- 0 days/yr
Risk factors via First Street. Map © Google.
Why this score? — see what drove the F grade
The composite is a weighted blend of 9 inputs, each scored 0–100. Each bar is that input's sub-score; the figure is the points it added to the 100-point composite (weight × sub-score).
- Cash flow +11.8/30.0
- Rent growth +5.0/5.0
- Livability +3.7/5.0
- DSCR +3.5/10.0
- Schools +3.4/10.0
- 1% rule +2.7/10.0
- Condition / age +2.5/5.0
- ARV discount +0.0/15.0
- Appreciation +0.0/10.0
$150,000
🖨 Deal sheet 📄 Offer letter ✓ Due diligence
Listing remarks MLS
ADORABLE COTTAGE WALKING DISTANCE TO THE BEACH, CASINO AND DOWNTOWN GULFPORT. THIS 1 BEDROOM,1.5 BATH HAS SO MANY SPECIAL FEATURES. HIGH CEILINGS, UPDATED KITCHEN, BATHROOMS AND PORCHES. GREAT VACATION HOME! SEE INFORMATION SHEET WITH LISTING.
Key facts
- Spacious back deck
- Storage shed
- Prime location
Tags
Property features AI
Finance
- HOA & community: Community offers boating, hiking/walking trails, nearby restaurants and entertainment, and street lights
Exterior
- Parking: Driveway; On-street parking; Gravel parking
- Security: Smoke detectors
- Utilities: Public water; Public sewer; Electricity connected; Water connected; Sewer connected
- Home design: Single-family house; One story; Move-in ready
- Construction: Siding exterior; Architectural shingle roof; Chainwall and pillar/post/pier foundation; Built (year from public records)
- Exterior features: Deck; Porch; Screened porch; Shed(s); Near beach with beach access; Other exterior features
Interior
- Kitchen: Dishwasher; Microwave; Oven; Refrigerator
- Flooring: Ceramic tile; Laminate; Wood
- Bathrooms: 1 full bathroom; 1 half bathroom (1.5 total)
- Heating & cooling: Central heating (electric); Central air conditioning (electric)
- Interior features: Ceiling fans; High ceilings; Stone counters; Window treatments
- Laundry & utility: Washer and dryer (included); Dedicated laundry room
Neighborhood map
What this means for you Summary
Snapshot
- This is a 1-bed/1.0-bath single-family listed at $150k.
Deal economics
- At list price, monthly cash flow is $-42 ($-507/yr) — negative.
- To cash-flow at today's rent, offer at most $143k (5.0% below list).
- To meet the 1% rule (rent ≥ 1% of price), the offer needs to be $115k (23.2% below list).
- Recommended offer: $115k (23.2% below list) — sets the bar for 1% rule.
- Cap rate 6.0% vs local median 4.9% in Gulfport — meaningfully above typical; check what's discounted (condition, days-on-market, listing class) to confirm the premium yield is real.
Location & tenants
- Location reads 73/100 on livability (#15 in MS) — a middle-class / working-renter tenant base. Strengths: cost of living A+, housing A+, health & safety A+; Watch: amenities F, commute F, employment F.
- Gulfport School District (urban): math 41% / reading 42% proficiency, ranked #37 of 130 in MS (top 28%) — families likely to look elsewhere, expect single-tenant / working-renter base with shorter leases; 67% free/reduced lunch — lower-income household profile, screen leases tightly.
- Zoned schools: Central Elem (math 19% / reading 31%, grade F, #217 of 375 statewide, top 58%, 480 students, 100% FRL); Gulfport High School (math 42% / reading 36%, grade F, #54 of 197 statewide, top 28%, 1,728 students, 100% FRL) — zoned schools average 100% FRL vs 67% district-wide (33 pts higher); higher-poverty schools than district average — tighter screening recommended.
- Market conditions: Rents rising fast (+10.5%/yr); 252 active listings in the ZIP; 12 comparable units currently listed for rent nearby; rentals lingering (median 44d on market — plan ~5-8 weeks vacancy on turnover, expect pricing pressure); 67% of comp listings sitting > 30 days — soft ceiling on asking rent; lower-income renter base — watch delinquency; 2,194 units permitted in Harrison County in 2024 (0 in 5+ unit buildings).
- This rent runs 40% of the median local income ($35k/yr) — at the standard rent-burdened threshold; future hikes will face affordability resistance.
Forward outlook
- Local home prices are declining (-3.0%/yr); year-one equity from $1k of loan paydown is wiped out by about $4k of value loss. Plan a longer hold.
- Harrison County population projected at +27% by 2050 — long-run rental-demand tailwind backs the buy-and-hold thesis.
Negotiation context
- It's been on market 19 days — a 2% lower offer ($148k) is reasonable based on typical stale-listing flexibility.
- 4 sale attempts since 18y ago with the ask held roughly flat each time — persistent listings suggest the price (not the market) is what's stuck; bring a comps-based counter.
- Current owner paid $98k; list at $150k implies a 54% gain — meaningful room to come down on a strong offer.
Risks & watch-outs
- Watch-outs: built in 1900 — expect roof / HVAC / electrical / plumbing capex.
- Climate carrying-cost: major flood risk; severe wind risk, 99% chance of damaging wind over 30y; extreme-heat days projected 7→24/yr by 2055 (HVAC capex compounding) — expect insurance premiums to compound above CPI over the hold.
Questions for the listing agent
- What do current leases actually rent for vs. the listed asking? Can we see a recent rent roll and the last 12 months of T-12 income?
- Built in 1900 — when were the roof, HVAC, electrical panel, plumbing, and water heater last replaced?
- Is there a deadline driving the sale (1031 exchange, divorce, estate, relocation)? That informs how much negotiation room exists.
- Schools are D-rated, which usually means shorter tenancies and higher turnover. Who's the typical renter profile here, and what's been the actual vacancy rate?
- The area grade is low — what's the realistic commute time and amenity access for the typical tenant pool here? Any planned neighborhood developments (good or bad) we should know about?
- What's the average days-on-market for RENTAL listings here right now (not sales)? A rising rental-DOM trend means longer vacancies and softer asking-rent achievability than the comps imply.
- What's the recent tenant-quality profile in this submarket — average credit score on applications, eviction rate, late-payment / NSF rate, and stable-employment percentage? A property-management company in the area should have these aggregated.
- How much new for-sale + rental construction is in the pipeline within 1–3 miles? Heavy new supply typically softens prices + rents 12–24 months out; constrained supply supports both.
Investment metrics
- 1% rule
- 0.77% ✗
- Cap rate
- 5.95%
- Cash-on-cash
- -1.21%
- DSCR
- 0.95
- GRM
- 10.8
CMA / ARV
- ARV (on-the-fly)
- $107,800
- Comps found
- 12
Show comp detail 12 sales within ~0.75 mi
| Address | Dist | Beds/Ba | Sqft | Sold | Price | $/sf | Match |
|---|---|---|---|---|---|---|---|
| 1220 33rd Ave | 0.00mi | 1/1.5 | 1,000 (+2%) | 0mo | $150,000 | $150 | 94 |
| 3511 Park Blvd | 0.34mi | 2/1.0 (+1) | 1,006 (+3%) | 2mo | $75,000 | $75 | 73 |
| 3406 14th St | 0.17mi | 2/1.0 (+1) | 952 (-3%) | 16mo | $129,000 | $136 | 69 |
| 3310 11th St | 0.12mi | 2/1.0 (+1) | 946 (-4%) | 22mo | $149,900 | $158 | 65 |
| 1302 36th Ave | 0.23mi | 2/1.0 (+1) | 1,008 (+3%) | 21mo | $85,000 | $84 | 62 |
| 3604 Park Blvd | 0.39mi | 2/1.0 (+1) | 900 (-8%) | 3mo | $74,000 | $82 | 61 |
| 1426 33rd Ave | 0.15mi | 2/1.0 (+1) | 1,105 (+13%) | 8mo | $225,000 | $204 | 60 |
| 3307 20th St | 0.53mi | 2/1.0 (+1) | 1,052 (+7%) | 1mo | $35,000 | $33 | 58 |
| 911 42nd Ave | 0.66mi | 2/1.0 (+1) | 988 (+1%) | 15mo | $99,900 | $101 | 50 |
| 1523 32nd Ave | 0.23mi | 2/1.0 (+1) | 844 (-14%) | 15mo | $179,500 | $213 | 49 |
| 2412 19th St | 0.72mi | 2/1.0 (+1) | 910 (-7%) | 13mo | $99,900 | $110 | 39 |
| 3900 18th St | 0.62mi | 2/1.0 (+1) | 1,100 (+12%) | 23mo | $39,900 | $36 | 27 |
Match score weights: distance 35% · size 25% · config 20% · recency 20%. Top-matched comps best support the ARV.
Projected returns pro-forma
-3.0% appreciation · 8.0% rent growth · sell at horizon
- IRR
- -13.3%
- Equity multiple
- 0.50×
- Total profit
- $-20,940
- Equity at exit
- $22,365
- IRR
- 1.6%
- Equity multiple
- 1.14×
- Total profit
- $5,887
- Equity at exit
- $12,969
Cash invested: $42,000 (down + closing). Projections, not guarantees.
Landlord ↔ Tenant lean methodology
- Overall (STATE)
- 90 Strongly Landlord-Friendly
- State Mississippi
- 90 Strongly Landlord-Friendly · R+11
- County
- — inherits STATE
- City
- — inherits STATE
ZIP-level market 39501
- Home prices YoY
- -34.5%
- Rents YoY
- 10.5%
- Active inventory
- 252
- Price-to-rent
- 10.8×
Monthly cashflow live
- Estimated rent
- $1,153 high interval (Pro) →
- Mortgage (P&I)
- −$787
- Tax from tax record
- −$104 /mo · $1,245/yr
- Insurance
- −$62
- HOA
- −$0
- Vacancy / Maint / Mgmt
- −$242
- Net cashflow
- $-42
Break-even live
UW: 25.0% down · 7.5% · 30yr · 1.5% tax · 5.0% vac · 8.0% maint · 8.0% mgmt
Financing live
Cash to close
- Down payment
- $37,500
- Closing costs
- $4,500
- Reserves months
- —
- Total cash needed
- —
Loan-product check · same deal, 3 products live
Conventional
25% down · 7.5% · 30yr
- Down + closing
- —
- Monthly P&I
- —
- Monthly cashflow
- —
- DSCR
- —
- Eligible?
- —
Personal DTI + credit; lowest rate.
DSCR
20% down · 8.5% · 30yr
- Down + closing
- —
- Monthly P&I
- —
- Monthly cashflow
- —
- DSCR
- —
- Eligible?
- —
No personal income docs; deal must DSCR.
Hard money
10% down · 12.0% · 12mo
- Down + closing
- —
- Monthly P&I
- —
- Monthly cashflow
- —
- DSCR
- —
- Eligible?
- —
Short-term bridge; refi at stabilization.
Rent comps 12 comps
| Address | Beds | Baths | Sqft | Rent | $/sqft | DOM | Units | Dist |
|---|---|---|---|---|---|---|---|---|
| 3305 12th St Gulfport, MS | 2.0 | 1.5 | 1100 | $1,295 | $1.18 | 43d | 1 | 0.10mi |
| 1513 34th Ave Gulfport, MS | 2.0 | 2.0 | 884 | $1,250 | $1.41 | 43d | 1 | 0.21mi |
| 3633 Southward Dr Gulfport, MS | 2.0 | 2.0 | 900 | $1,000 | $1.11 | 43d | 1 | 0.37mi |
| 2068 W Beach Blvd Biloxi, MS | 1.0–3.0 | 1.0–2.0 | 998 | $1,100 | $1.10 | 13d | 1 | 0.46mi |
| 3502 20th St Gulfport, MS | 2.0 | 1.0 | 621 | $995 | $1.60 | 20d | 1 | 0.57mi |
| 1228 43rd Ave Gulfport, MS | 1.0 | 1.0 | 550 | $895 | $1.63 | 13d | 1 | 0.66mi |
| 2414 34th Ave Gulfport, MS | 2.0 | 1.0 | 912 | $1,125 | $1.23 | 20d | 1 | 0.88mi |
| 2125 22nd Ave Unit A & B A Gulfport, MS | 1.0 | 1.0 | 795 | $800 | $1.01 | 43d | 1 | 0.94mi |
| 4409 Ford St Gulfport, MS | 2.0 | 1.0 | 1000 | $1,500 | $1.50 | 43d | 1 | 0.98mi |
| 1822 15th St Gulfport, MS | 2.0 | 2.0 | 1100 | $1,900 | $1.73 | 43d | 1 | 0.99mi |
| 2227 17th Ave Gulfport, MS | 2.0 | 1.0 | 1000 | $850 | $0.85 | 43d | 1 | 1.32mi |
| 1527 2nd St Gulfport, MS | 2.0 | 1.5 | 600 | $1,600 | $2.67 | 43d | 1 | 1.33mi |
Listing history 12 events
-
2026-04-17status Pending
-
2026-04-01status Active
-
2026-03-31historical
-
2026-03-28$150,000 Active
-
2022-06-27soldstatus
-
2017-10-26soldstatus $97,500
-
2017-10-23soldstatus 243-char remark
Show marketing remark (243 chars)
ADORABLE COTTAGE WALKING DISTANCE TO THE BEACH, CASINO AND DOWNTOWN GULFPORT. THIS 1 BEDROOM,1.5 BATH HAS SO MANY SPECIAL FEATURES. HIGH CEILINGS, UPDATED KITCHEN, BATHROOMS AND PORCHES. GREAT VACATION HOME! SEE INFORMATION SHEET WITH LISTING.
-
2017-02-21$104,900 243-char remark
Show marketing remark (243 chars)
ADORABLE COTTAGE WALKING DISTANCE TO THE BEACH, CASINO AND DOWNTOWN GULFPORT. THIS 1 BEDROOM,1.5 BATH HAS SO MANY SPECIAL FEATURES. HIGH CEILINGS, UPDATED KITCHEN, BATHROOMS AND PORCHES. GREAT VACATION HOME! SEE INFORMATION SHEET WITH LISTING.
-
2009-03-27soldstatus
-
2009-03-26soldstatus 299-char remark
Show marketing remark (299 chars)
DO YOU LOVE THE CHARM OF AN OLD HOME? This Small home has great possibilities! Walk to Beach or Island View Casino. Short distance to Seabee Base. This property needs work, but the price is right for the aspiring''remodeler''.(Bring offer!) Beautiful Magnolia tree in back yard. Call for info today-
-
2008-11-07$42,500 299-char remark
Show marketing remark (299 chars)
DO YOU LOVE THE CHARM OF AN OLD HOME? This Small home has great possibilities! Walk to Beach or Island View Casino. Short distance to Seabee Base. This property needs work, but the price is right for the aspiring''remodeler''.(Bring offer!) Beautiful Magnolia tree in back yard. Call for info today-
-
2008-06-06soldstatus
ⓘ Source: listings_history table (triggers on properties + properties_extension) + one-shot
backfill from property_details.listing_events for pre-trigger history.
Tax reassessment forecast MS · Resets to sale price
- Current annual tax
- $1,245 · $104/mo
- Projected year-2 tax
- $1,245 · $104/mo
- Expected delta
- $0/yr ($0/mo · 0.0%)
ⓘ Screening estimate from a state-policy table — verify with the county assessor before closing.
Climate risk First Street
- Flood 6/10 Major FEMA zone X (shaded) · 72% chance over 30 yrs
- Wildfire 1/10 Low
- Heat 10/10 Extreme 7 d/yr ≥106°F today · 24 d/yr by 30 yrs out
- Wind 9/10 Extreme 99% chance of damaging wind over 30 yrs
- Air quality 1/10 Low 0 unhealthy d/yr today · 0 by 30 yrs out
Nearby sold comps map
Loading sold comps map…
Walkable amenities ~0.75 mi
Loading nearby amenities…
Taxation est. · year 1
- Rental income
- $13,832
- − Mortgage interest
- −$8,402
- − Property taxes
- −$1,245
- − Insurance
- −$750
- − Repairs & maintenance
- −$1,107
- − Management
- −$1,107
- − Depreciation
- −$4,364
- Taxable loss
- −$3,142
- Est. tax savings @ 24.0%
- +$754
- After-tax cash flow
- $247/yr
For passive investors: Depreciation is non-cash, so a rental often shows a tax loss while cash-flowing — sheltering income. Rental losses are passive: they offset passive income freely, and up to $25,000/yr can offset ordinary (W-2) income if you actively participate and your MAGI is under $100k (phasing out to $0 by $150k); unused losses carry forward. On sale, claimed depreciation is recaptured at up to 25%, and gains may owe capital-gains tax (a 1031 exchange can defer both). Figures are a year-1 estimate at your 24.0% rate — not tax advice; consult a CPA.
Schools (NCES district)
- District
- Gulfport School District
- NCES district ID
- 2801710
- Math proficiency
- 41% ▼ -15.00%
- Reading proficiency
- 42% ▼ -6.00%
- Median HH income
- $35,712
- Composite
- 34.38/100
- National rank
- #5213
- State rank
- #37 of 130 in MS
Livability — Gulfport
- Score
- 73/100
- State rank
- #15
- US rank
- #5010
Category grades
Schools grade is shown separately in the Schools card above.
Census & demographics
- Census place
- Gulfport, MS
- County
- Harrison County · 178,171 people
- City population
- 96,188
- Metro
- Gulfport-Biloxi, MS
- Population (ZIP)
- 22,565
- Household income
- $34,758
- Rent vs Own
- Severe rent burden
- 1516.0
Population outlook (Harrison County) Hauer SSP2
- Today (2025)
- 228,444 people
- By 2030
- 241,942 · +5.9%
- By 2040
- 267,531 · +17.1%
- By 2050
- 291,062 · +27.4%
- By 2075
- 346,711 · +51.8%
- By 2100
- 378,165 · +65.5%
Race, ethnicity, and origin ACS 2023
- Neighborhood character
- Diverse neighborhood (Simpson 0.56)
- Race & ethnicity
- Black 59% White 29% Two or more races 7% Hispanic / Latino 5%
- Hispanic origin (detail)
- Mexican 2%
- Common ancestry
- Lithuanian 2% Serbian 1% Slovak 1%
- Foreign-born
- 2% · Canada
- Languages at home
- 95% English-only · Spanish 4%
Political lean MEDSL · Harrison
- 2024 margin
- Strong R (+28.9) · D 35.0% · R 63.9% · Other 1.1%
- 2008→2024 swing
- -2.9pp toward R · 2008: -26.0pp · 2024: -28.9pp
- All cycles
- 2024: R+28.9 2020: R+25.2 2016: R+30.7 2012: R+26.6 2008: R+26.0
Not yet ingested
- Civics
- —
Market trends
- HPI YoY
- ▼ -110.16%
- Current HPI
- 208.998
- Rent YoY
- ▲ 10.49%
- Metro
- Gulfport-Biloxi, MS
- State GDP YoY
- —
- F500 in state
- 0
Price history
+252.9% since first listed12 events — show timeline
- 2026-04-17 Pending — MLSU
- 2026-04-01 Relisted — MLSU
- 2026-03-31 Listing Removed — MLSU
- 2026-03-28 Listed $150,000 MLSU
- 2022-06-27 Sold (Public Records) — Public Records
- 2017-10-26 Sold (Public Records) $97,500 Public Records
- 2017-10-23 Sold (MLS) — MLSU
- 2017-02-21 Listed $104,900 MLSU
- 2009-03-27 Sold (Public Records) — Public Records
- 2009-03-26 Sold (MLS) — MLSU
- 2008-11-07 Listed $42,500 MLSU
- 2008-06-06 Sold (Public Records) — Public Records
Property tax history
+2.1%/yrLatest (2017): $1,245 · +0.0% YoY. Source: county tax records.
Cash-flow waterfall
monthlySold comps — $/sqft
last 12 mo · ≤1 miLoading sold comps…