22 Concourse Dr · Ridgeland, SC
Flood risk 1/10 · Minimal
- FEMA flood zone
- X (unshaded)
- Chance of flooding over 30 yrs
- 0.0%
- Est. flood insurance / yr
- $507 – $1,088
Fire risk 7/10 · Major
- Est. fire insurance / yr
- $783 – $1,453
Heat risk 9/10 · Severe
- Hot days now (above 109°F)
- 7 days/yr
- Hot days in 30 yrs
- 17 days/yr
Wind risk 8/10 · Major
- Chance of severe wind over 30 yrs
- 96.0%
Air-quality risk 2/10 · Minimal
- Unhealthy air days now
- 2 days/yr
- Unhealthy air days in 30 yrs
- 2 days/yr
Risk factors via First Street. Map © Google.
Why this score? — see what drove the D grade
The composite is a weighted blend of 9 inputs, each scored 0–100. Each bar is that input's sub-score; the figure is the points it added to the 100-point composite (weight × sub-score).
- Appreciation +10.0/10.0
- ARV discount +9.1/15.0
- Cash flow +7.4/30.0
- Livability +3.4/5.0
- Rent growth +2.5/5.0
- Condition / age +2.5/5.0
- 1% rule +2.4/10.0
- DSCR +1.5/10.0
- Schools +1.4/10.0
$342,900
🖨 Deal sheet 📄 Offer letter ✓ Due diligence
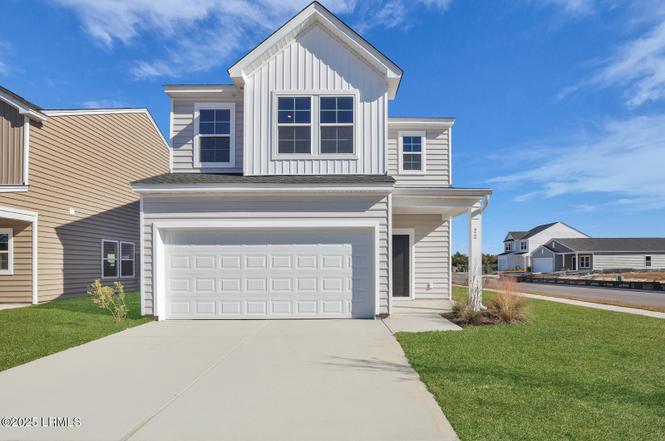
Listing remarks
This two-story home includes four bedrooms and two-and-one-half bathrooms, each with a walk-in closet. The first floor features a large family room with a home office. It also contains the kitchen, dining area, and two-car garage. Upstairs, a free space leads into the spare bedrooms and second bathroom, with the primary bedroom and laundry room down the hall.
Key facts
- 5,401 sq ft lot
- 2 garage spots
- Built 2025
Property features AI
Finance
- HOA & community: HOA fee $750 annually; Community playground; Walking trail
Exterior
- Parking: No attached garage
- Security: Smoke detector(s)
- Utilities: Public sewer
- Home design: Single-family property
- Construction: Vinyl siding; Composition roof; Slab foundation; Built area about 1,973 (building area total)
- Exterior features: Residential zoning; Lot approximately 0.12 acres (about 5,401 sq ft)
Interior
- Kitchen: Dishwasher; Disposal; Microwave; Garage door opener (automatic)
- Flooring: Vinyl
- Bathrooms: 2 full bathrooms; 1 half bathroom
- Heating & cooling: Electric central heating; Central air conditioning
- Interior features: Vinyl flooring; Smoke detector(s)
Neighborhood map
What this means for you Summary
Snapshot
- This is a 4-bed/2.5-bath single-family listed at $343k.
Deal economics
- At list price, monthly cash flow is $-441 ($-5k/yr) — negative.
- To cash-flow at today's rent, offer at most $279k (18.6% below list).
- To meet the 1% rule (rent ≥ 1% of price), the offer needs to be $252k (26.5% below list).
- Recommended offer: $252k (26.5% below list) — sets the bar for 1% rule.
Location & tenants
- Location reads 68/100 on livability (#81 in SC) — a middle-class / working-renter tenant base. Strengths: cost of living A+, health & safety A+, housing B+; Watch: schools F, crime D-, amenities F.
- Jasper 01 (rural): math 12% / reading 22% proficiency, ranked #77 of 80 in SC (top 96%) — low school quality limits family demand, transient renter base, plan for 1-2y turnover; 78% free/reduced lunch — lower-income household profile, screen leases tightly.
- Market conditions: 358 active listings in the ZIP; 1,385 units permitted in Jasper County in 2024 (0 in 5+ unit buildings).
- At $2,521/mo this rent would consume 62% of the median local household income ($49k/yr) (locally 395% of renters already pay >50% of income on rent) — very limited rent-growth headroom before tenants either downsize or default.
Forward outlook
- In year one you build about $37k of equity ($2k loan paydown + $34k appreciation (10.0% local appreciation)).
- Jasper County population projected at +46% by 2050 — long-run rental-demand tailwind backs the buy-and-hold thesis.
- By year 2, paydown + projected appreciation supports a ~$59k cash-out refi (75% LTV) — recoverable capital for the next deal without selling this one.
Negotiation context
- It's been on market 294 days — a 12% lower offer ($302k) is reasonable based on typical stale-listing flexibility.
Risks & watch-outs
- Climate carrying-cost: severe wind risk, 96% chance of damaging wind over 30y; major wildfire risk; extreme-heat days projected 7→17/yr by 2055 (HVAC capex compounding) — expect insurance premiums to compound above CPI over the hold.
Questions for the listing agent
- What do current leases actually rent for vs. the listed asking? Can we see a recent rent roll and the last 12 months of T-12 income?
- It's been on market 294 days. Have you received any prior offers? Is the seller open to a 26% concession, seller financing, or rate buy-down credit?
- What does the HOA fee cover, when was the last increase, and are there any pending special assessments or reserve-fund shortfalls?
- Why hasn't it sold? Are there any deal-killer items the seller is aware of (foundation, flood, title, zoning, code violations)?
- Is there a deadline driving the sale (1031 exchange, divorce, estate, relocation)? That informs how much negotiation room exists.
- Schools are F-rated, which usually means shorter tenancies and higher turnover. Who's the typical renter profile here, and what's been the actual vacancy rate?
- Crime grade is D in this area — have there been break-ins, vandalism, or insurance claims at this property in the last 3 years? What carrier currently insures it and at what premium?
- The area grade is low — what's the realistic commute time and amenity access for the typical tenant pool here? Any planned neighborhood developments (good or bad) we should know about?
- What's the average days-on-market for RENTAL listings here right now (not sales)? A rising rental-DOM trend means longer vacancies and softer asking-rent achievability than the comps imply.
- What's the recent tenant-quality profile in this submarket — average credit score on applications, eviction rate, late-payment / NSF rate, and stable-employment percentage? A property-management company in the area should have these aggregated.
- How much new for-sale + rental construction is in the pipeline within 1–3 miles? Heavy new supply typically softens prices + rents 12–24 months out; constrained supply supports both.
Investment metrics
- 1% rule
- 0.74% ✗
- Cap rate
- 4.75%
- Cash-on-cash
- -5.51%
- DSCR
- 0.75
- GRM
- 11.3
CMA / ARV
- ARV (on-the-fly)
- $355,140
- Comps found
- 5
Show comp detail 5 sales within ~0.75 mi
| Address | Dist | Beds/Ba | Sqft | Sold | Price | $/sf | Match |
|---|---|---|---|---|---|---|---|
| 22 Concourse Dr | 0.00mi | 4/2.5 | 1,973 (0%) | 0mo | $337,700 | $171 | 100 |
| 546 Aviation Dr | 0.02mi | 4/2.5 | 1,806 (-8%) | 0mo | $325,973 | $180 | 85 |
| 90 Concourse Dr | 0.03mi | 4/2.5 | 1,786 (-10%) | 7mo | $346,278 | $194 | 77 |
| 399 Aviation Dr | 0.07mi | 3/2.0 (-1) | 1,797 (-9%) | 5mo | $380,000 | $211 | 71 |
| 462 Aviation Dr | 0.04mi | 5/2.5 (+1) | 2,237 (+13%) | 4mo | $401,190 | $179 | 67 |
Match score weights: distance 35% · size 25% · config 20% · recency 20%. Top-matched comps best support the ARV.
Projected returns pro-forma
10.0% appreciation · 3.0% rent growth · sell at horizon
- IRR
- 20.4%
- Equity multiple
- 2.65×
- Total profit
- $158,753
- Equity at exit
- $308,911
- IRR
- 18.6%
- Equity multiple
- 6.10×
- Total profit
- $489,734
- Equity at exit
- $666,179
Cash invested: $96,012 (down + closing). Projections, not guarantees.
Landlord ↔ Tenant lean methodology
- Overall (STATE)
- 90 Strongly Landlord-Friendly
- State South Carolina
- 90 Strongly Landlord-Friendly · R+6
- County
- — inherits STATE
- City
- — inherits STATE
ZIP-level market 29936
- Home prices YoY
- 33.1%
- Active inventory
- 358
- Price-to-rent
- 11.3×
Monthly cashflow live
- Estimated rent
- $2,521 medium interval (Pro) →
- Mortgage (P&I)
- −$1,798
- Tax est. 1.5%
- −$429 /mo · $5,144/yr
- Insurance
- −$143
- HOA
- −$63
- Vacancy / Maint / Mgmt
- −$529
- Net cashflow
- $-441
Break-even live
UW: 25.0% down · 7.5% · 30yr · 1.5% tax · 5.0% vac · 8.0% maint · 8.0% mgmt
Financing live
Cash to close
- Down payment
- $85,725
- Closing costs
- $10,287
- Reserves months
- —
- Total cash needed
- —
Loan-product check · same deal, 3 products live
Conventional
25% down · 7.5% · 30yr
- Down + closing
- —
- Monthly P&I
- —
- Monthly cashflow
- —
- DSCR
- —
- Eligible?
- —
Personal DTI + credit; lowest rate.
DSCR
20% down · 8.5% · 30yr
- Down + closing
- —
- Monthly P&I
- —
- Monthly cashflow
- —
- DSCR
- —
- Eligible?
- —
No personal income docs; deal must DSCR.
Hard money
10% down · 12.0% · 12mo
- Down + closing
- —
- Monthly P&I
- —
- Monthly cashflow
- —
- DSCR
- —
- Eligible?
- —
Short-term bridge; refi at stabilization.
HOA detail
- Monthly dues
- $63 · $756/yr
Listing history 9 events
-
2026-04-20status Pending
-
2026-02-09price $342,900
-
2026-01-24price $347,900
-
2025-11-21price $354,900
-
2025-11-09price $383,380
-
2025-10-08price $374,900
-
2025-08-09price $375,377
-
2025-07-01price $377,817
-
2025-06-30$375,817 Active
ⓘ Source: listings_history table (triggers on properties + properties_extension) + one-shot
backfill from property_details.listing_events for pre-trigger history.
Climate risk First Street
- Flood 1/10 Low FEMA zone X (unshaded) · 0% chance over 30 yrs
- Wildfire 7/10 Severe
- Heat 9/10 Extreme 7 d/yr ≥109°F today · 17 d/yr by 30 yrs out
- Wind 8/10 Severe 96% chance of damaging wind over 30 yrs
- Air quality 2/10 Low 2 unhealthy d/yr today · 2 by 30 yrs out
Nearby sold comps map
Loading sold comps map…
Walkable amenities ~0.75 mi
Loading nearby amenities…
Taxation est. · year 1
- Rental income
- $30,257
- − Mortgage interest
- −$19,208
- − Property taxes
- −$5,144
- − Insurance
- −$1,714
- − Repairs & maintenance
- −$2,421
- − Management
- −$2,421
- − HOA
- −$756
- − Depreciation
- −$9,975
- Taxable loss
- −$11,381
- Est. tax savings @ 24.0%
- +$2,732
- After-tax cash flow
- $-2,558/yr
For passive investors: Depreciation is non-cash, so a rental often shows a tax loss while cash-flowing — sheltering income. Rental losses are passive: they offset passive income freely, and up to $25,000/yr can offset ordinary (W-2) income if you actively participate and your MAGI is under $100k (phasing out to $0 by $150k); unused losses carry forward. On sale, claimed depreciation is recaptured at up to 25%, and gains may owe capital-gains tax (a 1031 exchange can defer both). Figures are a year-1 estimate at your 24.0% rate — not tax advice; consult a CPA.
Schools (NCES district)
- District
- Jasper 01
- NCES district ID
- 4502520
- Math proficiency
- 12% ▼ -11.00%
- Reading proficiency
- 22% ▼ -5.00%
- Median HH income
- $37,878
- Composite
- 14.23/100
- National rank
- #9450
- State rank
- #77 of 80 in SC
Livability — Ridgeland
- Score
- 68/100
- State rank
- #81
- US rank
- #9324
Category grades
Schools grade is shown separately in the Schools card above.
Census & demographics
- County
- Jasper County · 26,362 people
- City population
- 14,989
- Metro
- Hilton Head Island-Bluffton, SC
- Population (ZIP)
- 14,989
- Household income
- $48,986
- Rent vs Own
- Severe rent burden
- 395.0
Population outlook (Jasper County) Hauer SSP2
- Today (2025)
- 34,428 people
- By 2030
- 37,718 · +9.6%
- By 2040
- 44,061 · +28.0%
- By 2050
- 50,302 · +46.1%
- By 2075
- 66,869 · +94.2%
- By 2100
- 110,455 · +220.8%
Race, ethnicity, and origin ACS 2023
- Neighborhood character
- Diverse neighborhood (Simpson 0.64)
- Race & ethnicity
- Black 44% White 37% Hispanic / Latino 14% Two or more races 7%
- Hispanic origin (detail)
- Mexican 9% Puerto Rican 1%
- Common ancestry
- Serbian 2% Lithuanian 1% Italian 1%
- Foreign-born
- 8% · Canada
- Languages at home
- 86% English-only · Spanish 13%
Political lean MEDSL · Jasper
- 2024 margin
- Lean R (+9.6) · D 44.7% · R 54.3% · Other 1.0%
- 2008→2024 swing
- -32.5pp toward R · 2008: 22.9pp · 2024: -9.6pp
- All cycles
- 2024: R+9.6 2020: D+0.8 2016: D+11.9 2012: D+15.6 2008: D+22.9
Not yet ingested
- Civics
- —
Market trends
- HPI YoY
- ▲ 88.70%
- Current HPI
- 356.5493
- Rent YoY
- —
- Metro
- Hilton Head Island-Bluffton, SC
- State GDP YoY
- ▲ 4.51%
- F500 in state
- 2
Industry mix (Fortune 500 HQ in SC)
| Industry | F500 HQs | Revenue |
|---|---|---|
| Packaging | 1 | $7B |
|
||
Price history
-8.8% since first listed9 events — show timeline
- 2026-04-20 Pending — LRMLS
- 2026-02-09 Price Changed $342,900 LRMLS
- 2026-01-24 Price Changed $347,900 LRMLS
- 2025-11-21 Price Changed $354,900 LRMLS
- 2025-11-09 Price Changed $383,380 LRMLS
- 2025-10-08 Price Changed $374,900 LRMLS
- 2025-08-09 Price Changed $375,377 LRMLS
- 2025-07-01 Price Changed $377,817 LRMLS
- 2025-06-30 Listed $375,817 LRMLS
Cash-flow waterfall
monthlySold comps — $/sqft
last 12 mo · ≤1 miLoading sold comps…