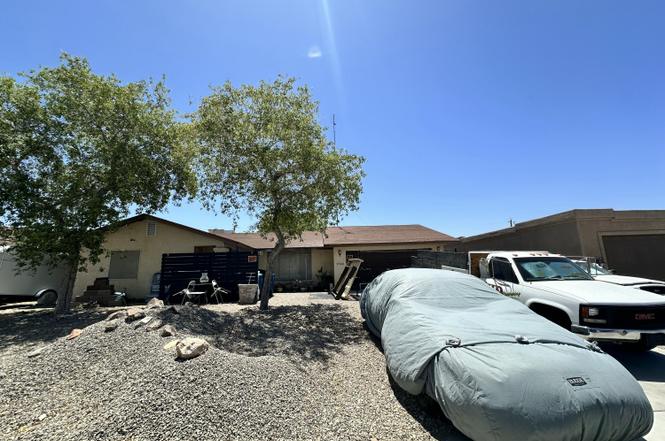
3380 Thunderhead Dr · Lake Havasu City, AZ
Flood risk 1/10 · Minimal
- FEMA flood zone
- X (unshaded)
- Chance of flooding over 30 yrs
- 0.0%
- Est. flood insurance / yr
- $507 – $1,088
Fire risk 3/10 · Minor
- Est. fire insurance / yr
- $610 – $1,132
Heat risk 9/10 · Severe
- Hot days now (above 113°F)
- 7 days/yr
- Hot days in 30 yrs
- 17 days/yr
Wind risk 1/10 · Minimal
- Chance of severe wind over 30 yrs
- —
Air-quality risk 1/10 · Minimal
- Unhealthy air days now
- 0 days/yr
- Unhealthy air days in 30 yrs
- 0 days/yr
Risk factors via First Street. Map © Google.
Why this score? — see what drove the C- grade
The composite is a weighted blend of 9 inputs, each scored 0–100. Each bar is that input's sub-score; the figure is the points it added to the 100-point composite (weight × sub-score).
- Cash flow +17.3/30.0
- ARV discount +15.0/15.0
- DSCR +5.4/10.0
- 1% rule +3.7/10.0
- Schools +3.4/10.0
- Rent growth +3.3/5.0
- Livability +3.2/5.0
- Condition / age +2.5/5.0
- Appreciation +0.0/10.0
$210,000
🖨 Deal sheet 📄 Offer letter ✓ Due diligence
Listing remarks
Opportunity knocks! This fixer can potentially generate a great ROI for a savvy contractor. Great location in a quiet, south side neighborhood near the shopping center at Oro Grande and Hwy 95. Excellent bones, with an open floor plan with vaulted ceiling in Great Room- 2 bedrooms & 2 bathrooms - primary suite and 2nd bedroom with bathroom adjacent in the hallway. Priced to reflect current condition - Sold ''As Is''.
Key facts
- Open floor plan
- Great location
- 0.26 acre lot
Tags
Property features AI
Exterior
- Parking: Attached 2-car garage
- Utilities: Public water; Public sewer; 200+ amp electric service
- Home design: Single family residence; Faces northwest
- Construction: Stucco construction
- Exterior features: Level lot; Has a view; No fencing; Shingle roof; Lot dimensions approximately 76 x 147 x 82 x 147
Interior
- Bathrooms: 1 full bathroom; 1 three-quarter bathroom
- Heating & cooling: Heat pump heating; Central air conditioning
- Interior features: Vaulted ceilings; Electric water heater
- Laundry & utility: Laundry area located in the garage
Neighborhood map
What this means for you Summary
Snapshot
- This is a 2-bed/2.0-bath single-family listed at $210k.
Deal economics
- At list price, monthly cash flow is $155 ($2k/yr) — positive.
- The deal already cash-flows at list — no discount required.
- To meet the 1% rule (rent ≥ 1% of price), the offer needs to be $183k (12.8% below list).
- Recommended offer: $183k (12.8% below list) — sets the bar for 1% rule.
- Cap rate 7.2% vs local median 3.0% in Lake Havasu City — top-decile yield for the area; either an underpriced asset or a hidden risk that comps aren't pricing in. Stress-test before assuming the spread holds.
Location & tenants
- Location reads 63/100 on livability (#124 in AZ) — a middle-class / working-renter tenant base. Strengths: housing A; Watch: health & safety C-, amenities F, commute F.
- Lake Havasu Unified District (4368) (urban): math 39% / reading 41% proficiency, ranked #66 of 249 in AZ (top 26%) — families likely to look elsewhere, expect single-tenant / working-renter base with shorter leases.
- Market conditions: Rents rising (+3.1%/yr); 528 active listings in the ZIP; 30 comparable units currently listed for rent nearby; rentals lingering (median 44d on market — plan ~5-8 weeks vacancy on turnover, expect pricing pressure); 63% of comp listings sitting > 30 days — soft ceiling on asking rent; solid renter incomes; 2,543 units permitted in Mohave County in 2024 (33 in 5+ unit buildings).
Forward outlook
- Local home prices are declining (-3.0%/yr); year-one equity from $1k of loan paydown is wiped out by about $6k of value loss. Plan a longer hold.
- Mohave County population projected to shrink 6% by 2050 — rents likely to lag national; underwrite the cash flow, not the appreciation.
Negotiation context
- Only 1 days on market — expect competitive offers; lowballing is unlikely to land.
- Current owner paid $75k; list at $210k implies a 180% gain — meaningful room to come down on a strong offer.
Risks & watch-outs
- Climate carrying-cost: extreme-heat days projected 7→17/yr by 2055 (HVAC capex compounding) — expect insurance premiums to compound above CPI over the hold.
Questions for the listing agent
- Is there a deadline driving the sale (1031 exchange, divorce, estate, relocation)? That informs how much negotiation room exists.
- Schools are B-rated — typically a magnet for longer-tenancy family renters. What's the average tenant stay here, and is there a school-zone premium baked into asking?
- What's the average days-on-market for RENTAL listings here right now (not sales)? A rising rental-DOM trend means longer vacancies and softer asking-rent achievability than the comps imply.
- What's the recent tenant-quality profile in this submarket — average credit score on applications, eviction rate, late-payment / NSF rate, and stable-employment percentage? A property-management company in the area should have these aggregated.
- How much new for-sale + rental construction is in the pipeline within 1–3 miles? Heavy new supply typically softens prices + rents 12–24 months out; constrained supply supports both.
Investment metrics
- 1% rule
- 0.87% ✗
- Cap rate
- 7.18%
- Cash-on-cash
- 3.16%
- DSCR
- 1.14
- GRM
- 9.6
CMA / ARV
- ARV (on-the-fly)
- $346,451
- Comps found
- 12
Show comp detail 12 sales within ~0.75 mi
| Address | Dist | Beds/Ba | Sqft | Sold | Price | $/sf | Match |
|---|---|---|---|---|---|---|---|
| 3275 Thunderhead Dr | 0.15mi | 3/2.0 (+1) | 1,120 (-3%) | 4mo | $355,500 | $317 | 80 |
| 3425 Poppy Trail Dr | 0.18mi | 2/2.0 | 1,082 (-6%) | 4mo | $330,000 | $305 | 78 |
| 3445 Hassayampa Dr | 0.21mi | 2/2.0 | 1,074 (-7%) | 6mo | $369,000 | $344 | 74 |
| 3350 Medicine Bow Dr | 0.15mi | 3/2.0 (+1) | 1,218 (+6%) | 7mo | $360,000 | $296 | 72 |
| 3381 Yavapai Dr | 0.11mi | 2/2.0 | 1,031 (-10%) | 7mo | $310,000 | $301 | 72 |
| 3325 Medicine Bow Dr | 0.17mi | 2/2.0 | 1,291 (+12%) | 7mo | $360,000 | $279 | 66 |
| 3145 Arapaho Dr #101 | 0.49mi | 3/2.0 (+1) | 1,203 (+4%) | 6mo | $332,500 | $276 | 60 |
| 1051 Thunderbolt Ave | 0.27mi | 3/2.0 (+1) | 1,294 (+12%) | 7mo | $307,000 | $237 | 56 |
| 3389 Kearsage Dr | 0.56mi | 3/2.0 (+1) | 1,263 (+10%) | 4mo | $345,000 | $273 | 49 |
| 3540 Wallingford Dr W | 0.61mi | 2/2.0 | 984 (-14%) | 2mo | $359,900 | $366 | 46 |
| 3661 Parkview Dr | 0.56mi | 3/2.0 (+1) | 1,323 (+15%) | 3mo | $340,000 | $257 | 41 |
| 3690 Indian Hills Dr | 0.69mi | 3/2.0 (+1) | 1,304 (+13%) | 3mo | $600,000 | $460 | 38 |
Match score weights: distance 35% · size 25% · config 20% · recency 20%. Top-matched comps best support the ARV.
Projected returns pro-forma
-3.0% appreciation · 3.14% rent growth · sell at horizon
- IRR
- -11.2%
- Equity multiple
- 0.59×
- Total profit
- $-23,975
- Equity at exit
- $31,312
- IRR
- -1.8%
- Equity multiple
- 0.87×
- Total profit
- $-7,398
- Equity at exit
- $18,157
Cash invested: $58,800 (down + closing). Projections, not guarantees.
Landlord ↔ Tenant lean methodology
- Overall (STATE)
- 87 Strongly Landlord-Friendly
- State Arizona
- 87 Strongly Landlord-Friendly · R+3
- County
- — inherits STATE
- City
- — inherits STATE
ZIP-level market 86406
- Home prices YoY
- -28.5%
- Rents YoY
- 3.1%
- Active inventory
- 528
- Price-to-rent
- 9.6×
Monthly cashflow live
- Estimated rent
- $1,830 high interval (Pro) →
- Mortgage (P&I)
- −$1,101
- Tax from tax record
- −$102 /mo · $1,228/yr
- Insurance
- −$88
- HOA
- −$0
- Vacancy / Maint / Mgmt
- −$384
- Net cashflow
- $155
Break-even live
UW: 25.0% down · 7.5% · 30yr · 1.5% tax · 5.0% vac · 8.0% maint · 8.0% mgmt
Financing live
Cash to close
- Down payment
- $52,500
- Closing costs
- $6,300
- Reserves months
- —
- Total cash needed
- —
Loan-product check · same deal, 3 products live
Conventional
25% down · 7.5% · 30yr
- Down + closing
- —
- Monthly P&I
- —
- Monthly cashflow
- —
- DSCR
- —
- Eligible?
- —
Personal DTI + credit; lowest rate.
DSCR
20% down · 8.5% · 30yr
- Down + closing
- —
- Monthly P&I
- —
- Monthly cashflow
- —
- DSCR
- —
- Eligible?
- —
No personal income docs; deal must DSCR.
Hard money
10% down · 12.0% · 12mo
- Down + closing
- —
- Monthly P&I
- —
- Monthly cashflow
- —
- DSCR
- —
- Eligible?
- —
Short-term bridge; refi at stabilization.
Rent comps 30 comps
| Address | Beds | Baths | Sqft | Rent | $/sqft | DOM | Units | Dist |
|---|---|---|---|---|---|---|---|---|
| 3310 Winston Dr Lake Havasu City, AZ | 2.0 | 2.0 | 1108 | $3,250 | $2.93 | 43d | 1 | 0.38mi |
| 3200 Arapaho Dr Unit 102 Lake Havasu City, AZ | 2.0 | 2.0 | 1073 | $1,400 | $1.30 | 20d | 1 | 0.42mi |
| 3300 Tomahawk Dr Unit 101 Lake Havasu City, AZ | 3.0 | 3.0 | 1361 | $1,800 | $1.32 | 43d | 1 | 0.47mi |
| 3271 Kearsage Dr #103 Lake Havasu City, AZ | 2.0 | 2.0 | 720 | $1,200 | $1.67 | 43d | 1 | 0.49mi |
| 3180 Cotati Dr Lake Havasu City, AZ | 3.0 | 2.0 | 1347 | $2,400 | $1.78 | 43d | 1 | 0.55mi |
| 3380 Truckee Dr Unit 102 Lake Havasu City, AZ | 2.0 | 2.0 | 1141 | $1,450 | $1.27 | 20d | 1 | 0.56mi |
| 3092 Tomahawk Dr Lake Havasu City, AZ | 2.0 | 2.0 | 1081 | $1,600 | $1.48 | 20d | 1 | 0.56mi |
| 3175 Cotati Dr Lake Havasu City, AZ | 2.0 | 2.5 | 1473 | $2,300 | $1.56 | 43d | 1 | 0.59mi |
| 1331 Wapati Dr Lake Havasu City, AZ | 2.0 | 2.0 | 1001 | $1,500 | $1.50 | 43d | 1 | 0.64mi |
| 3430 Kearsage Dr Unit B101 Lake Havasu City, AZ | 2.0 | 2.0 | 1426 | $1,695 | $1.19 | 43d | 1 | 0.69mi |
| 3210 Sweetwater Ave Lake Havasu City, AZ | 2.0 | 2.0 | 915 | $1,825 | $1.99 | 43d | 2 | 0.70mi |
| 3210 Sweetwater Ave #130 Lake Havasu City, AZ | 2.0 | 2.0 | 915 | $2,000 | $2.19 | 13d | 1 | 0.71mi |
| 905 Mohican Dr Lake Havasu City, AZ | 3.0 | 1.0 | 1005 | $1,900 | $1.89 | 43d | 1 | 0.79mi |
| 3560 Lost Dutchman Dr Unit LOST3560 Lake Havasu City, AZ | 1.0 | 1.0 | 1318 | $1,350 | $1.02 | 43d | 1 | 0.81mi |
| 3815 Reservation Dr Lake Havasu City, AZ | 3.0 | 2.0 | 1477 | $1,795 | $1.22 | 43d | 1 | 0.85mi |
| 3048 Shoshone Dr Unit A204 Lake Havasu City, AZ | 2.0 | 2.0 | 960 | $1,395 | $1.45 | 43d | 1 | 0.97mi |
| 3048 Shoshone Dr Unit A104 Lake Havasu City, AZ | 2.0 | 2.0 | 960 | $1,395 | $1.45 | 20d | 1 | 0.97mi |
| 2860 Jamaica Blvd S Unit B101 Lake Havasu City, AZ | 2.0 | 2.0 | 1056 | $1,800 | $1.70 | 43d | 1 | 1.09mi |
| 1391 McCulloch Blvd S Lake Havasu City, AZ | 3.0 | 2.0 | 1423 | $2,500 | $1.76 | 13d | 1 | 1.10mi |
| 2740 Jericho Dr Lake Havasu City, AZ | 3.0 | 2.0 | 1388 | $2,900 | $2.09 | 43d | 1 | 1.14mi |
| 1507 Blackfoot Ln S Lake Havasu City, AZ | 3.0 | 2.0 | 1248 | $2,300 | $1.84 | 13d | 1 | 1.18mi |
| 1556 McCulloch Blvd S Lake Havasu City, AZ | 3.0 | 2.0 | 1194 | $1,800 | $1.51 | 43d | 1 | 1.24mi |
| 3720 Beachview Dr Lake Havasu City, AZ | 3.0 | 2.0 | 1427 | $1,700 | $1.19 | 13d | 1 | 1.24mi |
| 3128 Jamaica Blvd S Lake Havasu City, AZ | 2.0 | 2.0 | 1036 | $1,700 | $1.64 | 20d | 1 | 1.26mi |
| 3901 Ravello Dr Lake Havasu City, AZ | 2.0 | 2.0 | 1266 | $1,595 | $1.26 | 43d | 1 | 1.34mi |
| 690 Paseo Granada Lake Havasu City, AZ | 1.0 | 1.0 | 700 | $950 | $1.36 | 20d | 1 | 1.34mi |
| 3610 Breakwater Dr Lake Havasu City, AZ | 3.0 | 2.0 | 1268 | $1,850 | $1.46 | 20d | 1 | 1.35mi |
| 3610 Breakwater Dr Lake Havasu City, AZ | 3.0 | 2.0 | 1268 | $1,850 | $1.46 | 43d | 1 | 1.35mi |
| 2673 Jamaica Blvd S #14 Lake Havasu City, AZ | 2.0 | 2.0 | 1030 | $1,800 | $1.75 | 43d | 1 | 1.41mi |
| 3740 Breakwater Dr Lake Havasu City, AZ | 2.0 | 2.0 | 1250 | $1,700 | $1.36 | 43d | 1 | 1.48mi |
Listing history 2 events
-
2026-06-19remarks 424-char remark
-
2026-06-19$210,000 Active 1 DOM
ⓘ Source: listings_history table (triggers on properties + properties_extension) + one-shot
backfill from property_details.listing_events for pre-trigger history.
Tax reassessment forecast AZ · Resets to sale price
- Current annual tax
- $1,228 · $102/mo
- Projected year-2 tax
- $1,386 · $116/mo
- Expected delta
- +$158/yr (+$13/mo · 12.9%)
ⓘ Screening estimate from a state-policy table — verify with the county assessor before closing.
Climate risk First Street
- Flood 1/10 Low FEMA zone X (unshaded) · 0% chance over 30 yrs
- Wildfire 3/10 Moderate
- Heat 9/10 Extreme 7 d/yr ≥113°F today · 17 d/yr by 30 yrs out
- Wind 1/10 Low
- Air quality 1/10 Low 0 unhealthy d/yr today · 0 by 30 yrs out
Nearby sold comps map
Loading sold comps map…
Walkable amenities ~0.75 mi
Loading nearby amenities…
Taxation est. · year 1
- Rental income
- $21,964
- − Mortgage interest
- −$11,763
- − Property taxes
- −$1,228
- − Insurance
- −$1,050
- − Repairs & maintenance
- −$1,757
- − Management
- −$1,757
- − Depreciation
- −$6,109
- Taxable loss
- −$1,700
- Est. tax savings @ 24.0%
- +$408
- After-tax cash flow
- $2,267/yr
For passive investors: Depreciation is non-cash, so a rental often shows a tax loss while cash-flowing — sheltering income. Rental losses are passive: they offset passive income freely, and up to $25,000/yr can offset ordinary (W-2) income if you actively participate and your MAGI is under $100k (phasing out to $0 by $150k); unused losses carry forward. On sale, claimed depreciation is recaptured at up to 25%, and gains may owe capital-gains tax (a 1031 exchange can defer both). Figures are a year-1 estimate at your 24.0% rate — not tax advice; consult a CPA.
Schools (NCES district)
- District
- Lake Havasu Unified District (4368)
- NCES district ID
- 0404280
- Math proficiency
- 39% ▼ -16.00%
- Reading proficiency
- 41% ▼ -8.00%
- Median HH income
- $43,993
- Composite
- 33.92/100
- National rank
- #5339
- State rank
- #66 of 249 in AZ
Livability — Lake Havasu City
- Score
- 63/100
- State rank
- #124
- US rank
- #15839
Category grades
Schools grade is shown separately in the Schools card above.
Census & demographics
- Census place
- Lake Havasu City, AZ
- County
- Mohave County · 181,906 people
- City population
- 62,596
- Metro
- Lake Havasu City-Kingman, AZ
- Population (ZIP)
- 25,067
- Household income
- $77,506
- Rent vs Own
- Severe rent burden
- 376.0
Population outlook (Mohave County) Hauer SSP2
- Today (2025)
- 209,184 people
- By 2030
- 209,674 · +0.2%
- By 2040
- 205,897 · -1.6%
- By 2050
- 196,810 · -5.9%
- By 2075
- 169,454 · -19.0%
- By 2100
- 136,630 · -34.7%
Race, ethnicity, and origin ACS 2023
- Neighborhood character
- Predominantly White (81%)
- Race & ethnicity
- White 81% Hispanic / Latino 14% Two or more races 10%
- Hispanic origin (detail)
- Mexican 11%
- Common ancestry
- Iranian 5% Lithuanian 3% Portuguese 2%
- Foreign-born
- 7% · Canada
- Languages at home
- 92% English-only · Spanish 6% French/Haitian/Cajun 1%
Political lean MEDSL · Mohave
- 2024 margin
- Solid R (+55.8) · D 21.8% · R 77.6%
- 2008→2024 swing
- -22.9pp toward R · 2008: -32.9pp · 2024: -55.8pp
- All cycles
- 2024: R+55.8 2020: R+51.3 2016: R+51.5 2012: R+42.6 2008: R+32.9
Not yet ingested
- Civics
- —
Market trends
- HPI YoY
- ▼ -151.94%
- Current HPI
- 380.9101
- Rent YoY
- ▲ 3.14%
- Metro
- Lake Havasu City-Kingman, AZ
- State GDP YoY
- ▲ 4.54%
- F500 in state
- 20
Industry mix (Fortune 500 HQ in AZ)
| Industry | F500 HQs | Revenue |
|---|---|---|
| Technology | 2 | $13B |
|
||
| Mining / Metals | 1 | $23B |
|
||
| Environmental Services | 1 | $16B |
|
||
| Metals / Steel | 1 | $14B |
|
||
| Technology Distribution | 1 | $9B |
|
||
| Homebuilding | 1 | $8B |
|
||
Price history
+180.0% since first listed2 events — show timeline
- 2026-06-18 Listed $210,000 LHAR
- 1992-12-16 Sold (Public Records) $75,000 Public Records
Property tax history
+1.1%/yrLatest (2025): $1,228 · +1.7% YoY. Source: county tax records.
Cash-flow waterfall
monthlySold comps — $/sqft
last 12 mo · ≤1 miLoading sold comps…