3624 Parkridge Dr #213 · Dallas, TX
Flood risk 1/10 · Minimal
- FEMA flood zone
- X (unshaded)
- Chance of flooding over 30 yrs
- 0.0%
- Est. flood insurance / yr
- $507 – $1,088
Fire risk 1/10 · Minimal
- Est. fire insurance / yr
- $1,222 – $2,270
Heat risk 7/10 · Major
- Hot days now (above 109°F)
- 7 days/yr
- Hot days in 30 yrs
- 23 days/yr
Wind risk 6/10 · Moderate
- Chance of severe wind over 30 yrs
- 27.0%
Air-quality risk 3/10 · Minor
- Unhealthy air days now
- 3 days/yr
- Unhealthy air days in 30 yrs
- 4 days/yr
Risk factors via First Street. Map © Google.
Why this score? — see what drove the C grade
The composite is a weighted blend of 9 inputs, each scored 0–100. Each bar is that input's sub-score; the figure is the points it added to the 100-point composite (weight × sub-score).
- Cash flow +16.2/30.0
- ARV discount +15.0/15.0
- 1% rule +10.0/10.0
- DSCR +5.0/10.0
- Livability +4.0/5.0
- Schools +2.8/10.0
- Condition / age +2.5/5.0
- Rent growth +2.2/5.0
- Appreciation +0.0/10.0
$88,000
🖨 Deal sheet 📄 Offer letter ✓ Due diligence
Listing remarks MLS
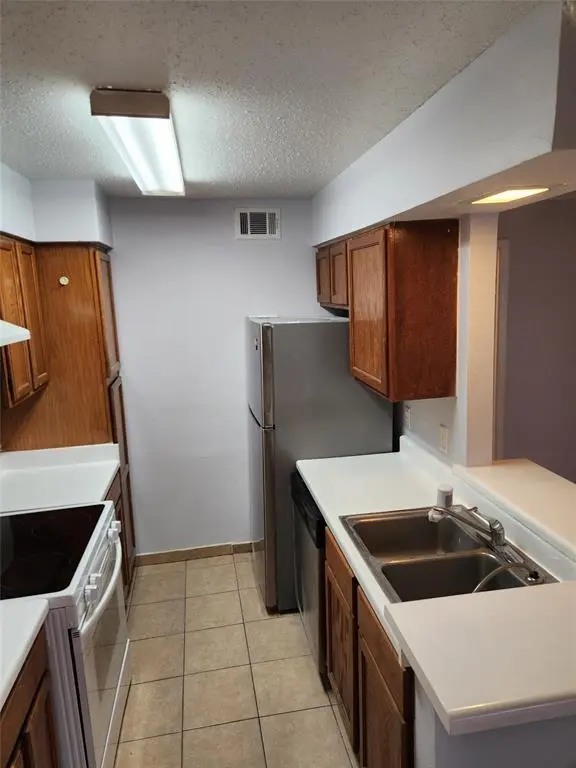
Charming corner 1 bedroom 1 bathroom condo in a highly sought after location. Close to shopping, dining and transportation, this well-located condo sits in a desirable position in the building—the unit is a corner, offering added privacy with no neighbors above you. It features two separate entries, including a main front entrance and an additional private entry through the bedroom. This condo has been painted nd refreshed ready for you to move in.
Key facts
- Corner unit
- $327 HOA
- Pool
Tags
Neighborhood map
What this means for you Summary
Snapshot
- This is a 1-bed/1.0-bath condo listed at $88k.
Deal economics
- At list price, monthly cash flow is $47 ($565/yr) — positive.
- The deal already cash-flows at list — no discount required.
- Meets the 1% rule at list price ($1k rent vs $88k).
- Recommended offer: $83k (6.0% below list) — sets the bar for market timing.
- Cap rate 6.9% vs local median 2.3% in Dallas — top-decile yield for the area; either an underpriced asset or a hidden risk that comps aren't pricing in. Stress-test before assuming the spread holds.
Location & tenants
- Location reads 81/100 on livability (#24 in TX, #1,380 nationally) — a professional / high-income tenant draw. Strengths: amenities A+, commute A+, housing A+; Watch: schools C-, crime F.
- Dallas ISD (urban): math 31% / reading 36% proficiency, ranked #559 of 826 in TX (top 68%) — families likely to look elsewhere, expect single-tenant / working-renter base with shorter leases; 83% free/reduced lunch — lower-income household profile, screen leases tightly.
- Market conditions: Rents soft (-1.3%/yr); 164 active listings in the ZIP; 8 comparable units currently listed for rent nearby; rentals lingering (median 44d on market — plan ~5-8 weeks vacancy on turnover, expect pricing pressure); 50% of comp listings sitting > 30 days — soft ceiling on asking rent; solid renter incomes; 12,577 units permitted in Dallas County in 2024 (6,829 in 5+ unit buildings).
Forward outlook
- Local home prices are declining (-3.0%/yr); year-one equity from $608 of loan paydown is wiped out by about $3k of value loss. Plan a longer hold.
- Dallas County population projected at +35% by 2050 — long-run rental-demand tailwind backs the buy-and-hold thesis.
Negotiation context
- It's been on market 80 days — a 6% lower offer ($83k) is reasonable based on typical stale-listing flexibility.
- 4 sale attempts since 10y ago; this cycle's ask has dropped $10k (10%) from the opening price — seller is motivated, your offer sets the floor, not the list.
Risks & watch-outs
- Watch-outs: HOA is 25% of rent.
- Climate carrying-cost: major wind risk, 27% chance of damaging wind over 30y; extreme-heat days projected 7→23/yr by 2055 (HVAC capex compounding) — expect insurance premiums to compound above CPI over the hold.
Questions for the listing agent
- It's been on market 80 days. Have you received any prior offers? Is the seller open to a 6% concession, seller financing, or rate buy-down credit?
- What does the HOA fee cover, when was the last increase, and are there any pending special assessments or reserve-fund shortfalls?
- Any open or pending special assessments — roof, HVAC, plumbing, elevator, façade? What's the per-unit balance and payoff schedule, and is the seller paying it off at close or rolling it to the buyer?
- Why hasn't it sold? Are there any deal-killer items the seller is aware of (foundation, flood, title, zoning, code violations)?
- Is there a deadline driving the sale (1031 exchange, divorce, estate, relocation)? That informs how much negotiation room exists.
- Crime grade is F in this area — have there been break-ins, vandalism, or insurance claims at this property in the last 3 years? What carrier currently insures it and at what premium?
- What's the average days-on-market for RENTAL listings here right now (not sales)? A rising rental-DOM trend means longer vacancies and softer asking-rent achievability than the comps imply.
- What's the recent tenant-quality profile in this submarket — average credit score on applications, eviction rate, late-payment / NSF rate, and stable-employment percentage? A property-management company in the area should have these aggregated.
- How much new apartment / multifamily construction is in the pipeline within 1–3 miles? Heavy new supply (>2% of stock underway) typically softens rents 12–24 months out; light construction supports rent growth.
Investment metrics
- 1% rule
- 1.51% ✓
- Cap rate
- 6.94%
- Cash-on-cash
- 2.29%
- DSCR
- 1.10
- GRM
- 5.5
CMA / ARV
- ARV (median comp)
- $108,253
- List price
- $88,000
- Delta
- -18.71%
- Verdict
- UNDERPRICED
- Comps
- 4 within 1.0 mi
Projected returns pro-forma
-3.0% appreciation · 0.0% rent growth · sell at horizon
- IRR
- -17.9%
- Equity multiple
- 0.40×
- Total profit
- $-14,893
- Equity at exit
- $13,121
- IRR
- -24.7%
- Equity multiple
- 0.06×
- Total profit
- $-23,093
- Equity at exit
- $7,609
Cash invested: $24,640 (down + closing). Projections, not guarantees.
Landlord ↔ Tenant lean methodology
- Overall (STATE)
- 87 Strongly Landlord-Friendly
- State Texas
- 87 Strongly Landlord-Friendly · R+5
- County
- — inherits STATE
- City
- — inherits STATE
ZIP-level market 75234
- Rents YoY
- -1.3%
- Active inventory
- 164
- Price-to-rent
- 5.5×
Monthly cashflow live
- Estimated rent
- $1,329 high interval (Pro) →
- Mortgage (P&I)
- −$461
- Tax from tax record
- −$178 /mo · $2,134/yr
- Insurance
- −$37
- HOA
- −$327
- Vacancy / Maint / Mgmt
- −$279
- Net cashflow
- $47
Break-even live
UW: 25.0% down · 7.5% · 30yr · 1.5% tax · 5.0% vac · 8.0% maint · 8.0% mgmt
Financing live
Cash to close
- Down payment
- $22,000
- Closing costs
- $2,640
- Reserves months
- —
- Total cash needed
- —
Loan-product check · same deal, 3 products live
Conventional
25% down · 7.5% · 30yr
- Down + closing
- —
- Monthly P&I
- —
- Monthly cashflow
- —
- DSCR
- —
- Eligible?
- —
Personal DTI + credit; lowest rate.
DSCR
20% down · 8.5% · 30yr
- Down + closing
- —
- Monthly P&I
- —
- Monthly cashflow
- —
- DSCR
- —
- Eligible?
- —
No personal income docs; deal must DSCR.
Hard money
10% down · 12.0% · 12mo
- Down + closing
- —
- Monthly P&I
- —
- Monthly cashflow
- —
- DSCR
- —
- Eligible?
- —
Short-term bridge; refi at stabilization.
Rent comps 8 comps
| Address | Beds | Baths | Sqft | Rent | $/sqft | DOM | Units | Dist |
|---|---|---|---|---|---|---|---|---|
| 3737 High Vista Dr Dallas, TX | 1.0–3.0 | 1.0–2.0 | 990 | $1,235 | $1.25 | 3d | 12 | 0.22mi |
| 3022 Forest Ln Dallas, TX | 1.0–2.0 | 1.0 | 696 | $1,175 | $1.69 | 43d | 2 | 1.06mi |
| 4030 Valley View Ln Dallas, TX | 1.0–2.0 | 1.0–2.0 | 851 | $990 | $1.16 | 19d | 6 | 1.08mi |
| 4040 Valley View Ln Farmers Branch, TX | 3.0 | 1.0–2.0 | 1102 | $2,335 | $2.12 | 2d | 67 | 1.20mi |
| 12806 Midway Rd #2024 Dallas, TX | 1.0 | 1.5 | 732 | $1,400 | $1.91 | 43d | 1 | 1.41mi |
| 12818 Midway Rd Dallas, TX | 1.0 | 1.0 | 625 | $1,050 | $1.68 | 43d | 1 | 1.46mi |
| 4020 McEwen Rd Dallas, TX | 1.0 | 1.0–1.5 | 825 | $1,988 | $2.41 | 1d | 12 | 1.47mi |
| 3795 Brookhaven Club Dr Farmers Branch, TX | 1.0 | 1.0 | 648 | $1,199 | $1.85 | 43d | 1 | 1.50mi |
HOA detail condo
- Monthly dues
- $327 · $3,924/yr
- Assessments
- None detected in remarks — confirm with the listing agent.
Listing history 28 events
-
2026-06-18days on market $88,000 Active 80 DOM
-
2026-06-17days on market $88,000 Active 79 DOM
-
2026-06-16days on market $88,000 Active 78 DOM
-
2026-06-15days on market $88,000 Active 77 DOM
-
2026-06-13days on market $88,000 Active 75 DOM
-
2026-06-09days on market $88,000 Active 71 DOM
-
2026-06-08days on market $88,000 Active 70 DOM
-
2026-06-07days on market $88,000 Active 69 DOM
-
2026-06-04days on market $88,000 Active 66 DOM
-
2026-06-03days on market $88,000 Active 65 DOM
-
2026-06-02days on market $88,000 Active 64 DOM
-
2026-06-01days on market $88,000 Active 63 DOM
-
2026-05-31days on market $88,000 Active 62 DOM
-
2026-04-29price $88,000 458-char remark
Show marketing remark (458 chars)
Charming corner 1 bedroom 1 bathroom condo in a highly sought after location. Close to shopping, dining and transportation, this well-located condo sits in a desirable position in the building—the unit is a corner, offering added privacy with no neighbors above you. It features two separate entries, including a main front entrance and an additional private entry through the bedroom. This condo has been painted nd refreshed ready for you to move in.
-
2026-03-30$98,000 Active 458-char remark
Show marketing remark (458 chars)
Charming corner 1 bedroom 1 bathroom condo in a highly sought after location. Close to shopping, dining and transportation, this well-located condo sits in a desirable position in the building—the unit is a corner, offering added privacy with no neighbors above you. It features two separate entries, including a main front entrance and an additional private entry through the bedroom. This condo has been painted nd refreshed ready for you to move in.
-
2025-12-31historical
-
2025-11-19price $99,000
-
2025-08-21price $110,000
-
2025-07-24price $85,000
-
2025-05-21$95,000 Active
-
2024-10-31historical
-
2024-08-23price $115,000
-
2024-05-30$125,000 Active
-
2016-06-06soldstatus
-
2016-06-03soldstatus Sold
-
2016-05-23status Pending
-
2016-05-12$50,000 Active
-
2005-03-08soldstatus
ⓘ Source: listings_history table (triggers on properties + properties_extension) + one-shot
backfill from property_details.listing_events for pre-trigger history.
Tax reassessment forecast TX · Resets to sale price
- Current annual tax
- $2,134 · $178/mo
- Projected year-2 tax
- $2,134 · $178/mo
- Expected delta
- $0/yr ($0/mo · 0.0%)
ⓘ Screening estimate from a state-policy table — verify with the county assessor before closing.
Climate risk First Street
- Flood 1/10 Low FEMA zone X (unshaded) · 0% chance over 30 yrs
- Wildfire 1/10 Low
- Heat 7/10 Severe 7 d/yr ≥109°F today · 23 d/yr by 30 yrs out
- Wind 6/10 Major 27% chance of damaging wind over 30 yrs
- Air quality 3/10 Moderate 3 unhealthy d/yr today · 4 by 30 yrs out
Nearby sold comps map
Loading sold comps map…
Walkable amenities ~0.75 mi
Loading nearby amenities…
Taxation est. · year 1
- Rental income
- $15,951
- − Mortgage interest
- −$4,929
- − Property taxes
- −$2,134
- − Insurance
- −$440
- − Repairs & maintenance
- −$1,276
- − Management
- −$1,276
- − HOA
- −$3,924
- − Depreciation
- −$2,560
- Taxable loss
- −$589
- Est. tax savings @ 24.0%
- +$141
- After-tax cash flow
- $707/yr
For passive investors: Depreciation is non-cash, so a rental often shows a tax loss while cash-flowing — sheltering income. Rental losses are passive: they offset passive income freely, and up to $25,000/yr can offset ordinary (W-2) income if you actively participate and your MAGI is under $100k (phasing out to $0 by $150k); unused losses carry forward. On sale, claimed depreciation is recaptured at up to 25%, and gains may owe capital-gains tax (a 1031 exchange can defer both). Figures are a year-1 estimate at your 24.0% rate — not tax advice; consult a CPA.
Schools (NCES district)
- District
- Dallas ISD
- NCES district ID
- 4816230
- Math proficiency
- 31% ▼ -16.00%
- Reading proficiency
- 36% ▼ -4.00%
- Median HH income
- $42,881
- Composite
- 28.41/100
- National rank
- #6763
- State rank
- #559 of 826 in TX
Livability — Dallas
- Score
- 81/100
- State rank
- #24
- US rank
- #1380
Category grades
Schools grade is shown separately in the Schools card above.
Census & demographics
- Census place
- Dallas, TX
- County
- Dallas County · 2,612,404 people
- City population
- 1,168,437
- Metro
- Dallas-Fort Worth-Arlington, TX
- Population (ZIP)
- 32,961
- Household income
- $86,733
- Rent vs Own
- Severe rent burden
- 1021.0
Population outlook (Dallas County) Hauer SSP2
- Today (2025)
- 2,979,839 people
- By 2030
- 3,191,823 · +7.1%
- By 2040
- 3,619,611 · +21.5%
- By 2050
- 4,026,915 · +35.1%
- By 2075
- 4,957,073 · +66.4%
- By 2100
- 5,508,725 · +84.9%
Race, ethnicity, and origin ACS 2023
- Neighborhood character
- Diverse neighborhood (Simpson 0.64)
- Race & ethnicity
- Hispanic / Latino 49% White 32% Two or more races 11% Asian 11% Black 6%
- Hispanic origin (detail)
- Mexican 36% Cuban 2%
- Common ancestry
- Lithuanian 2% Slovak 1% Italian 1%
- Foreign-born
- 32% · Canada, Vietnam, Jamaica
- Languages at home
- 48% English-only · Spanish 42% Other Asian/Pacific 3% Other Indo-European 3%
Political lean MEDSL · Dallas
- 2024 margin
- Strong D (+22.2) · D 60.2% · R 38.0% · Other 1.8%
- 2008→2024 swing
- +6.9pp toward D · 2008: 15.3pp · 2024: 22.2pp
- All cycles
- 2024: D+22.2 2020: D+31.6 2016: D+26.2 2012: D+15.4 2008: D+15.3
Not yet ingested
- Civics
- —
Market trends
- HPI YoY
- ▼ -325.83%
- Current HPI
- 326.1548
- Rent YoY
- ▼ -1.27%
- Metro
- Dallas-Fort Worth-Arlington, TX
- State GDP YoY
- ▲ 3.95%
- F500 in state
- 110
Industry mix (Fortune 500 HQ in TX)
| Industry | F500 HQs | Revenue |
|---|---|---|
| Energy | 16 | $1,198B |
|
||
| Technology | 5 | $198B |
|
||
| Engineering / Construction | 4 | $72B |
|
||
| Energy Services | 3 | $60B |
|
||
| Utilities | 3 | $41B |
|
||
| Healthcare | 2 | $330B |
|
||
Price history
+76.0% since first listed15 events — show timeline
- 2026-04-29 Price Changed $88,000 NTREIS
- 2026-03-30 Listed $98,000 NTREIS
- 2025-12-31 Listing Removed — NTREIS
- 2025-11-19 Price Changed $99,000 NTREIS
- 2025-08-21 Price Changed $110,000 NTREIS
- 2025-07-24 Price Changed $85,000 NTREIS
- 2025-05-21 Listed $95,000 NTREIS
- 2024-10-31 Listing Removed — NTREIS
- 2024-08-23 Price Changed $115,000 NTREIS
- 2024-05-30 Listed $125,000 NTREIS
- 2016-06-06 Sold (Public Records) — Public Records
- 2016-06-03 Sold (MLS) — NTREIS
- 2016-05-23 Pending — NTREIS
- 2016-05-12 Listed $50,000 NTREIS
- 2005-03-08 Sold (Public Records) — Public Records
Property tax history
+6.9%/yrLatest (2025): $2,134 · -9.7% YoY. Source: county tax records.
Cash-flow waterfall
monthlySold comps — $/sqft
last 12 mo · ≤1 miLoading sold comps…