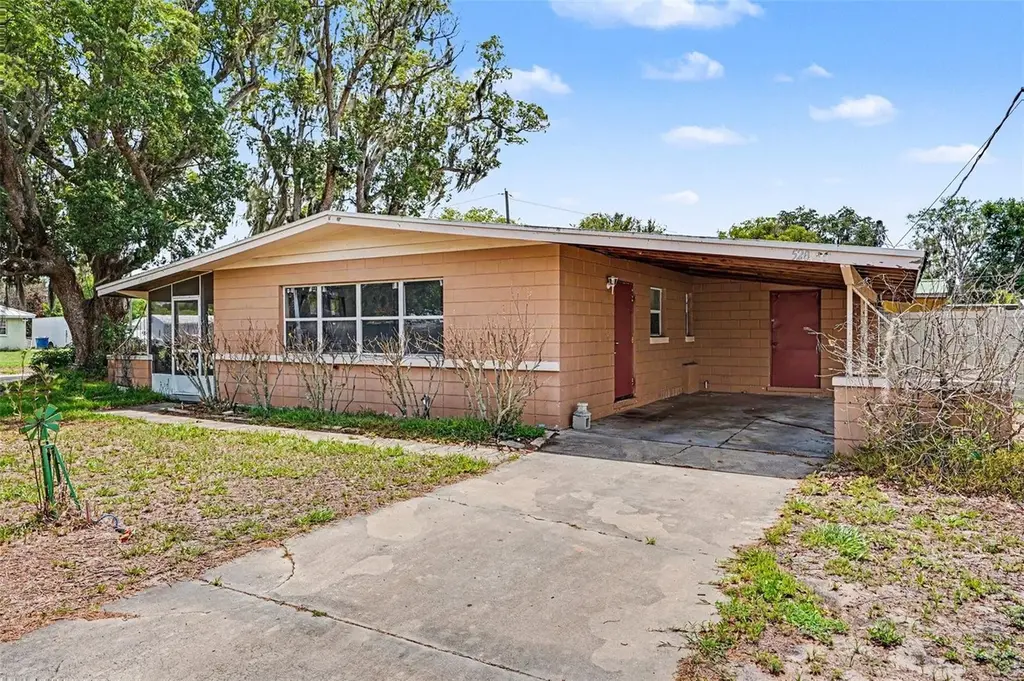
520 S Orange Ave · Fort Meade, FL
Flood risk 1/10 · Minimal
- FEMA flood zone
- X (unshaded)
- Chance of flooding over 30 yrs
- 0.0%
- Est. flood insurance / yr
- $507 – $1,088
Fire risk 6/10 · Moderate
- Est. fire insurance / yr
- $947 – $1,759
Heat risk 9/10 · Severe
- Hot days now (above 108°F)
- 7 days/yr
- Hot days in 30 yrs
- 27 days/yr
Wind risk 9/10 · Severe
- Chance of severe wind over 30 yrs
- 99.0%
Air-quality risk 2/10 · Minimal
- Unhealthy air days now
- 2 days/yr
- Unhealthy air days in 30 yrs
- 2 days/yr
Risk factors via First Street. Map © Google.
Why this score? — see what drove the D- grade
The composite is a weighted blend of 9 inputs, each scored 0–100. Each bar is that input's sub-score; the figure is the points it added to the 100-point composite (weight × sub-score).
- Appreciation +10.0/10.0
- ARV discount +7.5/15.0
- Cash flow +7.4/30.0
- Schools +3.5/10.0
- Livability +3.1/5.0
- Rent growth +2.5/5.0
- Condition / age +2.5/5.0
- DSCR +1.5/10.0
- 1% rule +1.0/10.0
$180,000
🖨 Deal sheet 📄 Offer letter ✓ Due diligence
Listing remarks MLS
NOT a short sale or bank owned. Charming block home features new carpet, tile flooring, freshly painted inside and out. Eat-in-kitchen comes with built in oven, range and refrigerator. A perfect starter or empty nester home. Must see! One of the sellersis a licensee.
Key facts
- Solid bones
- Curb appeal
- Functional layout
Tags
Property features AI
Finance
- Other: Property type: Residential, single family; Lot size approximately 0.21 acres (about 856 m²)
- Financial info: No lease restrictions
- HOA & community: No HOA association indicated; Pets allowed (up to 200 lbs)
Exterior
- Parking: Carport (1 space)
- Utilities: Public water; Public sewer; Public utilities
- Home design: Single family residence; One story; Home faces east; Homestead exempt
- Construction: Block construction; Shingle roof; Concrete perimeter foundation; Built on a 0.21-acre lot
- Exterior features: Irrigation equipment; Paved road access
Interior
- Kitchen: Range hood
- Bedrooms: 3 bedrooms
- Flooring: Laminate flooring; Tile flooring
- Bathrooms: 1 full bathroom
- Heating & cooling: Central heating; Central air conditioning
- Interior features: Ceiling fans; Range hood
- Laundry & utility: Washer hookup; Electric dryer hookup
Neighborhood map
What this means for you Summary
Snapshot
- This is a 2-bed/1.0-bath single-family listed at $180k.
Deal economics
- At list price, monthly cash flow is $-233 ($-3k/yr) — negative.
- To cash-flow at today's rent, offer at most $139k (22.9% below list).
- To meet the 1% rule (rent ≥ 1% of price), the offer needs to be $107k (40.4% below list).
- Recommended offer: $107k (40.4% below list) — sets the bar for 1% rule.
Location & tenants
- Location reads 61/100 on livability (#779 in FL) — a middle-class / working-renter tenant base. Strengths: cost of living A+, housing A+; Watch: amenities F, commute F, employment F.
- Polk (suburban): math 39% / reading 43% proficiency, ranked #62 of 73 in FL (top 85%) — families likely to look elsewhere, expect single-tenant / working-renter base with shorter leases.
- Zoned schools: Bartow Elementary Academy (math 55% / reading 72%, grade B, #564 of 2,144 statewide, top 27%, 518 students, 31% FRL) — zoned schools average 31% FRL vs 60% district-wide (28 pts lower); this property's tenant base skews higher-income than the district average.
- Zoned-school proficiency averages 64% at this address vs 41% district-wide (+22 pts) — the actual schools serving this property are materially stronger than the Polk average implies; a family-tenant draw the district grade alone would hide.
- Market conditions: 119 active listings in the ZIP; 10 comparable units currently listed for rent nearby; rentals at typical pace (median 23d on market — plan ~3-4 weeks tenant-placement turnaround); 10,384 units permitted in Polk County in 2024 (1,716 in 5+ unit buildings).
Forward outlook
- In year one you build about $19k of equity ($1k loan paydown + $18k appreciation (10.0% local appreciation)).
- Polk County population projected at +33% by 2050 — long-run rental-demand tailwind backs the buy-and-hold thesis.
- By year 2, paydown + projected appreciation supports a ~$31k cash-out refi (75% LTV) — recoverable capital for the next deal without selling this one.
Negotiation context
- Only 8 days on market — expect competitive offers; lowballing is unlikely to land.
- 7 sale attempts since 20y ago with the ask held roughly flat each time — persistent listings suggest the price (not the market) is what's stuck; bring a comps-based counter.
- Current owner paid $72k; list at $180k implies a 149% gain — meaningful room to come down on a strong offer.
Risks & watch-outs
- Climate carrying-cost: severe wind risk, 99% chance of damaging wind over 30y; major wildfire risk; extreme-heat days projected 7→27/yr by 2055 (HVAC capex compounding) — expect insurance premiums to compound above CPI over the hold.
Questions for the listing agent
- What do current leases actually rent for vs. the listed asking? Can we see a recent rent roll and the last 12 months of T-12 income?
- Built in 1963 — when were the roof, HVAC, electrical panel, plumbing, and water heater last replaced?
- Is there a deadline driving the sale (1031 exchange, divorce, estate, relocation)? That informs how much negotiation room exists.
- Schools are D-rated, which usually means shorter tenancies and higher turnover. Who's the typical renter profile here, and what's been the actual vacancy rate?
- The area grade is low — what's the realistic commute time and amenity access for the typical tenant pool here? Any planned neighborhood developments (good or bad) we should know about?
- What's the average days-on-market for RENTAL listings here right now (not sales)? A rising rental-DOM trend means longer vacancies and softer asking-rent achievability than the comps imply.
- What's the recent tenant-quality profile in this submarket — average credit score on applications, eviction rate, late-payment / NSF rate, and stable-employment percentage? A property-management company in the area should have these aggregated.
- How much new for-sale + rental construction is in the pipeline within 1–3 miles? Heavy new supply typically softens prices + rents 12–24 months out; constrained supply supports both.
Investment metrics
- 1% rule
- 0.60% ✗
- Cap rate
- 4.74%
- Cash-on-cash
- -5.55%
- DSCR
- 0.75
- GRM
- 14.0
CMA / ARV
No comps found within radius.
Projected returns pro-forma
10.0% appreciation · 3.0% rent growth · sell at horizon
- IRR
- 20.3%
- Equity multiple
- 2.65×
- Total profit
- $83,106
- Equity at exit
- $162,158
- IRR
- 18.5%
- Equity multiple
- 6.08×
- Total profit
- $256,238
- Equity at exit
- $349,700
Cash invested: $50,400 (down + closing). Projections, not guarantees.
Landlord ↔ Tenant lean methodology
- Overall (STATE)
- 87 Strongly Landlord-Friendly
- State Florida
- 87 Strongly Landlord-Friendly · R+3
- County
- — inherits STATE
- City
- — inherits STATE
ZIP-level market 33841
- Home prices YoY
- 7.7%
- Active inventory
- 119
- Price-to-rent
- 14.0×
Monthly cashflow live
- Estimated rent
- $1,073 high interval (Pro) →
- Mortgage (P&I)
- −$944
- Tax from tax record
- −$62 /mo · $740/yr
- Insurance
- −$75
- HOA
- −$0
- Vacancy / Maint / Mgmt
- −$225
- Net cashflow
- $-233
Break-even live
UW: 25.0% down · 7.5% · 30yr · 1.5% tax · 5.0% vac · 8.0% maint · 8.0% mgmt
Financing live
Cash to close
- Down payment
- $45,000
- Closing costs
- $5,400
- Reserves months
- —
- Total cash needed
- —
Loan-product check · same deal, 3 products live
Conventional
25% down · 7.5% · 30yr
- Down + closing
- —
- Monthly P&I
- —
- Monthly cashflow
- —
- DSCR
- —
- Eligible?
- —
Personal DTI + credit; lowest rate.
DSCR
20% down · 8.5% · 30yr
- Down + closing
- —
- Monthly P&I
- —
- Monthly cashflow
- —
- DSCR
- —
- Eligible?
- —
No personal income docs; deal must DSCR.
Hard money
10% down · 12.0% · 12mo
- Down + closing
- —
- Monthly P&I
- —
- Monthly cashflow
- —
- DSCR
- —
- Eligible?
- —
Short-term bridge; refi at stabilization.
Rent comps 10 comps
| Address | Beds | Baths | Sqft | Rent | $/sqft | DOM | Units | Dist |
|---|---|---|---|---|---|---|---|---|
| 24 2nd St SE Fort Meade, FL | 1.0 | 1.0 | 550 | $995 | $1.81 | 23d | 1 | 0.53mi |
| 121 S Seminole Ave Fort Meade, FL | 2.0 | 1.0 | 600 | $995 | $1.66 | 23d | 1 | 0.60mi |
| 1165 Meadowlawn St Fort Meade, FL | 2.0 | 2.0 | 756 | $1,250 | $1.65 | 23d | 1 | 0.90mi |
| 1175 Meadowlawn St Fort Meade, FL | 3.0 | 2.0 | 756 | $1,325 | $1.75 | 23d | 1 | 0.91mi |
| 1155 Meadowlawn St Fort Meade, FL | 2.0 | 1.5 | 924 | $1,150 | $1.24 | 23d | 1 | 0.91mi |
| 505 N Lanier Ave Fort Meade, FL | 1.0 | 1.0 | 660 | $990 | $1.50 | 23d | 1 | 0.98mi |
| 503 N Lanier Ave Fort Meade, FL | 1.0 | 1.0 | 660 | $990 | $1.50 | 23d | 1 | 0.99mi |
| 513 N Lanier Ave Fort Meade, FL | 1.0 | 1.0 | 660 | $990 | $1.50 | 23d | 1 | 0.99mi |
| 517 N Lanier Ave Fort Meade, FL | 1.0 | 1.0 | 660 | $990 | $1.50 | 23d | 1 | 1.00mi |
| 519 N Lanier Ave Fort Meade, FL | 1.0 | 1.0 | 660 | $990 | $1.50 | 3d | 1 | 1.00mi |
Listing history 8 events
-
2026-06-13status $180,000 Pending 8 DOM
-
2026-06-10days on market $180,000 Active 8 DOM
-
2026-06-09days on market $180,000 Active 7 DOM
-
2026-06-08days on market $180,000 Active 6 DOM
-
2026-06-07days on market $180,000 Active 5 DOM
-
2026-06-05days on market $180,000 Active 2 DOM
-
2026-06-03remarks 699-char remark
-
2026-06-03$180,000 Active 1 DOM
ⓘ Source: listings_history table (triggers on properties + properties_extension) + one-shot
backfill from property_details.listing_events for pre-trigger history.
Tax reassessment forecast FL · Resets to sale price
- Current annual tax
- $740 · $62/mo
- Projected year-2 tax
- $1,494 · $124/mo
- Expected delta
- +$754/yr (+$63/mo · 101.8%)
ⓘ Screening estimate from a state-policy table — verify with the county assessor before closing.
Climate risk First Street
- Flood 1/10 Low FEMA zone X (unshaded) · 0% chance over 30 yrs
- Wildfire 6/10 Major
- Heat 9/10 Extreme 7 d/yr ≥108°F today · 27 d/yr by 30 yrs out
- Wind 9/10 Extreme 99% chance of damaging wind over 30 yrs
- Air quality 2/10 Low 2 unhealthy d/yr today · 2 by 30 yrs out
Nearby sold comps map
Loading sold comps map…
Walkable amenities ~0.75 mi
Loading nearby amenities…
Taxation est. · year 1
- Rental income
- $12,875
- − Mortgage interest
- −$10,083
- − Property taxes
- −$740
- − Insurance
- −$900
- − Repairs & maintenance
- −$1,030
- − Management
- −$1,030
- − Depreciation
- −$5,236
- Taxable loss
- −$6,145
- Est. tax savings @ 24.0%
- +$1,475
- After-tax cash flow
- $-1,322/yr
For passive investors: Depreciation is non-cash, so a rental often shows a tax loss while cash-flowing — sheltering income. Rental losses are passive: they offset passive income freely, and up to $25,000/yr can offset ordinary (W-2) income if you actively participate and your MAGI is under $100k (phasing out to $0 by $150k); unused losses carry forward. On sale, claimed depreciation is recaptured at up to 25%, and gains may owe capital-gains tax (a 1031 exchange can defer both). Figures are a year-1 estimate at your 24.0% rate — not tax advice; consult a CPA.
Schools (NCES district)
- District
- Polk
- NCES district ID
- 1201590
- Math proficiency
- 39% ▼ -11.00%
- Reading proficiency
- 43% ▼ -4.00%
- Median HH income
- $43,979
- Composite
- 34.74/100
- National rank
- #5132
- State rank
- #62 of 73 in FL
Livability — Fort Meade
- Score
- 61/100
- State rank
- #779
- US rank
- #17625
Category grades
Schools grade is shown separately in the Schools card above.
Census & demographics
- Census place
- Fort Meade, FL
- Population (ZIP)
- 8,268
Population outlook (Polk County) Hauer SSP2
- Today (2025)
- 752,975 people
- By 2030
- 804,621 · +6.9%
- By 2040
- 906,117 · +20.3%
- By 2050
- 1,000,476 · +32.9%
- By 2075
- 1,197,520 · +59.0%
- By 2100
- 1,271,518 · +68.9%
Race, ethnicity, and origin ACS 2023
- Neighborhood character
- Diverse neighborhood (Simpson 0.59)
- Race & ethnicity
- White 50% Hispanic / Latino 38% Two or more races 13% Black 9%
- Hispanic origin (detail)
- Mexican 32% Puerto Rican 3%
- Common ancestry
- Slovak 1% Lithuanian 1%
- Foreign-born
- 11% · Canada, Jamaica
- Languages at home
- 70% English-only · Spanish 30%
Political lean MEDSL · Polk
- 2024 margin
- Strong R (+20.7) · D 39.2% · R 59.9%
- 2008→2024 swing
- -14.6pp toward R · 2008: -6.1pp · 2024: -20.7pp
- All cycles
- 2024: R+20.7 2020: R+14.4 2016: R+14.1 2012: R+6.8 2008: R+6.1
Not yet ingested
- Civics
- —
Market trends
- HPI YoY
- ▲ 26.92%
- Current HPI
- 376.8183
- Rent YoY
- —
- Metro
- —
- State GDP YoY
- ▲ 3.28%
- F500 in state
- 36
Industry mix (Fortune 500 HQ in FL)
| Industry | F500 HQs | Revenue |
|---|---|---|
| Industrial Technology | 2 | $29B |
|
||
| Insurance | 2 | $17B |
|
||
| Retail | 1 | $60B |
|
||
| Technology Distribution | 1 | $58B |
|
||
| Homebuilding | 1 | $35B |
|
||
| Technology Manufacturing | 1 | $35B |
|
||
Price history
+339.0% since first listed19 events — show timeline
- 2026-06-02 Listed $180,000 Stellar MLS as Distributed by MLS Grid
- 2025-03-27 Pending — Stellar MLS as Distributed by MLS Grid
- 2025-03-26 Listing Removed — Stellar MLS as Distributed by MLS Grid
- 2025-03-11 Price Changed $190,000 Stellar MLS as Distributed by MLS Grid
- 2025-03-04 Listed $200,000 Stellar MLS as Distributed by MLS Grid
- 2010-02-22 Sold (Public Records) $72,400 Public Records
- 2010-02-12 Sold (MLS) $72,350 Stellar MLS as Distributed by MLS Grid
- 2009-10-14 Listed $74,900 Stellar MLS as Distributed by MLS Grid
- 2009-09-18 Sold (MLS) $30,000 Stellar MLS as Distributed by MLS Grid
- 2009-05-05 Listed $45,000 Stellar MLS as Distributed by MLS Grid
- 2008-08-11 Listed $74,900 Stellar MLS as Distributed by MLS Grid
- 2008-08-08 Listing Removed — Stellar MLS as Distributed by MLS Grid
- 2008-02-07 Listed $87,900 Stellar MLS as Distributed by MLS Grid
- 2007-02-19 Listing Removed — Stellar MLS as Distributed by MLS Grid
- 2006-11-07 Listed $119,900 Stellar MLS as Distributed by MLS Grid
- 2005-12-19 Sold (Public Records) $79,000 Public Records
- 2004-05-13 Sold (Public Records) $51,000 Public Records
- 2003-12-10 Sold (Public Records) $40,000 Public Records
- 1998-10-29 Sold (Public Records) $41,000 Public Records
Property tax history
+8.6%/yrLatest (2025): $740 · +1.1% YoY. Source: county tax records.
Cash-flow waterfall
monthlySold comps — $/sqft
last 12 mo · ≤1 miLoading sold comps…