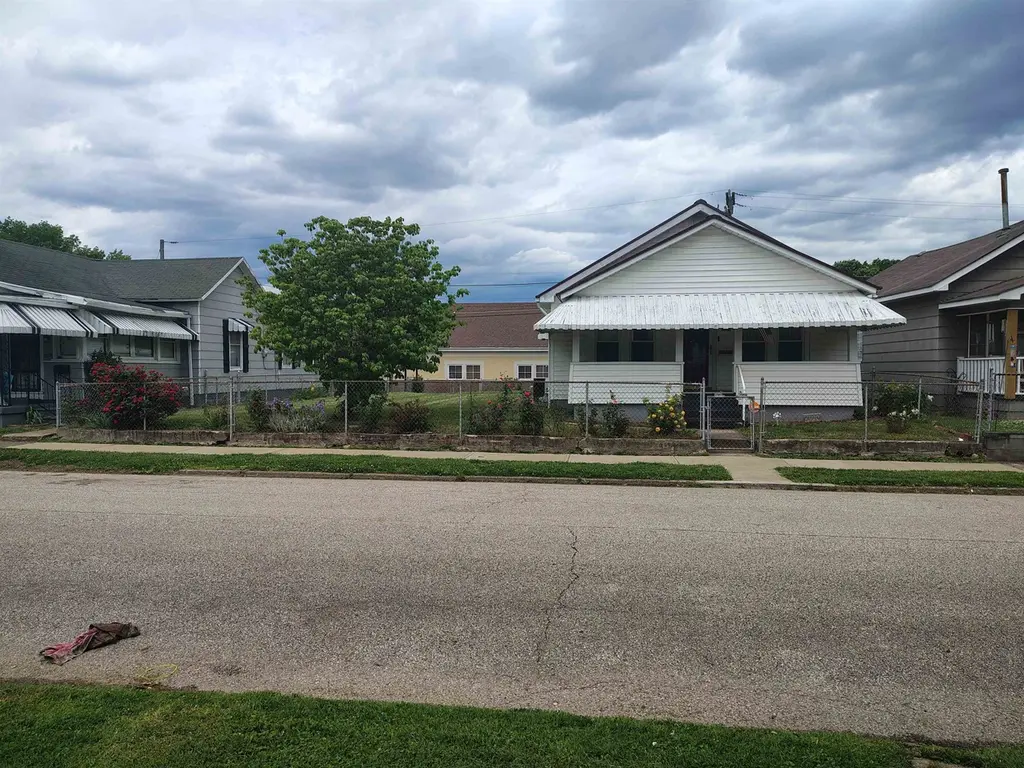
2020 Jefferson Ave · Huntington, WV
Flood risk 1/10 · Minimal
- FEMA flood zone
- X
- Chance of flooding over 30 yrs
- 0.0%
- Est. flood insurance / yr
- $507 – $1,088
Fire risk 3/10 · Minor
- Est. fire insurance / yr
- $787 – $1,461
Heat risk 5/10 · Moderate
- Hot days now (above 102°F)
- 7 days/yr
- Hot days in 30 yrs
- 20 days/yr
Wind risk 2/10 · Minimal
- Chance of severe wind over 30 yrs
- 1.0%
Air-quality risk 1/10 · Minimal
- Unhealthy air days now
- 0 days/yr
- Unhealthy air days in 30 yrs
- 0 days/yr
Risk factors via First Street. Map © Google.
Why this score? — see what drove the B grade
The composite is a weighted blend of 9 inputs, each scored 0–100. Each bar is that input's sub-score; the figure is the points it added to the 100-point composite (weight × sub-score).
- Cash flow +30.0/30.0
- ARV discount +10.9/15.0
- DSCR +10.0/10.0
- 1% rule +7.4/10.0
- Livability +4.0/5.0
- Schools +3.0/10.0
- Rent growth +2.5/5.0
- Condition / age +2.5/5.0
- Appreciation +0.0/10.0
$85,000
🖨 Deal sheet 📄 Offer letter ✓ Due diligence
Listing remarks
Double width fenced lot! One floor plan home in West Huntington on a quiet street. Easy access to Downtown, I-64 and more. Engineering report in file. 1 car carport with additional off street parking. Comfortable front porch, small rear deck and a storage building.
Key facts
- Quiet street
- Off street parking
- Carport
Tags
Property features AI
Exterior
- Utilities: Public water; Public sewer
- Home design: Single-family residence; Single story
- Construction: Vinyl siding
- Exterior features: Deck; Porch; Chain link fence; Level lot
Interior
- Kitchen: Range; Oven; Refrigerator; Dishwasher
- Flooring: Vinyl flooring; Carpet
- Bathrooms: 2 full bathrooms
- Heating & cooling: Electric central heating; Central air; Ceiling fans
- Interior features: Ceiling fans; Central air
- Laundry & utility: Washer; Dryer
Neighborhood map
What this means for you Summary
Snapshot
- This is a 3-bed/1.0-bath single-family listed at $85k.
Deal economics
- At list price, monthly cash flow is $333 ($4k/yr) — positive.
- The deal already cash-flows at list — no discount required.
- Meets the 1% rule at list price ($1k rent vs $85k).
- Recommended offer: $82k (3.0% below list) — sets the bar for market timing.
- Cap rate 11.0% vs local median 6.5% in Huntington — top-decile yield for the area; either an underpriced asset or a hidden risk that comps aren't pricing in. Stress-test before assuming the spread holds.
Location & tenants
- Location reads 79/100 on livability (#16 in WV, #2,045 nationally) — a middle-class / working-renter tenant base. Strengths: amenities A+, commute A+, cost of living A+; Watch: crime F, employment F.
- Cabell County Schools (urban): math 31% / reading 42% proficiency, ranked #13 of 55 in WV (top 24%) — families likely to look elsewhere, expect single-tenant / working-renter base with shorter leases.
- Zoned schools: Central City Elementary School (math 22% / reading 22%, grade F, #324 of 377 statewide, top 89%, 407 students, 0% FRL); Huntington High School (math 26% / reading 50%, grade F, #31 of 110 statewide, top 28%, 1,704 students, 0% FRL) — zoned schools average 0% FRL vs 47% district-wide (47 pts lower); this property's tenant base skews higher-income than the district average.
- Market conditions: 76 active listings in the ZIP; 1 comparable units currently listed for rent nearby; 61 units permitted in Cabell County in 2024 (5 in 5+ unit buildings).
Forward outlook
- Local home prices are declining (-3.0%/yr); year-one equity from $588 of loan paydown is wiped out by about $3k of value loss. Plan a longer hold.
- At projected returns (-3.0% appreciation + 3.0% rent growth), your $24k cash investment doubles in ~8 years — after that, you're playing with house money.
Negotiation context
- It's been on market 46 days — a 3% lower offer ($82k) is reasonable based on typical stale-listing flexibility.
Risks & watch-outs
- Watch-outs: built in 1945 — expect roof / HVAC / electrical / plumbing capex.
- Climate carrying-cost: extreme-heat days projected 7→20/yr by 2055 (HVAC capex compounding) — expect insurance premiums to compound above CPI over the hold.
Questions for the listing agent
- It's been on market 46 days. Have you received any prior offers? Is the seller open to a 3% concession, seller financing, or rate buy-down credit?
- Built in 1945 — when were the roof, HVAC, electrical panel, plumbing, and water heater last replaced?
- Is there a deadline driving the sale (1031 exchange, divorce, estate, relocation)? That informs how much negotiation room exists.
- Crime grade is F in this area — have there been break-ins, vandalism, or insurance claims at this property in the last 3 years? What carrier currently insures it and at what premium?
- What's the average days-on-market for RENTAL listings here right now (not sales)? A rising rental-DOM trend means longer vacancies and softer asking-rent achievability than the comps imply.
- What's the recent tenant-quality profile in this submarket — average credit score on applications, eviction rate, late-payment / NSF rate, and stable-employment percentage? A property-management company in the area should have these aggregated.
- How much new for-sale + rental construction is in the pipeline within 1–3 miles? Heavy new supply typically softens prices + rents 12–24 months out; constrained supply supports both.
Investment metrics
- 1% rule
- 1.24% ✓
- Cap rate
- 11.00%
- Cash-on-cash
- 16.80%
- DSCR
- 1.75
- GRM
- 6.7
CMA / ARV
- ARV (on-the-fly)
- $92,000
- Comps found
- 12
Show comp detail 12 sales within ~0.75 mi
| Address | Dist | Beds/Ba | Sqft | Sold | Price | $/sf | Match |
|---|---|---|---|---|---|---|---|
| 1648 Jefferson Ave | 0.31mi | 3/2.0 | 1,104 (-4%) | 7mo | $88,000 | $80 | 69 |
| 2126 Jefferson Ave | 0.12mi | 3/2.0 | 1,200 (+4%) | 19mo | $98,500 | $82 | 68 |
| 2210 Adams Ave | 0.17mi | 3/1.0 | 1,224 (+6%) | 19mo | $48,000 | $39 | 66 |
| 302 Clemens Ct | 0.30mi | 3/1.0 | 1,008 (-12%) | 2mo | $133,900 | $133 | 64 |
| 311 W 24th St | 0.38mi | 3/2.0 | 1,264 (+10%) | 0mo | $100,000 | $79 | 61 |
| 2917 Auburn Rd | 0.67mi | 3/1.5 | 1,164 (+1%) | 10mo | $134,967 | $116 | 57 |
| 329 Bernard St | 0.29mi | 3/1.0 | 1,032 (-10%) | 18mo | $124,500 | $121 | 54 |
| 527 26th St W | 0.41mi | 2/1.0 (-1) | 1,080 (-6%) | 18mo | $40,000 | $37 | 50 |
| 2945 Piedmont Rd | 0.68mi | 2/2.0 (-1) | 1,241 (+8%) | 2mo | $55,000 | $44 | 45 |
| 1585 S 19th Street St W | 0.62mi | 3/1.5 | 1,248 (+8%) | 16mo | $95,000 | $76 | 42 |
| 417 27th Street St W | 0.52mi | 3/2.0 | 998 (-13%) | 11mo | $105,000 | $105 | 40 |
| 2928 Chase St | 0.65mi | 2/1.0 (-1) | 1,008 (-12%) | 15mo | $69,900 | $69 | 31 |
Match score weights: distance 35% · size 25% · config 20% · recency 20%. Top-matched comps best support the ARV.
Projected returns pro-forma
-3.0% appreciation · 3.0% rent growth · sell at horizon
- IRR
- 7.9%
- Equity multiple
- 1.31×
- Total profit
- $7,406
- Equity at exit
- $12,674
- IRR
- 17.2%
- Equity multiple
- 2.41×
- Total profit
- $33,610
- Equity at exit
- $7,349
Cash invested: $23,800 (down + closing). Projections, not guarantees.
Landlord ↔ Tenant lean methodology
- Overall (STATE)
- 83 Strongly Landlord-Friendly
- State West Virginia
- 83 Strongly Landlord-Friendly · R+22
- County
- — inherits STATE
- City
- — inherits STATE
ZIP-level market 25704
- Home prices YoY
- -13.7%
- Active inventory
- 76
- Price-to-rent
- 6.7×
Monthly cashflow live
- Estimated rent
- $1,050 medium interval (Pro) →
- Mortgage (P&I)
- −$446
- Tax from tax record
- −$15 /mo · $182/yr
- Insurance
- −$35
- HOA
- −$0
- Vacancy / Maint / Mgmt
- −$220
- Net cashflow
- $333
Break-even live
UW: 25.0% down · 7.5% · 30yr · 1.5% tax · 5.0% vac · 8.0% maint · 8.0% mgmt
Financing live
Cash to close
- Down payment
- $21,250
- Closing costs
- $2,550
- Reserves months
- —
- Total cash needed
- —
Loan-product check · same deal, 3 products live
Conventional
25% down · 7.5% · 30yr
- Down + closing
- —
- Monthly P&I
- —
- Monthly cashflow
- —
- DSCR
- —
- Eligible?
- —
Personal DTI + credit; lowest rate.
DSCR
20% down · 8.5% · 30yr
- Down + closing
- —
- Monthly P&I
- —
- Monthly cashflow
- —
- DSCR
- —
- Eligible?
- —
No personal income docs; deal must DSCR.
Hard money
10% down · 12.0% · 12mo
- Down + closing
- —
- Monthly P&I
- —
- Monthly cashflow
- —
- DSCR
- —
- Eligible?
- —
Short-term bridge; refi at stabilization.
Rent comps 1 comps
| Address | Beds | Baths | Sqft | Rent | $/sqft | DOM | Units | Dist |
|---|---|---|---|---|---|---|---|---|
| 2956 Auburn Rd Huntington, WV | 1.0–2.0 | 1.0 | 767 | $1,050 | $1.37 | 43d | 2 | 0.75mi |
Listing history 17 events
-
2026-06-19days on market $85,000 Active 46 DOM
-
2026-06-18days on market $85,000 Active 45 DOM
-
2026-06-17days on market $85,000 Active 44 DOM
-
2026-06-16days on market $85,000 Active 43 DOM
-
2026-06-15days on market $85,000 Active 42 DOM
-
2026-06-14days on market $85,000 Active 40 DOM
-
2026-06-12days on market $85,000 Active 39 DOM
-
2026-06-09days on market $85,000 Active 36 DOM
-
2026-06-08days on market $85,000 Active 35 DOM
-
2026-06-07days on market $85,000 Active 34 DOM
-
2026-06-05days on market $85,000 Active 31 DOM
-
2026-06-03days on market $85,000 Active 30 DOM
-
2026-06-02days on market $85,000 Active 29 DOM
-
2026-06-01days on market $85,000 Active 28 DOM
-
2026-05-31days on market $85,000 Active 27 DOM
-
2026-05-30days on market $85,000 Active 26 DOM
-
2026-05-02$85,000 Active
ⓘ Source: listings_history table (triggers on properties + properties_extension) + one-shot
backfill from property_details.listing_events for pre-trigger history.
Tax reassessment forecast WV · Resets to sale price
- Current annual tax
- $182 · $15/mo
- Projected year-2 tax
- $502 · $42/mo
- Expected delta
- +$320/yr (+$27/mo · 175.6%)
ⓘ Screening estimate from a state-policy table — verify with the county assessor before closing.
Climate risk First Street
- Flood 1/10 Low FEMA zone X · 0% chance over 30 yrs
- Wildfire 3/10 Moderate
- Heat 5/10 Major 7 d/yr ≥102°F today · 20 d/yr by 30 yrs out
- Wind 2/10 Low 100% chance of damaging wind over 30 yrs
- Air quality 1/10 Low 0 unhealthy d/yr today · 0 by 30 yrs out
Nearby sold comps map
Loading sold comps map…
Walkable amenities ~0.75 mi
Loading nearby amenities…
Taxation est. · year 1
- Rental income
- $12,600
- − Mortgage interest
- −$4,761
- − Property taxes
- −$182
- − Insurance
- −$425
- − Repairs & maintenance
- −$1,008
- − Management
- −$1,008
- − Depreciation
- −$2,473
- Taxable income
- $2,743
- Est. tax owed @ 24.0%
- −$658
- After-tax cash flow
- $3,340/yr
For passive investors: Depreciation is non-cash, so a rental often shows a tax loss while cash-flowing — sheltering income. Rental losses are passive: they offset passive income freely, and up to $25,000/yr can offset ordinary (W-2) income if you actively participate and your MAGI is under $100k (phasing out to $0 by $150k); unused losses carry forward. On sale, claimed depreciation is recaptured at up to 25%, and gains may owe capital-gains tax (a 1031 exchange can defer both). Figures are a year-1 estimate at your 24.0% rate — not tax advice; consult a CPA.
Schools (NCES district)
- District
- Cabell County Schools
- NCES district ID
- 5400180
- Math proficiency
- 31% ▼ -7.00%
- Reading proficiency
- 42% ▼ -6.00%
- Median HH income
- $36,426
- Composite
- 30.26/100
- National rank
- #6285
- State rank
- #13 of 55 in WV
Livability — Huntington
- Score
- 79/100
- State rank
- #16
- US rank
- #2045
Category grades
Schools grade is shown separately in the Schools card above.
Census & demographics
- Census place
- Huntington, WV
- City population
- 25,795
- Population (ZIP)
- 14,413
Population outlook (Cabell County) Hauer SSP2
- Today (2025)
- 97,574 people
- By 2030
- 98,060 · +0.5%
- By 2040
- 98,817 · +1.3%
- By 2050
- 100,185 · +2.7%
- By 2075
- 105,895 · +8.5%
- By 2100
- 105,948 · +8.6%
Race, ethnicity, and origin ACS 2023
- Neighborhood character
- Predominantly White (93%)
- Race & ethnicity
- White 93% Two or more races 5% Black 2%
- Common ancestry
- Italian 3% Serbian 2% Slovak 2%
- Foreign-born
- 1% · Canada
- Languages at home
- 99% English-only · French/Haitian/Cajun 1%
Political lean MEDSL · Cabell
- 2024 margin
- Strong R (+21.9) · D 38.0% · R 59.9% · Other 2.0%
- 2008→2024 swing
- -11.8pp toward R · 2008: -10.1pp · 2024: -21.9pp
- All cycles
- 2024: R+21.9 2020: R+18.0 2016: R+25.5 2012: R+13.9 2008: R+10.1
Not yet ingested
- Civics
- —
Market trends
- HPI YoY
- ▼ -32.21%
- Current HPI
- 202.1322
- Rent YoY
- —
- Metro
- —
- State GDP YoY
- —
- F500 in state
- 0
Price history
1 event — show timeline
- 2026-05-02 Listed $85,000 HBRMLS
Property tax history
+1.0%/yrLatest (2025): $182 · +30.4% YoY. Source: county tax records.
Cash-flow waterfall
monthlySold comps — $/sqft
last 12 mo · ≤1 miLoading sold comps…