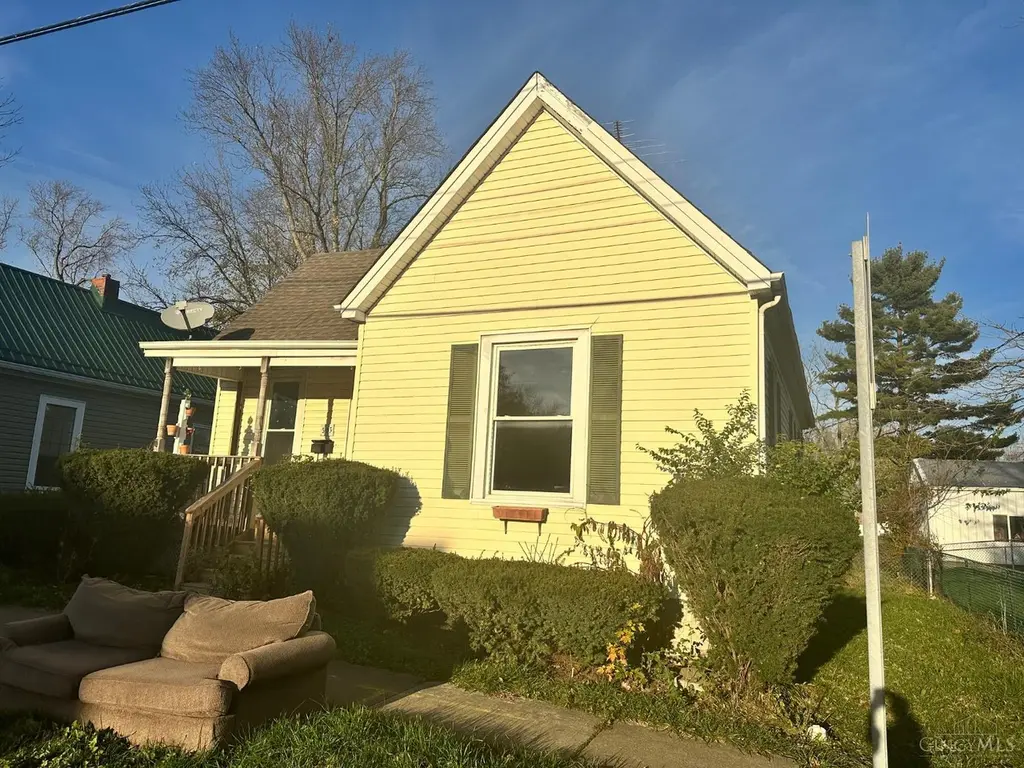
503 S Broadway St · Blanchester, OH
Flood risk 4/10 · Minor
- FEMA flood zone
- X (unshaded)
- Chance of flooding over 30 yrs
- 0.22%
- Est. flood insurance / yr
- $473 – $860
Fire risk 1/10 · Minimal
- Est. fire insurance / yr
- $713 – $1,323
Heat risk 4/10 · Minor
- Hot days now (above 100°F)
- 7 days/yr
- Hot days in 30 yrs
- 19 days/yr
Wind risk 2/10 · Minimal
- Chance of severe wind over 30 yrs
- 1.0%
Air-quality risk 2/10 · Minimal
- Unhealthy air days now
- 1 days/yr
- Unhealthy air days in 30 yrs
- 2 days/yr
Risk factors via First Street. Map © Google.
Why this score? — see what drove the D+ grade
The composite is a weighted blend of 9 inputs, each scored 0–100. Each bar is that input's sub-score; the figure is the points it added to the 100-point composite (weight × sub-score).
- ARV discount +15.0/15.0
- Cash flow +13.3/30.0
- Schools +4.2/10.0
- DSCR +4.0/10.0
- Livability +3.2/5.0
- 1% rule +3.1/10.0
- Rent growth +2.5/5.0
- Condition / age +2.5/5.0
- Appreciation +0.0/10.0
$130,000
🖨 Deal sheet 📄 Offer letter ✓ Due diligence
Listing remarks MLS
Fixer upper in the heart of Blanchester! This charming 2-bedroom, 1 bath home just needs some updating to turn it into the perfect home. The natural woodwork and cozy feeling of the home will make it hard to not fall in love. Endless possibilities!!
Key facts
- 5,663 sq ft lot
- Built 1900
- Listed 171 days
Neighborhood map
What this means for you Summary
Snapshot
- This is a 3-bed/1.0-bath single-family listed at $130k.
Deal economics
- At list price, monthly cash flow is $-1 ($-13/yr) — negative.
- To cash-flow at today's rent, offer at most $130k (0.1% below list).
- To meet the 1% rule (rent ≥ 1% of price), the offer needs to be $106k (18.6% below list).
- Recommended offer: $106k (18.6% below list) — sets the bar for 1% rule.
- Cap rate 6.3% vs local median 2.9% in Blanchester — top-decile yield for the area; either an underpriced asset or a hidden risk that comps aren't pricing in. Stress-test before assuming the spread holds.
Location & tenants
- Location reads 64/100 on livability (#773 in OH) — a middle-class / working-renter tenant base. Strengths: crime A+, cost of living A+, housing A+; Watch: amenities F, commute F, employment F.
- Blanchester Local (town): math 44% / reading 56% proficiency, ranked #441 of 656 in OH (top 67%) — acceptable for families but not a draw, mixed tenant base, ~2y average lease.
- Market conditions: 40 active listings in the ZIP; 119 units permitted in Clinton County in 2024 (0 in 5+ unit buildings).
Forward outlook
- Local home prices are declining (-3.0%/yr); year-one equity from $899 of loan paydown is wiped out by about $4k of value loss. Plan a longer hold.
- Clinton County population projected at -12% by 2050 — secular population decline; favor cash flow + early exit over multi-decade hold.
Negotiation context
- It's been on market 171 days — a 12% lower offer ($114k) is reasonable based on typical stale-listing flexibility.
- 4 sale attempts since 28y ago with the ask held roughly flat each time — persistent listings suggest the price (not the market) is what's stuck; bring a comps-based counter.
- Current owner paid $65k; list at $130k implies a 100% gain — meaningful room to come down on a strong offer.
Risks & watch-outs
- Watch-outs: built in 1900 — expect roof / HVAC / electrical / plumbing capex.
Questions for the listing agent
- What do current leases actually rent for vs. the listed asking? Can we see a recent rent roll and the last 12 months of T-12 income?
- It's been on market 171 days. Have you received any prior offers? Is the seller open to a 19% concession, seller financing, or rate buy-down credit?
- Built in 1900 — when were the roof, HVAC, electrical panel, plumbing, and water heater last replaced?
- Why hasn't it sold? Are there any deal-killer items the seller is aware of (foundation, flood, title, zoning, code violations)?
- Is there a deadline driving the sale (1031 exchange, divorce, estate, relocation)? That informs how much negotiation room exists.
- Schools are B-rated — typically a magnet for longer-tenancy family renters. What's the average tenant stay here, and is there a school-zone premium baked into asking?
- The area grade is low — what's the realistic commute time and amenity access for the typical tenant pool here? Any planned neighborhood developments (good or bad) we should know about?
- What's the average days-on-market for RENTAL listings here right now (not sales)? A rising rental-DOM trend means longer vacancies and softer asking-rent achievability than the comps imply.
- What's the recent tenant-quality profile in this submarket — average credit score on applications, eviction rate, late-payment / NSF rate, and stable-employment percentage? A property-management company in the area should have these aggregated.
- How much new for-sale + rental construction is in the pipeline within 1–3 miles? Heavy new supply typically softens prices + rents 12–24 months out; constrained supply supports both.
Investment metrics
- 1% rule
- 0.81% ✗
- Cap rate
- 6.28%
- Cash-on-cash
- -0.03%
- DSCR
- 1.00
- GRM
- 10.2
CMA / ARV
- ARV (median comp)
- $192,771
- List price
- $130,000
- Delta
- -32.56%
- Verdict
- UNDERPRICED
- Comps
- 20 within 1.0 mi
Show comp detail 12 sales within ~0.75 mi
| Address | Dist | Beds/Ba | Sqft | Sold | Price | $/sf | Match |
|---|---|---|---|---|---|---|---|
| 308 Lazenby St | 0.48mi | 3/1.0 | 960 (-6%) | 3mo | $210,000 | $219 | 65 |
| 111 W Baldwin St | 0.48mi | 3/1.0 | 986 (-4%) | 10mo | $175,000 | $177 | 63 |
| 7485 St Rt 123 | 0.56mi | 3/1.0 | 1,112 (+9%) | 1mo | $250,000 | $225 | 59 |
| 5458 Oak Grove Ave | 0.61mi | 3/1.0 | 960 (-6%) | 6mo | $136,000 | $142 | 56 |
| 129 Ash Ln | 0.65mi | 3/1.0 | 988 (-4%) | 9mo | $174,000 | $176 | 56 |
| 5545 Maple Grove Ave | 0.63mi | 4/2.0 (+1) | 1,056 (+3%) | 2mo | $252,500 | $239 | 55 |
| 7484 Fairground Rd | 0.67mi | 3/1.0 | 1,100 (+7%) | 5mo | $225,000 | $205 | 53 |
| 319 E Main St | 0.44mi | 2/2.0 (-1) | 1,088 (+6%) | 11mo | $145,000 | $133 | 51 |
| 196 Orchard Cir | 0.70mi | 3/1.0 | 914 (-11%) | 1mo | $175,000 | $191 | 49 |
| 5324 Clearview Ave | 0.53mi | 3/1.5 | 912 (-11%) | 9mo | $224,900 | $247 | 48 |
| 501 E Johns St | 0.67mi | 2/1.0 (-1) | 913 (-11%) | 2mo | $97,500 | $107 | 44 |
| 219 Orchard Cir | 0.68mi | 3/1.0 | 1,144 (+12%) | 11mo | $179,900 | $157 | 40 |
Match score weights: distance 35% · size 25% · config 20% · recency 20%. Top-matched comps best support the ARV.
Projected returns pro-forma
-3.0% appreciation · 3.0% rent growth · sell at horizon
- IRR
- -16.4%
- Equity multiple
- 0.42×
- Total profit
- $-21,154
- Equity at exit
- $19,383
- IRR
- -8.2%
- Equity multiple
- 0.49×
- Total profit
- $-18,594
- Equity at exit
- $11,240
Cash invested: $36,400 (down + closing). Projections, not guarantees.
Landlord ↔ Tenant lean methodology
- Overall (STATE)
- 73 Landlord-Friendly
- State Ohio
- 73 Landlord-Friendly · R+6
- County
- — inherits STATE
- City
- — inherits STATE
ZIP-level market 45107
- Home prices YoY
- -19.6%
- Active inventory
- 40
- Price-to-rent
- 10.2×
Monthly cashflow live
- Estimated rent
- $1,059 medium interval (Pro) →
- Mortgage (P&I)
- −$682
- Tax from tax record
- −$101 /mo · $1,218/yr
- Insurance
- −$54
- HOA
- −$0
- Vacancy / Maint / Mgmt
- −$222
- Net cashflow
- $-1
Break-even live
UW: 25.0% down · 7.5% · 30yr · 1.5% tax · 5.0% vac · 8.0% maint · 8.0% mgmt
Financing live
Cash to close
- Down payment
- $32,500
- Closing costs
- $3,900
- Reserves months
- —
- Total cash needed
- —
Loan-product check · same deal, 3 products live
Conventional
25% down · 7.5% · 30yr
- Down + closing
- —
- Monthly P&I
- —
- Monthly cashflow
- —
- DSCR
- —
- Eligible?
- —
Personal DTI + credit; lowest rate.
DSCR
20% down · 8.5% · 30yr
- Down + closing
- —
- Monthly P&I
- —
- Monthly cashflow
- —
- DSCR
- —
- Eligible?
- —
No personal income docs; deal must DSCR.
Hard money
10% down · 12.0% · 12mo
- Down + closing
- —
- Monthly P&I
- —
- Monthly cashflow
- —
- DSCR
- —
- Eligible?
- —
Short-term bridge; refi at stabilization.
Listing history 25 events
-
2026-06-18days on market $130,000 Active 171 DOM
-
2026-06-17days on market $130,000 Active 170 DOM
-
2026-06-16days on market $130,000 Active 169 DOM
-
2026-06-15days on market $130,000 Active 168 DOM
-
2026-06-13days on market $130,000 Active 166 DOM
-
2026-06-12days on market $130,000 Active 165 DOM
-
2026-06-09days on market $130,000 Active 162 DOM
-
2026-06-08days on market $130,000 Active 161 DOM
-
2026-06-07days on market $130,000 Active 160 DOM
-
2026-06-05days on market $130,000 Active 158 DOM
-
2026-06-04days on market $130,000 Active 156 DOM
-
2026-06-02days on market $130,000 Active 155 DOM
-
2026-06-01days on market $130,000 Active 154 DOM
-
2026-05-31days on market $130,000 Active 153 DOM
-
2025-12-22$130,000 Active 249-char remark
Show marketing remark (249 chars)
Fixer upper in the heart of Blanchester! This charming 2-bedroom, 1 bath home just needs some updating to turn it into the perfect home. The natural woodwork and cozy feeling of the home will make it hard to not fall in love. Endless possibilities!!
-
2025-11-14historical 249-char remark
Show marketing remark (249 chars)
Fixer Upper in the middle of Blanchester! This charming 2 bedroom, 1 bath home just needs some updating and it will be the perfect home! The natural woodwork and cozy feeling of the home will make it hard to not fall in love. Endless possibilities!!
-
2024-11-15$140,000 Active 249-char remark
Show marketing remark (249 chars)
Fixer Upper in the middle of Blanchester! This charming 2 bedroom, 1 bath home just needs some updating and it will be the perfect home! The natural woodwork and cozy feeling of the home will make it hard to not fall in love. Endless possibilities!!
-
2005-10-19soldstatus $65,000
-
2005-08-31soldstatus $46,000
-
2005-02-18$55,250
-
2000-04-03soldstatus $68,300
-
1998-08-28soldstatus $35,000
-
1998-05-20$37,900
-
1995-10-18soldstatus $45,000
-
1990-04-04soldstatus $34,000
ⓘ Source: listings_history table (triggers on properties + properties_extension) + one-shot
backfill from property_details.listing_events for pre-trigger history.
Tax reassessment forecast OH · Partial reset (capped growth)
- Current annual tax
- $1,218 · $101/mo
- Projected year-2 tax
- $1,623 · $135/mo
- Expected delta
- +$405/yr (+$34/mo · 33.3%)
ⓘ Screening estimate from a state-policy table — verify with the county assessor before closing.
Climate risk First Street
- Flood 4/10 Moderate FEMA zone X (unshaded) · 22% chance over 30 yrs
- Wildfire 1/10 Low
- Heat 4/10 Moderate 7 d/yr ≥100°F today · 19 d/yr by 30 yrs out
- Wind 2/10 Low 100% chance of damaging wind over 30 yrs
- Air quality 2/10 Low 1 unhealthy d/yr today · 2 by 30 yrs out
Nearby sold comps map
Loading sold comps map…
Walkable amenities ~0.75 mi
Loading nearby amenities…
Taxation est. · year 1
- Rental income
- $12,704
- − Mortgage interest
- −$7,282
- − Property taxes
- −$1,218
- − Insurance
- −$650
- − Repairs & maintenance
- −$1,016
- − Management
- −$1,016
- − Depreciation
- −$3,782
- Taxable loss
- −$2,260
- Est. tax savings @ 24.0%
- +$542
- After-tax cash flow
- $530/yr
For passive investors: Depreciation is non-cash, so a rental often shows a tax loss while cash-flowing — sheltering income. Rental losses are passive: they offset passive income freely, and up to $25,000/yr can offset ordinary (W-2) income if you actively participate and your MAGI is under $100k (phasing out to $0 by $150k); unused losses carry forward. On sale, claimed depreciation is recaptured at up to 25%, and gains may owe capital-gains tax (a 1031 exchange can defer both). Figures are a year-1 estimate at your 24.0% rate — not tax advice; consult a CPA.
Schools (NCES district)
- District
- Blanchester Local
- NCES district ID
- 3904638
- Math proficiency
- 44% ▼ -18.00%
- Reading proficiency
- 56% ▼ -8.00%
- Median HH income
- $45,867
- Composite
- 42.34/100
- National rank
- #3254
- State rank
- #441 of 656 in OH
Livability — Blanchester
- Score
- 64/100
- State rank
- #773
- US rank
- #14033
Category grades
Schools grade is shown separately in the Schools card above.
Census & demographics
- Census place
- Blanchester, OH
- County
- Clinton · 46,911 people
- City population
- 9,748
- Population (ZIP)
- 9,748
- Household income
- $65,625
- Rent vs Own
- Severe rent burden
- 2.7
Population outlook (Clinton County) Hauer SSP2
- Today (2025)
- 41,352 people
- By 2030
- 40,831 · -1.3%
- By 2040
- 39,049 · -5.6%
- By 2050
- 36,408 · -12.0%
- By 2075
- 29,652 · -28.3%
- By 2100
- 20,736 · -49.9%
Race, ethnicity, and origin ACS 2023
- Neighborhood character
- Predominantly White (95%)
- Race & ethnicity
- White 95% Hispanic / Latino 3% Native American 2% Two or more races 2%
- Common ancestry
- Slovak 4% Italian 1% Iranian 1%
- Foreign-born
- 3% · Canada
- Languages at home
- 97% English-only · Spanish 3%
Political lean MEDSL · Clinton
- 2024 margin
- Solid R (+54.6) · D 22.3% · R 76.9%
- 2008→2024 swing
- -24.3pp toward R · 2008: -30.3pp · 2024: -54.6pp
- All cycles
- 2024: R+54.6 2020: R+52.6 2016: R+52.6 2012: R+35.2 2008: R+30.3
Not yet ingested
- Civics
- —
Market trends
- HPI YoY
- ▼ -76.71%
- Current HPI
- 315.5856
- Rent YoY
- —
- Metro
- —
- State GDP YoY
- ▲ 1.98%
- F500 in state
- 48
Industry mix (Fortune 500 HQ in OH)
| Industry | F500 HQs | Revenue |
|---|---|---|
| Insurance | 3 | $145B |
|
||
| Industrial Machinery | 3 | $49B |
|
||
| Financial Services | 3 | $24B |
|
||
| Consumer Goods | 2 | $93B |
|
||
| Aerospace / Defense | 2 | $47B |
|
||
| Utilities | 2 | $33B |
|
||
Price history
+282.4% since first listed11 events — show timeline
- 2025-12-22 Listed $130,000 Cincy MLS
- 2025-11-14 Listing Removed — Cincy MLS
- 2024-11-15 Listed $140,000 Cincy MLS
- 2005-10-19 Sold (Public Records) $65,000 Public Records
- 2005-08-31 Sold (MLS) $46,000 Cincy MLS
- 2005-02-18 Listed $55,250 Cincy MLS
- 2000-04-03 Sold (Public Records) $68,300 Public Records
- 1998-08-28 Sold (MLS) $35,000 Cincy MLS
- 1998-05-20 Listed $37,900 Cincy MLS
- 1995-10-18 Sold (Public Records) $45,000 Public Records
- 1990-04-04 Sold (Public Records) $34,000 Public Records
Property tax history
+5.7%/yrLatest (2025): $1,218 · -5.8% YoY. Source: county tax records.
Cash-flow waterfall
monthlySold comps — $/sqft
last 12 mo · ≤1 miLoading sold comps…