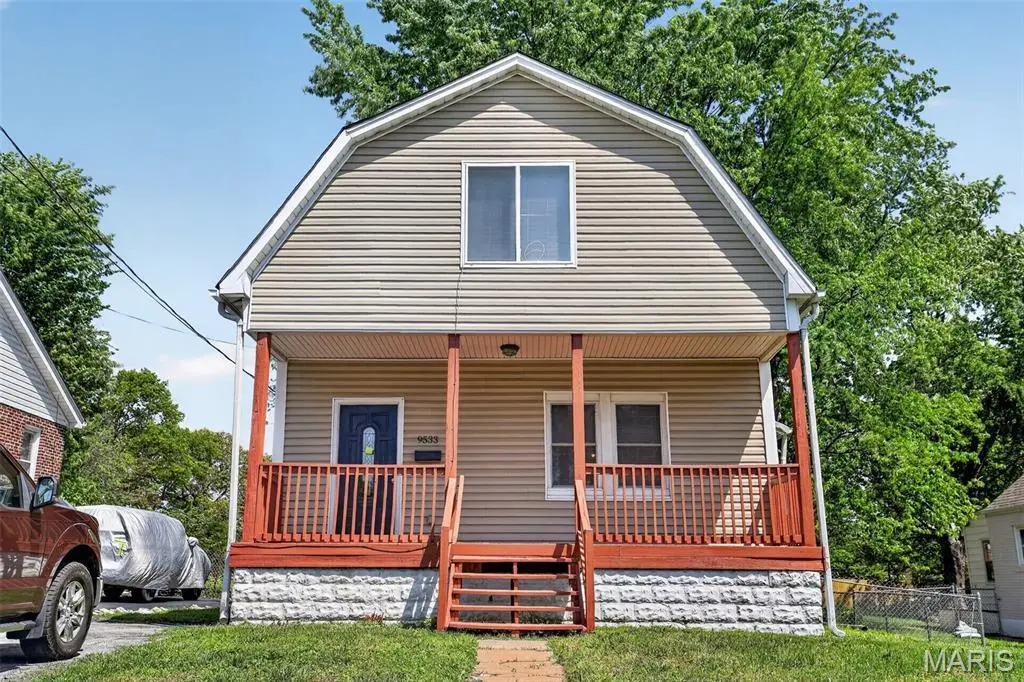
9533 Tennyson Ave · Overland, MO
Flood risk 1/10 · Minimal
- FEMA flood zone
- X (unshaded)
- Chance of flooding over 30 yrs
- 0.0%
- Est. flood insurance / yr
- $473 – $860
Fire risk 1/10 · Minimal
- Est. fire insurance / yr
- $1,054 – $1,958
Heat risk 4/10 · Minor
- Hot days now (above 106°F)
- 7 days/yr
- Hot days in 30 yrs
- 21 days/yr
Wind risk 2/10 · Minimal
- Chance of severe wind over 30 yrs
- 1.0%
Air-quality risk 2/10 · Minimal
- Unhealthy air days now
- 1 days/yr
- Unhealthy air days in 30 yrs
- 3 days/yr
Risk factors via First Street. Map © Google.
Why this score? — see what drove the C+ grade
The composite is a weighted blend of 9 inputs, each scored 0–100. Each bar is that input's sub-score; the figure is the points it added to the 100-point composite (weight × sub-score).
- Cash flow +25.2/30.0
- ARV discount +13.7/15.0
- DSCR +8.2/10.0
- 1% rule +6.4/10.0
- Livability +3.1/5.0
- Rent growth +3.0/5.0
- Condition / age +2.5/5.0
- Schools +1.7/10.0
- Appreciation +0.0/10.0
$129,900
🖨 Deal sheet 📄 Offer letter ✓ Due diligence
Listing remarks
Charming single-family residence located in the heart of Overland, Missouri. This well-situated home offers a comfortable and functional layout ideal for everyday living. Featuring a traditional design with a welcoming living area, spacious bedrooms, and a practical kitchen space, the property provides a great opportunity for both homeowners and investors alike. The home sits on a residential lot with a private yard, offering outdoor space suitable for relaxation, gardening, or entertaining. Interior spaces are designed for convenience and flexibility, with natural flow between common living areas. The property includes standard residential utilities and offers easy access to nearby schools
Key facts
- Private yard
- Outdoor space
- Functional layout
Tags
Property features AI
Finance
- Financial info: Lease not considered
Exterior
- Parking: Off-street parking
- Utilities: Public water; Public sewer; Electric service (other)
- Home design: Single-family residence; One level (main living on one level); House structure
- Construction: Brick veneer and wood siding; Asphalt roof; Slab foundation; Built using public records information
- Exterior features: Deck; Front porch; Chain link fencing; Level lot; Paved road access
Interior
- Kitchen: Free-standing electric range; Refrigerator
- Bedrooms: 3 bedrooms (all on the upper level)
- Flooring: Carpet; Hardwood
- Bathrooms: 1 full bathroom; 1 half bathroom (main level)
- Heating & cooling: Central air; Other heating
- Interior features: Partially finished basement; Free-standing electric range; Refrigerator
Neighborhood map
What this means for you Summary
Snapshot
- This is a 3-bed/1.5-bath single-family listed at $130k.
Deal economics
- At list price, monthly cash flow is $290 ($3k/yr) — positive.
- The deal already cash-flows at list — no discount required.
- Meets the 1% rule at list price ($1k rent vs $130k).
- Recommended offer: $128k (1.5% below list) — sets the bar for market timing.
- Cap rate 9.0% vs local median 6.2% in Overland — top-decile yield for the area; either an underpriced asset or a hidden risk that comps aren't pricing in. Stress-test before assuming the spread holds.
Location & tenants
- Location reads 61/100 on livability (#436 in MO) — a middle-class / working-renter tenant base. Strengths: cost of living A+, housing A+; Watch: health & safety C-, crime F, amenities F.
- Ritenour (suburban): math 13% / reading 27% proficiency, ranked #304 of 324 in MO (top 94%) — low school quality limits family demand, transient renter base, plan for 1-2y turnover; 66% free/reduced lunch — lower-income household profile, screen leases tightly.
- Zoned schools: Marion Elem. (math 18% / reading 30%, grade F, #907 of 1,115 statewide, top 81%, 475 students, 99% FRL); Ritenour Sr. High (math 9% / reading 36%, grade F, #455 of 521 statewide, top 88%, 1,873 students, 100% FRL) — zoned schools average 100% FRL vs 66% district-wide (34 pts higher); higher-poverty schools than district average — tighter screening recommended.
- Market conditions: Rents rising (+2.0%/yr); 118 active listings in the ZIP; 10 comparable units currently listed for rent nearby; rentals lingering (median 44d on market — plan ~5-8 weeks vacancy on turnover, expect pricing pressure); 60% of comp listings sitting > 30 days — soft ceiling on asking rent; 920 units permitted in St. Louis County in 2024 (250 in 5+ unit buildings).
- This rent runs 32% of the median local income ($56k/yr) — at the standard rent-burdened threshold; future hikes will face affordability resistance.
Forward outlook
- Local home prices are declining (-3.0%/yr); year-one equity from $898 of loan paydown is wiped out by about $4k of value loss. Plan a longer hold.
Negotiation context
- It's been on market 22 days — a 2% lower offer ($128k) is reasonable based on typical stale-listing flexibility.
- Current owner paid $72k; list at $130k implies a 80% gain — meaningful room to come down on a strong offer.
Risks & watch-outs
- Watch-outs: built in 1910 — expect roof / HVAC / electrical / plumbing capex.
Questions for the listing agent
- Built in 1910 — when were the roof, HVAC, electrical panel, plumbing, and water heater last replaced?
- Is there a deadline driving the sale (1031 exchange, divorce, estate, relocation)? That informs how much negotiation room exists.
- Schools are F-rated, which usually means shorter tenancies and higher turnover. Who's the typical renter profile here, and what's been the actual vacancy rate?
- Crime grade is F in this area — have there been break-ins, vandalism, or insurance claims at this property in the last 3 years? What carrier currently insures it and at what premium?
- What's the average days-on-market for RENTAL listings here right now (not sales)? A rising rental-DOM trend means longer vacancies and softer asking-rent achievability than the comps imply.
- What's the recent tenant-quality profile in this submarket — average credit score on applications, eviction rate, late-payment / NSF rate, and stable-employment percentage? A property-management company in the area should have these aggregated.
- How much new for-sale + rental construction is in the pipeline within 1–3 miles? Heavy new supply typically softens prices + rents 12–24 months out; constrained supply supports both.
Investment metrics
- 1% rule
- 1.14% ✓
- Cap rate
- 8.97%
- Cash-on-cash
- 9.55%
- DSCR
- 1.42
- GRM
- 7.3
CMA / ARV
- ARV (median comp)
- $150,848
- List price
- $129,900
- Delta
- -13.89%
- Verdict
- UNDERPRICED
- Comps
- 20 within 1.0 mi
Show comp detail 12 sales within ~0.75 mi
| Address | Dist | Beds/Ba | Sqft | Sold | Price | $/sf | Match |
|---|---|---|---|---|---|---|---|
| 9527 W Milton Ave | 0.09mi | 3/2.0 | 1,321 (+3%) | 2mo | $264,900 | $201 | 86 |
| 9512 Tennyson Ave | 0.06mi | 3/2.0 | 1,365 (+7%) | 2mo | $151,000 | $111 | 82 |
| 2527 Leslie Ave | 0.37mi | 3/1.0 | 1,223 (-4%) | 3mo | $95,900 | $78 | 71 |
| 2239 Wismer Ave | 0.71mi | 3/2.0 | 1,230 (-4%) | 0mo | $229,900 | $187 | 59 |
| 3213 Airway Ave | 0.68mi | 3/1.0 | 1,215 (-5%) | 3mo | $139,900 | $115 | 55 |
| 2408 Charlack Ave | 0.67mi | 3/1.0 | 1,205 (-6%) | 2mo | $129,000 | $107 | 55 |
| 8910 Shawnee Ln | 0.73mi | 3/2.0 | 1,350 (+6%) | 4mo | $179,000 | $133 | 51 |
| 10081 Thorpe Ave | 0.74mi | 3/1.0 | 1,349 (+6%) | 4mo | $269,900 | $200 | 51 |
| 2440 Chaucer Ave | 0.64mi | 3/2.5 | 1,408 (+10%) | 4mo | $210,000 | $149 | 46 |
| 2436 Pinehurst Dr | 0.70mi | 4/2.0 (+1) | 1,164 (-9%) | 1mo | $229,000 | $197 | 45 |
| 3007 Wismer Ave | 0.67mi | 3/2.0 | 1,434 (+12%) | 4mo | $120,000 | $84 | 43 |
| 9930 Carlyle Ave | 0.72mi | 2/1.0 (-1) | 1,437 (+12%) | 1mo | $169,900 | $118 | 38 |
Match score weights: distance 35% · size 25% · config 20% · recency 20%. Top-matched comps best support the ARV.
Projected returns pro-forma
-3.0% appreciation · 2.04% rent growth · sell at horizon
- IRR
- -3.0%
- Equity multiple
- 0.89×
- Total profit
- $-4,019
- Equity at exit
- $19,369
- IRR
- 5.6%
- Equity multiple
- 1.40×
- Total profit
- $14,577
- Equity at exit
- $11,231
Cash invested: $36,372 (down + closing). Projections, not guarantees.
Landlord ↔ Tenant lean methodology
- Overall (STATE)
- 81 Strongly Landlord-Friendly
- State Missouri
- 81 Strongly Landlord-Friendly · R+10
- County
- — inherits STATE
- City
- — inherits STATE
ZIP-level market 63114
- Rents YoY
- 2.0%
- Active inventory
- 118
- Price-to-rent
- 7.3×
Monthly cashflow live
- Estimated rent
- $1,487 high interval (Pro) →
- Mortgage (P&I)
- −$681
- Tax from tax record
- −$150 /mo · $1,797/yr
- Insurance
- −$54
- HOA
- −$0
- Vacancy / Maint / Mgmt
- −$312
- Net cashflow
- $290
Break-even live
UW: 25.0% down · 7.5% · 30yr · 1.5% tax · 5.0% vac · 8.0% maint · 8.0% mgmt
Financing live
Cash to close
- Down payment
- $32,475
- Closing costs
- $3,897
- Reserves months
- —
- Total cash needed
- —
Loan-product check · same deal, 3 products live
Conventional
25% down · 7.5% · 30yr
- Down + closing
- —
- Monthly P&I
- —
- Monthly cashflow
- —
- DSCR
- —
- Eligible?
- —
Personal DTI + credit; lowest rate.
DSCR
20% down · 8.5% · 30yr
- Down + closing
- —
- Monthly P&I
- —
- Monthly cashflow
- —
- DSCR
- —
- Eligible?
- —
No personal income docs; deal must DSCR.
Hard money
10% down · 12.0% · 12mo
- Down + closing
- —
- Monthly P&I
- —
- Monthly cashflow
- —
- DSCR
- —
- Eligible?
- —
Short-term bridge; refi at stabilization.
Rent comps 10 comps
| Address | Beds | Baths | Sqft | Rent | $/sqft | DOM | Units | Dist |
|---|---|---|---|---|---|---|---|---|
| 9429 Baltimore Ave Saint Louis, MO | 2.0 | 1.0 | 900 | $1,200 | $1.33 | 23d | 1 | 0.48mi |
| 9618 De Porres Ln Saint Louis, MO | 2.0 | 1.0 | 875 | $1,200 | $1.37 | 43d | 1 | 0.57mi |
| 3209 Dix Ave Saint Louis, MO | 3.0 | 1.0 | 1122 | $1,550 | $1.38 | 23d | 1 | 0.67mi |
| 3213 Airway Ave Saint Louis, MO | 3.0 | 1.0 | 1215 | $1,550 | $1.28 | 43d | 1 | 0.71mi |
| 2452 Ashland Ave Saint Louis, MO | 2.0 | 1.0 | 1028 | $1,350 | $1.31 | 43d | 1 | 1.05mi |
| 3434 Sims Ave Saint Ann, MO | 3.0 | 1.5 | 988 | $1,545 | $1.56 | 43d | 1 | 1.12mi |
| 10116 Saint Katherine Ln Saint Ann, MO | 3.0 | 1.0 | 984 | $1,865 | $1.90 | 17d | 1 | 1.22mi |
| 3648 Edmundson Rd Unit 1 St. Louis, MO | 2.0 | 1.0 | 900 | $995 | $1.11 | 43d | 1 | 1.26mi |
| 10525 Roseton Ct Saint Louis, MO | 2.0 | 2.0 | 1500 | $1,500 | $1.00 | 43d | 1 | 1.33mi |
| 1836 Morven Ave Saint Louis, MO | 2.0 | 1.5 | 1496 | $1,670 | $1.12 | 14d | 1 | 1.36mi |
Listing history 9 events
-
2026-05-01$129,900 Active 1041-char remark
-
2019-09-05soldstatus $72,000
-
2006-08-03soldstatus $130,000
-
2006-07-26soldstatus
-
2006-07-26soldstatus $88,159
-
2005-12-27soldstatus $88,159
-
2005-09-22soldstatus $50,300
-
2003-09-02soldstatus $64,500
-
1987-03-01soldstatus
ⓘ Source: listings_history table (triggers on properties + properties_extension) + one-shot
backfill from property_details.listing_events for pre-trigger history.
Tax reassessment forecast MO · Resets to sale price
- Current annual tax
- $1,797 · $150/mo
- Projected year-2 tax
- $1,797 · $150/mo
- Expected delta
- $0/yr ($0/mo · 0.0%)
ⓘ Screening estimate from a state-policy table — verify with the county assessor before closing.
Climate risk First Street
- Flood 1/10 Low FEMA zone X (unshaded) · 0% chance over 30 yrs
- Wildfire 1/10 Low
- Heat 4/10 Moderate 7 d/yr ≥106°F today · 21 d/yr by 30 yrs out
- Wind 2/10 Low 100% chance of damaging wind over 30 yrs
- Air quality 2/10 Low 1 unhealthy d/yr today · 3 by 30 yrs out
Nearby sold comps map
Loading sold comps map…
Walkable amenities ~0.75 mi
Loading nearby amenities…
Taxation est. · year 1
- Rental income
- $17,842
- − Mortgage interest
- −$7,276
- − Property taxes
- −$1,797
- − Insurance
- −$650
- − Repairs & maintenance
- −$1,427
- − Management
- −$1,427
- − Depreciation
- −$3,779
- Taxable income
- $1,485
- Est. tax owed @ 24.0%
- −$356
- After-tax cash flow
- $3,118/yr
For passive investors: Depreciation is non-cash, so a rental often shows a tax loss while cash-flowing — sheltering income. Rental losses are passive: they offset passive income freely, and up to $25,000/yr can offset ordinary (W-2) income if you actively participate and your MAGI is under $100k (phasing out to $0 by $150k); unused losses carry forward. On sale, claimed depreciation is recaptured at up to 25%, and gains may owe capital-gains tax (a 1031 exchange can defer both). Figures are a year-1 estimate at your 24.0% rate — not tax advice; consult a CPA.
Schools (NCES district)
- District
- Ritenour
- NCES district ID
- 2926640
- Math proficiency
- 13% ▼ -14.00%
- Reading proficiency
- 27% ▼ -7.00%
- Median HH income
- $41,410
- Composite
- 17.04/100
- National rank
- #9125
- State rank
- #304 of 324 in MO
Livability — Overland
- Score
- 61/100
- State rank
- #436
- US rank
- #17870
Category grades
Schools grade is shown separately in the Schools card above.
Census & demographics
- Census place
- Overland, MO
- County
- Saint Louis County · 888,823 people
- City population
- 33,969
- Metro
- St. Louis, MO-IL
- Population (ZIP)
- 33,969
- Household income
- $55,870
- Rent vs Own
- Severe rent burden
- 1595.0
Population outlook (St. Louis County) Hauer SSP2
- Today (2025)
- 1,025,227 people
- By 2030
- 1,028,023 · +0.3%
- By 2040
- 1,020,940 · -0.4%
- By 2050
- 1,007,280 · -1.8%
- By 2075
- 987,277 · -3.7%
- By 2100
- 921,984 · -10.1%
Race, ethnicity, and origin ACS 2023
- Neighborhood character
- Diverse neighborhood (Simpson 0.64)
- Race & ethnicity
- White 50% Black 30% Hispanic / Latino 11% Two or more races 6% Asian 2%
- Hispanic origin (detail)
- Mexican 7%
- Common ancestry
- Lithuanian 3% Italian 2% Romanian 1%
- Foreign-born
- 9% · Canada, Vietnam
- Languages at home
- 84% English-only · Spanish 10% French/Haitian/Cajun 2% Tagalog/Filipino 1%
Political lean MEDSL · St. Louis
- 2024 margin
- Strong D (+23.4) · D 60.8% · R 37.4% · Other 1.7%
- 2008→2024 swing
- +3.5pp toward D · 2008: 19.9pp · 2024: 23.4pp
- All cycles
- 2024: D+23.4 2020: D+24.0 2016: D+16.2 2012: D+13.7 2008: D+19.9
Not yet ingested
- Civics
- —
Market trends
- HPI YoY
- ▼ -276.62%
- Current HPI
- 223.9305
- Rent YoY
- ▲ 2.04%
- Metro
- St. Louis, MO-IL
- State GDP YoY
- ▲ 1.84%
- F500 in state
- 20
Industry mix (Fortune 500 HQ in MO)
| Industry | F500 HQs | Revenue |
|---|---|---|
| Healthcare | 1 | $163B |
|
||
| Insurance | 1 | $21B |
|
||
| Industrial Technology | 1 | $17B |
|
||
| Retail | 1 | $16B |
|
||
| Industrial Distribution | 1 | $10B |
|
||
| Utilities | 1 | $9B |
|
||
Price history
+101.4% since first listed10 events — show timeline
- 2026-05-23 Pending — MARIS as Distributed by MLS Grid
- 2026-05-01 Listed $129,900 MARIS as Distributed by MLS Grid
- 2019-09-05 Sold (Public Records) $72,000 Public Records
- 2006-08-03 Sold (Public Records) $130,000 Public Records
- 2006-07-26 Sold (Public Records) $88,159 Public Records
- 2006-07-26 Sold (Public Records) — Public Records
- 2005-12-27 Sold (Public Records) $88,159 Public Records
- 2005-09-22 Sold (Public Records) $50,300 Public Records
- 2003-09-02 Sold (Public Records) $64,500 Public Records
- 1987-03-01 Sold (Public Records) — Public Records
Property tax history
+5.1%/yrLatest (2022): $1,797 · +0.0% YoY. Source: county tax records.
Cash-flow waterfall
monthlySold comps — $/sqft
last 12 mo · ≤1 miLoading sold comps…