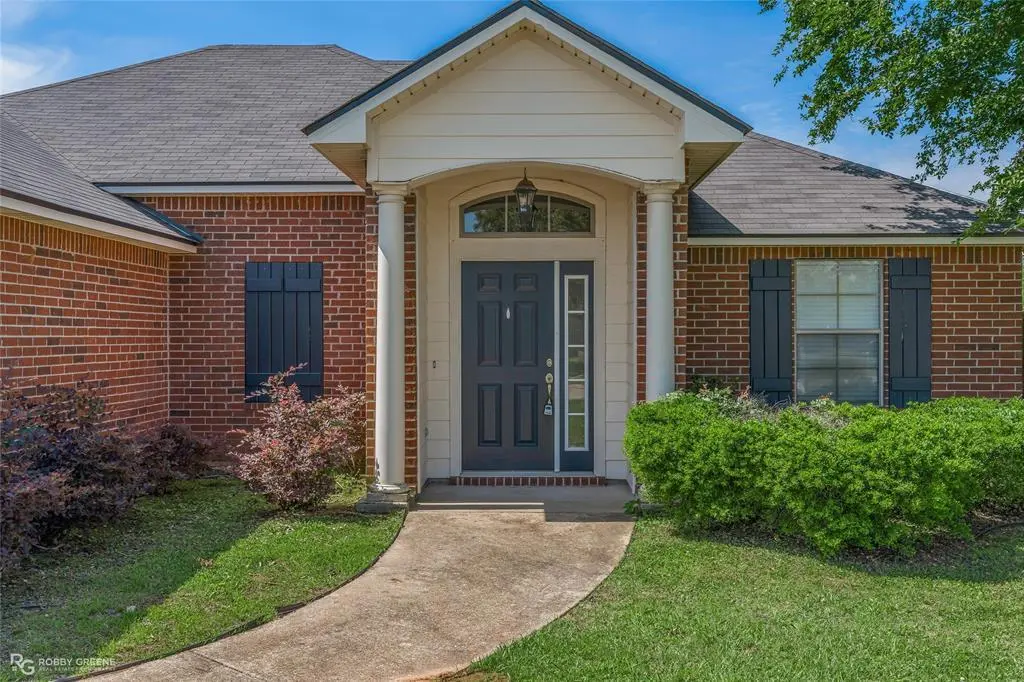
2110 Sweet Bay Cir · Bossier City, LA
Flood risk 1/10 · Minimal
- FEMA flood zone
- A
- Chance of flooding over 30 yrs
- 0.0%
- Est. flood insurance / yr
- $1,009 – $1,996
Fire risk 3/10 · Minor
- Est. fire insurance / yr
- $1,269 – $2,357
Heat risk 7/10 · Major
- Hot days now (above 110°F)
- 7 days/yr
- Hot days in 30 yrs
- 22 days/yr
Wind risk 6/10 · Moderate
- Chance of severe wind over 30 yrs
- 67.0%
Air-quality risk 2/10 · Minimal
- Unhealthy air days now
- 1 days/yr
- Unhealthy air days in 30 yrs
- 1 days/yr
Risk factors via First Street. Map © Google.
Why this score? — see what drove the D grade
The composite is a weighted blend of 9 inputs, each scored 0–100. Each bar is that input's sub-score; the figure is the points it added to the 100-point composite (weight × sub-score).
- ARV discount +12.1/15.0
- Cash flow +11.1/30.0
- Rent growth +4.1/5.0
- Schools +3.8/10.0
- Livability +3.6/5.0
- DSCR +3.2/10.0
- 1% rule +3.0/10.0
- Condition / age +2.5/5.0
- Appreciation +0.0/10.0
$274,900
🖨 Deal sheet 📄 Offer letter ✓ Due diligence
Listing remarks
Will go live once we have professional photos scheduled to go live May 8.. .. This charming three bedroom two bath single story home was built in two thousand six and offers approximately one thousand six hundred fifty five square feet of comfortable living space. The open floor plan includes a spacious living area that flows easily into the dining and kitchen spaces creating a warm and inviting atmosphere perfect for everyday living or entertaining. Bright and bold interior colors give this home unique personality and character. The kitchen features plenty of cabinet and counter space and connects conveniently to the dining area for effortless gatherings. The primary suite offers privacy w
Key facts
- Open floor plan
- Laundry area
- Spacious living area
Tags
Property features AI
Finance
- HOA & community: Mandatory association; Semi‑annual HOA fee covering grounds maintenance; Community pool; Playground
Exterior
- Parking: Attached 2-car garage (approx. 21' wide x 20' deep); 2 covered/carport spaces; Driveway
- Utilities: City water; City sewer; Not in a municipal utility district
- Home design: Single-family residence; One story; Residential property
- Construction: Shingle roof; Slab foundation; Built in 2006
- Exterior features: Covered patio/porch
Interior
- Kitchen: Dishwasher; Disposal; Electric range; Plumbed for gas in kitchen
- Bedrooms: Primary bedroom (first floor) with dual sinks, jetted tub and separate shower; Two additional bedrooms (first floor)
- Flooring: Carpet; Ceramic tile
- Bathrooms: Two full bathrooms
- Heating & cooling: Central heating (natural gas); Central electric air conditioning
- Interior features: Double vanity; High-speed internet available; Kitchen island; Pantry; Walk-in closet(s)
- Laundry & utility: Full-size washer/dryer area; Washer hookup; Electric dryer hookup; Gas dryer hookup; Gas water heater
Neighborhood map
What this means for you Summary
Snapshot
- This is a 3-bed/2.0-bath single-family listed at $275k.
Deal economics
- At list price, monthly cash flow is $-237 ($-3k/yr) — negative.
- To cash-flow at today's rent, offer at most $233k (15.2% below list).
- To meet the 1% rule (rent ≥ 1% of price), the offer needs to be $220k (20.0% below list).
- Recommended offer: $220k (20.0% below list) — sets the bar for 1% rule.
- Cap rate 5.8% vs local median 4.7% in Bossier City — meaningfully above typical; check what's discounted (condition, days-on-market, listing class) to confirm the premium yield is real.
Location & tenants
- Location reads 71/100 on livability (#47 in LA) — a middle-class / working-renter tenant base. Strengths: commute A+, cost of living A+, housing A+; Watch: employment D+, crime F, amenities F.
- Bossier Parish (urban): math 40% / reading 47% proficiency, ranked #17 of 98 in LA (top 17%) — families likely to look elsewhere, expect single-tenant / working-renter base with shorter leases.
- Zoned schools: Bossier Elementary School (math 8% / reading 17%, grade F, #550 of 646 statewide, top 88%, 222 students, 93% FRL) — zoned schools average 93% FRL vs 41% district-wide (52 pts higher); higher-poverty schools than district average — tighter screening recommended.
- Zoned-school proficiency averages 12% at this address vs 44% district-wide (-31 pts) — the specific schools serving this property underperform the Bossier Parish average; the district grade overstates school quality for this exact location.
- Market conditions: Rents rising fast (+6.6%/yr); 421 active listings in the ZIP; 11 comparable units currently listed for rent nearby; rentals at typical pace (median 21d on market — plan ~3-4 weeks tenant-placement turnaround); 716 units permitted in Bossier Parish in 2024 (0 in 5+ unit buildings).
- This rent runs 40% of the median local income ($65k/yr) — at the standard rent-burdened threshold; future hikes will face affordability resistance.
Forward outlook
- Local home prices are declining (-3.0%/yr); year-one equity from $2k of loan paydown is wiped out by about $8k of value loss. Plan a longer hold.
- Bossier County population projected at +28% by 2050 — long-run rental-demand tailwind backs the buy-and-hold thesis.
Negotiation context
- It's been on market 40 days — a 3% lower offer ($267k) is reasonable based on typical stale-listing flexibility.
Risks & watch-outs
- Watch-outs: flood insurance adds $125/mo.
- Climate carrying-cost: in FEMA flood zone A (mandatory federal flood insurance); major wind risk, 67% chance of damaging wind over 30y; extreme-heat days projected 7→22/yr by 2055 (HVAC capex compounding) — expect insurance premiums to compound above CPI over the hold.
Questions for the listing agent
- What do current leases actually rent for vs. the listed asking? Can we see a recent rent roll and the last 12 months of T-12 income?
- It's been on market 40 days. Have you received any prior offers? Is the seller open to a 20% concession, seller financing, or rate buy-down credit?
- What's the actual annual flood-insurance premium (NFIP or private), and is the property in a SFHA with mandatory coverage?
- What does the HOA fee cover, when was the last increase, and are there any pending special assessments or reserve-fund shortfalls?
- Is there a deadline driving the sale (1031 exchange, divorce, estate, relocation)? That informs how much negotiation room exists.
- Schools are B-rated — typically a magnet for longer-tenancy family renters. What's the average tenant stay here, and is there a school-zone premium baked into asking?
- Crime grade is F in this area — have there been break-ins, vandalism, or insurance claims at this property in the last 3 years? What carrier currently insures it and at what premium?
- The area grade is low — what's the realistic commute time and amenity access for the typical tenant pool here? Any planned neighborhood developments (good or bad) we should know about?
- What's the average days-on-market for RENTAL listings here right now (not sales)? A rising rental-DOM trend means longer vacancies and softer asking-rent achievability than the comps imply.
- What's the recent tenant-quality profile in this submarket — average credit score on applications, eviction rate, late-payment / NSF rate, and stable-employment percentage? A property-management company in the area should have these aggregated.
- How much new for-sale + rental construction is in the pipeline within 1–3 miles? Heavy new supply typically softens prices + rents 12–24 months out; constrained supply supports both.
Investment metrics
- 1% rule
- 0.80% ✗
- Cap rate
- 5.81%
- Cash-on-cash
- -1.74%
- DSCR
- 0.92
- GRM
- 10.4
CMA / ARV
- ARV (median comp)
- $306,308
- List price
- $274,900
- Delta
- -10.25%
- Verdict
- UNDERPRICED
- Comps
- 20 within 1.0 mi
Show comp detail 12 sales within ~0.75 mi
| Address | Dist | Beds/Ba | Sqft | Sold | Price | $/sf | Match |
|---|---|---|---|---|---|---|---|
| 2114 Sweet Bay Cir | 0.03mi | 3/2.0 | 1,542 (-6%) | 13mo | $279,000 | $181 | 78 |
| 3070 Dublin Way | 0.39mi | 3/2.0 | 1,549 (-6%) | 5mo | $284,900 | $184 | 68 |
| 606 Perfect Pl | 0.69mi | 3/2.5 | 1,676 (+2%) | 2mo | $265,000 | $158 | 60 |
| 3514 Grand Cane Ln | 0.45mi | 3/2.0 | 1,560 (-5%) | 14mo | $273,500 | $175 | 60 |
| 4012 False River Dr | 0.73mi | 3/2.0 | 1,552 (-5%) | 2mo | $275,000 | $177 | 56 |
| 613 Perfect Pl | 0.71mi | 3/2.5 | 1,650 (+0%) | 11mo | $310,000 | $188 | 55 |
| 100 Grand Cane Ct | 0.65mi | 3/2.0 | 1,549 (-6%) | 7mo | $279,870 | $181 | 54 |
| 615 Perfect Pl | 0.72mi | 3/2.0 | 1,562 (-5%) | 15mo | $307,900 | $197 | 46 |
| 109 Katy Ln | 0.63mi | 3/2.0 | 1,862 (+14%) | 10mo | $387,500 | $208 | 40 |
| 306 Prien Lake Loop | 0.74mi | 3/2.0 | 1,807 (+10%) | 10mo | $331,840 | $184 | 40 |
| 116 Willow Lake Blvd | 0.74mi | 3/2.0 | 1,872 (+14%) | 3mo | $279,500 | $149 | 39 |
| 409 Perfect Pl | 0.72mi | 2/2.0 (-1) | 1,411 (-14%) | 16mo | $275,000 | $195 | 25 |
Match score weights: distance 35% · size 25% · config 20% · recency 20%. Top-matched comps best support the ARV.
Projected returns pro-forma
-3.0% appreciation · 6.56% rent growth · sell at horizon
- IRR
- -18.4%
- Equity multiple
- 0.33×
- Total profit
- $-51,393
- Equity at exit
- $40,988
- IRR
- -4.8%
- Equity multiple
- 0.64×
- Total profit
- $-27,842
- Equity at exit
- $23,768
Cash invested: $76,972 (down + closing). Projections, not guarantees.
Landlord ↔ Tenant lean methodology
- Overall (STATE)
- 90 Strongly Landlord-Friendly
- State Louisiana
- 90 Strongly Landlord-Friendly · R+12
- County
- — inherits STATE
- City
- — inherits STATE
ZIP-level market 71111
- Home prices YoY
- -34.8%
- Rents YoY
- 6.6%
- Active inventory
- 421
- Price-to-rent
- 10.4×
Monthly cashflow live
- Estimated rent
- $2,198 high interval (Pro) →
- Mortgage (P&I)
- −$1,442
- Tax from tax record
- −$244 /mo · $2,928/yr
- Insurance
- −$115
- Flood insurance flood zone
- −$125 /mo · $1,502/yr
- HOA
- −$48
- Vacancy / Maint / Mgmt
- −$462
- Net cashflow
- $-237
Break-even live
UW: 25.0% down · 7.5% · 30yr · 1.5% tax · 5.0% vac · 8.0% maint · 8.0% mgmt
Financing live
Cash to close
- Down payment
- $68,725
- Closing costs
- $8,247
- Reserves months
- —
- Total cash needed
- —
Loan-product check · same deal, 3 products live
Conventional
25% down · 7.5% · 30yr
- Down + closing
- —
- Monthly P&I
- —
- Monthly cashflow
- —
- DSCR
- —
- Eligible?
- —
Personal DTI + credit; lowest rate.
DSCR
20% down · 8.5% · 30yr
- Down + closing
- —
- Monthly P&I
- —
- Monthly cashflow
- —
- DSCR
- —
- Eligible?
- —
No personal income docs; deal must DSCR.
Hard money
10% down · 12.0% · 12mo
- Down + closing
- —
- Monthly P&I
- —
- Monthly cashflow
- —
- DSCR
- —
- Eligible?
- —
Short-term bridge; refi at stabilization.
Rent comps 11 comps
| Address | Beds | Baths | Sqft | Rent | $/sqft | DOM | Units | Dist |
|---|---|---|---|---|---|---|---|---|
| 2353 Tallgrass Cir Bossier City, LA | 3.0 | 2.0 | 2007 | $2,350 | $1.17 | 21d | 1 | 0.31mi |
| 3461 Grand Cane Ln Bossier City, LA | 3.0 | 2.0 | 1297 | $2,100 | $1.62 | 13d | 1 | 0.53mi |
| 3283 Grand Lake Dr Bossier City, LA | 3.0 | 2.0 | 1302 | $1,950 | $1.50 | 21d | 1 | 0.55mi |
| 814 Abita Chase Bossier City, LA | 3.0 | 2.0 | 1881 | $2,300 | $1.22 | 13d | 1 | 0.65mi |
| 604 Labarre Ln Bossier City, LA | 4.0 | 2.5 | 2115 | $2,800 | $1.32 | 21d | 1 | 0.67mi |
| 619 Labarre Ln Bossier City, LA | 3.0 | 2.0 | 1987 | $2,400 | $1.21 | 21d | 1 | 0.75mi |
| 3055 Vanceville Rd Bossier City, LA | 2.0–3.0 | 2.0 | 1112 | $1,995 | $1.79 | 13d | 6 | 0.78mi |
| 3348 Grand Lake Dr Bossier City, LA | 3.0 | 2.0 | 1800 | $2,100 | $1.17 | 21d | 1 | 0.81mi |
| 217 Norwell Ln Bossier City, LA | 4.0 | 2.5 | 1851 | $2,400 | $1.30 | 21d | 1 | 1.14mi |
| 90 Kingston Xing Bossier City, LA | 1.0–3.0 | 1.0–2.0 | 1150 | $2,015 | $1.75 | 13d | 14 | 1.17mi |
| 606 Acacia Dr Bossier City, LA | 3.0 | 2.0 | 1765 | $2,200 | $1.25 | 21d | 1 | 1.44mi |
HOA detail
- Monthly dues
- $48 · $576/yr
Listing history 16 events
-
2026-06-18days on market $274,900 Active 40 DOM
-
2026-06-17days on market $274,900 Active 39 DOM
-
2026-06-16days on market $274,900 Active 38 DOM
-
2026-06-15days on market $274,900 Active 37 DOM
-
2026-06-14days on market $274,900 Active 35 DOM
-
2026-06-13days on market $274,900 Active 34 DOM
-
2026-06-10days on market $274,900 Active 32 DOM
-
2026-06-09days on market $274,900 Active 31 DOM
-
2026-06-08days on market $274,900 Active 30 DOM
-
2026-06-07pricedays on market $274,900 Active 29 DOM
-
2026-06-02days on market $279,000 Active 24 DOM
-
2026-06-01days on market $279,000 Active 23 DOM
-
2026-05-31days on market $279,000 Active 22 DOM
-
2026-05-30days on market $279,000 Active 21 DOM
-
2026-05-06$279,000 Active 1572-char remark
-
2006-05-04soldstatus $1,544,000
ⓘ Source: listings_history table (triggers on properties + properties_extension) + one-shot
backfill from property_details.listing_events for pre-trigger history.
Tax reassessment forecast LA · Resets to sale price
- Current annual tax
- $2,928 · $244/mo
- Projected year-2 tax
- $2,928 · $244/mo
- Expected delta
- $0/yr ($0/mo · 0.0%)
ⓘ Screening estimate from a state-policy table — verify with the county assessor before closing.
Climate risk First Street
- Flood 1/10 Low FEMA zone A · 0% chance over 30 yrs
- Wildfire 3/10 Moderate
- Heat 7/10 Severe 7 d/yr ≥110°F today · 22 d/yr by 30 yrs out
- Wind 6/10 Major 67% chance of damaging wind over 30 yrs
- Air quality 2/10 Low 1 unhealthy d/yr today · 1 by 30 yrs out
Nearby sold comps map
Loading sold comps map…
Walkable amenities ~0.75 mi
Loading nearby amenities…
Taxation est. · year 1
- Rental income
- $26,379
- − Mortgage interest
- −$15,399
- − Property taxes
- −$2,928
- − Insurance
- −$2,877
- − Repairs & maintenance
- −$2,110
- − Management
- −$2,110
- − HOA
- −$576
- − Depreciation
- −$7,997
- Taxable loss
- −$7,619
- Est. tax savings @ 24.0%
- +$1,829
- After-tax cash flow
- $-1,013/yr
For passive investors: Depreciation is non-cash, so a rental often shows a tax loss while cash-flowing — sheltering income. Rental losses are passive: they offset passive income freely, and up to $25,000/yr can offset ordinary (W-2) income if you actively participate and your MAGI is under $100k (phasing out to $0 by $150k); unused losses carry forward. On sale, claimed depreciation is recaptured at up to 25%, and gains may owe capital-gains tax (a 1031 exchange can defer both). Figures are a year-1 estimate at your 24.0% rate — not tax advice; consult a CPA.
Schools (NCES district)
- District
- Bossier Parish
- NCES district ID
- 2200270
- Math proficiency
- 40% ▼ -32.00%
- Reading proficiency
- 47% ▼ -28.00%
- Median HH income
- $51,326
- Composite
- 37.5/100
- National rank
- #4402
- State rank
- #17 of 98 in LA
Livability — Bossier City
- Score
- 71/100
- State rank
- #47
- US rank
- #7044
Category grades
Schools grade is shown separately in the Schools card above.
Census & demographics
- County
- Bossier Parish · 98,704 people
- City population
- 91,925
- Metro
- Shreveport-Bossier City, LA
- Population (ZIP)
- 43,925
- Household income
- $65,292
- Rent vs Own
- Severe rent burden
- 1942.0
Population outlook (Bossier County) Hauer SSP2
- Today (2025)
- 143,247 people
- By 2030
- 151,802 · +6.0%
- By 2040
- 168,194 · +17.4%
- By 2050
- 183,533 · +28.1%
- By 2075
- 217,009 · +51.5%
- By 2100
- 230,091 · +60.6%
Race, ethnicity, and origin ACS 2023
- Neighborhood character
- Diverse neighborhood (Simpson 0.60)
- Race & ethnicity
- White 56% Black 29% Hispanic / Latino 9% Two or more races 8% Asian 3%
- Hispanic origin (detail)
- Mexican 5%
- Common ancestry
- Lithuanian 2% Iranian 1% Slovak 1%
- Foreign-born
- 5% · Canada, Vietnam
- Languages at home
- 90% English-only · Spanish 7% Vietnamese 1% French/Haitian/Cajun 1%
Political lean MEDSL · Bossier
- 2024 margin
- Solid R (+43.3) · D 27.7% · R 71.0% · Other 1.3%
- 2008→2024 swing
- +0.3pp no change · 2008: -43.7pp · 2024: -43.3pp
- All cycles
- 2024: R+43.3 2020: R+41.0 2016: R+45.8 2012: R+45.4 2008: R+43.7
Not yet ingested
- Civics
- —
Market trends
- HPI YoY
- ▼ -79.78%
- Current HPI
- 149.4336
- Rent YoY
- ▲ 6.56%
- Metro
- Shreveport-Bossier City, LA
- State GDP YoY
- ▲ 3.29%
- F500 in state
- 10
Industry mix (Fortune 500 HQ in LA)
| Industry | F500 HQs | Revenue |
|---|---|---|
| Telecommunications | 2 | $23B |
|
||
| Utilities | 1 | $12B |
|
||
| Wholesale / Distribution | 1 | $5B |
|
||
| Advertising | 1 | $2B |
|
||
Price history
-82.2% since first listed3 events — show timeline
- 2026-06-05 Price Changed $274,900 NTREIS
- 2026-05-06 Listed $279,000 NTREIS
- 2006-05-04 Sold (Public Records) $1,544,000 Public Records
Property tax history
+7.0%/yrLatest (2025): $2,928 · -1.0% YoY. Source: county tax records.
Cash-flow waterfall
monthlySold comps — $/sqft
last 12 mo · ≤1 miLoading sold comps…