 Multi-family
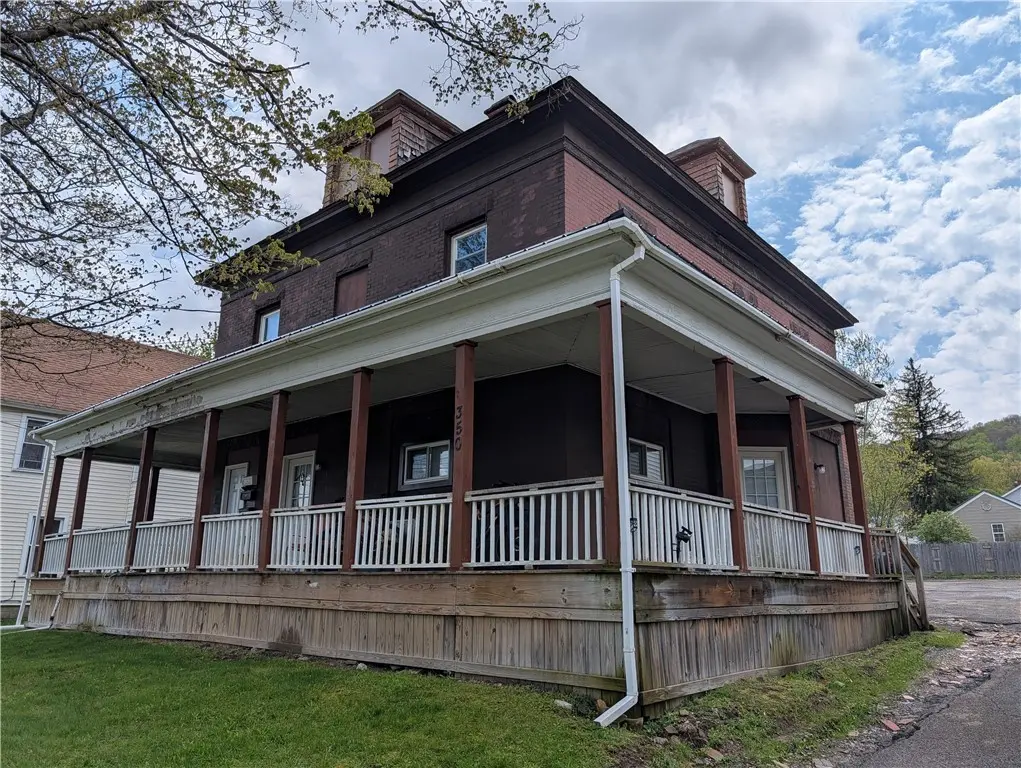
350 E Main St · Bradford, PA
Flood risk 1/10 · Minimal
- FEMA flood zone
- X (unshaded)
- Chance of flooding over 30 yrs
- 0.0%
- Est. flood insurance / yr
- $507 – $1,088
Fire risk 1/10 · Minimal
- Est. fire insurance / yr
- $511 – $949
Heat risk 2/10 · Minimal
- Hot days now (above 89°F)
- 8 days/yr
- Hot days in 30 yrs
- 18 days/yr
Wind risk 1/10 · Minimal
- Chance of severe wind over 30 yrs
- —
Air-quality risk 1/10 · Minimal
- Unhealthy air days now
- 0 days/yr
- Unhealthy air days in 30 yrs
- 0 days/yr
Risk factors via First Street. Map © Google.
Why this score? — see what drove the B grade
The composite is a weighted blend of 9 inputs, each scored 0–100. Each bar is that input's sub-score; the figure is the points it added to the 100-point composite (weight × sub-score).
- Cash flow +30.0/30.0
- 1% rule +10.0/10.0
- DSCR +10.0/10.0
- ARV discount +7.5/15.0
- Schools +4.2/10.0
- Condition / age +4.0/5.0
- Livability +3.5/5.0
- Rent growth +2.5/5.0
- Appreciation +0.0/10.0
$200,000
🖨 Deal sheet 📄 Offer letter ✓ Due diligence
Multi-family units
County records classify this as Multi-Family (2-4 Unit). Listing-text estimate: 1 unit. estimate disagrees with records
Listing remarks
This solid five-unit building delivers dependable cash flow and turnkey stability for any investor’s portfolio. The property features three one-bedroom apartments, one two-bedroom unit, and an efficiency apartment—each remodeled within the last few years to offer modern, attractive living spaces that keep tenants long-term. A newer roof, a brand-new boiler, and two new hot water tanks provide major mechanical peace of mind, while plumbing updates completed during renovations add even more value. The building is fully occupied and includes convenient on-site coin-operated laundry along with plenty of off-street parking—amenities that support tenant satisfaction and retentio
Key facts
- Two bedroom unit
- Efficiency apartment
- Newer roof
Tags
Property features AI
Finance
- Other: 4 total units; Single gas meter; Single electric meter
- Financial info: Operating expenses include electric, fuel, insurance, maintenance, trash, utilities, and water/sewer; Owner pays electricity, gas, heat, hot water, trash collection, and water; Rent (where applicable) includes electricity, heat, hot water, trash collection, and water
- HOA & community: Laundry facilities in the community
Exterior
- Parking: Three or more parking spaces
- Utilities: Public water connected; Sewer connected
- Home design: 2-story building; Existing property condition; Architectural shingle roof
- Construction: Brick and stone construction; Blown-in insulation and spray foam insulation; Architectural shingle roof
- Exterior features: Blacktop driveway; Gravel driveway; Irregular lot; Near public transit
Interior
- Kitchen: Electric oven and electric range; Gas oven and gas range; Refrigerator
- Flooring: Hardwood; Luxury vinyl; Vinyl; Varies
- Heating & cooling: Gas heating; Hot water heating
- Interior features: Hardwood and luxury vinyl flooring with some vinyl and varying floor types; Full basement
- Laundry & utility: Common area laundry facilities; Coin-operated laundry
Neighborhood map
What this means for you Summary
Snapshot
- This is a 4-bed/?-bath multifamily listed at $200k. Condition is rated good.
Deal economics
- At list price, monthly cash flow is $1k ($15k/yr) — positive.
- The deal already cash-flows at list — no discount required.
- Meets the 1% rule at list price ($3k rent vs $200k).
- Cap rate 13.9% vs local median 4.3% in Bradford — top-decile yield for the area; either an underpriced asset or a hidden risk that comps aren't pricing in. Stress-test before assuming the spread holds.
Location & tenants
- Location reads 69/100 on livability (#814 in PA) — a middle-class / working-renter tenant base. Strengths: cost of living A+, housing A+, health & safety A+; Watch: crime F, amenities F, commute F.
- Bradford Area SD (town): math 41% / reading 60% proficiency, ranked #187 of 539 in PA (top 35%) — acceptable for families but not a draw, mixed tenant base, ~2y average lease.
- Market conditions: 78 active listings in the ZIP; 29 units permitted in McKean County in 2024 (0 in 5+ unit buildings).
Forward outlook
- Local home prices are declining (-3.0%/yr); year-one equity from $1k of loan paydown is wiped out by about $6k of value loss. Plan a longer hold.
- McKean County population projected at -17% by 2050 — secular population decline; favor cash flow + early exit over multi-decade hold.
- At projected returns (-3.0% appreciation + 3.0% rent growth), your $56k cash investment doubles in ~5 years — after that, you're playing with house money.
Negotiation context
- Only 5 days on market — expect competitive offers; lowballing is unlikely to land.
- 2 sale attempts since 9y ago with the ask held roughly flat each time — persistent listings suggest the price (not the market) is what's stuck; bring a comps-based counter.
- Current owner paid $65k; list at $200k implies a 208% gain — meaningful room to come down on a strong offer.
Risks & watch-outs
- Watch-outs: built in 1920 — expect roof / HVAC / electrical / plumbing capex.
Questions for the listing agent
- Built in 1920 — when were the roof, HVAC, electrical panel, plumbing, and water heater last replaced?
- Is there a deadline driving the sale (1031 exchange, divorce, estate, relocation)? That informs how much negotiation room exists.
- Crime grade is F in this area — have there been break-ins, vandalism, or insurance claims at this property in the last 3 years? What carrier currently insures it and at what premium?
- What's the average days-on-market for RENTAL listings here right now (not sales)? A rising rental-DOM trend means longer vacancies and softer asking-rent achievability than the comps imply.
- What's the recent tenant-quality profile in this submarket — average credit score on applications, eviction rate, late-payment / NSF rate, and stable-employment percentage? A property-management company in the area should have these aggregated.
- How much new apartment / multifamily construction is in the pipeline within 1–3 miles? Heavy new supply (>2% of stock underway) typically softens rents 12–24 months out; light construction supports rent growth.
Investment metrics
- 1% rule
- 1.68% ✓
- Cap rate
- 13.91%
- Cash-on-cash
- 27.21%
- DSCR
- 2.21
- GRM
- 5.0
CMA / ARV
No comps found within radius.
Projected returns pro-forma
-3.0% appreciation · 3.0% rent growth · sell at horizon
- IRR
- 21.2%
- Equity multiple
- 1.87×
- Total profit
- $48,521
- Equity at exit
- $29,821
- IRR
- 29.3%
- Equity multiple
- 3.62×
- Total profit
- $146,602
- Equity at exit
- $17,292
Cash invested: $56,000 (down + closing). Projections, not guarantees.
Landlord ↔ Tenant lean methodology
- Overall (STATE)
- 62 Landlord-Friendly
- State Pennsylvania
- 62 Landlord-Friendly · EVEN
- County
- — inherits STATE
- City
- — inherits STATE
ZIP-level market 16701
- Home prices YoY
- -17.9%
- Active inventory
- 78
- Price-to-rent
- 25.0×
Monthly cashflow live
- Estimated rent
- $3,357 medium interval (Pro) →
- Mortgage (P&I)
- −$1,049
- Tax est. 1.5%
- −$250 /mo · $3,000/yr
- Insurance
- −$83
- HOA
- −$0
- Vacancy / Maint / Mgmt
- −$705
- Net cashflow
- $1,270
Break-even live
5-unit breakdown (identical units grouped — click to expand)
| Units | Beds | Baths | Est. rent |
|---|---|---|---|
| 4× units | 1 | 1 | $2,668 |
| #1 | 1 | 1 | $667 |
| #2 | 1 | 1 | $667 |
| #3 | 1 | 1 | $667 |
| #5 | 1 | 1 | $667 |
| 1× unit | 2 | 1 | $688 |
| Total (5 units) | $3,357 | ||
UW: 25.0% down · 7.5% · 30yr · 1.5% tax · 5.0% vac · 8.0% maint · 8.0% mgmt
Financing live
Cash to close
- Down payment
- $50,000
- Closing costs
- $6,000
- Reserves months
- —
- Total cash needed
- —
Loan-product check · same deal, 3 products live
Conventional
25% down · 7.5% · 30yr
- Down + closing
- —
- Monthly P&I
- —
- Monthly cashflow
- —
- DSCR
- —
- Eligible?
- —
Personal DTI + credit; lowest rate.
DSCR
20% down · 8.5% · 30yr
- Down + closing
- —
- Monthly P&I
- —
- Monthly cashflow
- —
- DSCR
- —
- Eligible?
- —
No personal income docs; deal must DSCR.
Hard money
10% down · 12.0% · 12mo
- Down + closing
- —
- Monthly P&I
- —
- Monthly cashflow
- —
- DSCR
- —
- Eligible?
- —
Short-term bridge; refi at stabilization.
Listing history 4 events
-
2026-05-13status Pending
-
2026-05-08$200,000 Active
-
2017-09-06soldstatus $65,000
-
2017-04-27$69,000
ⓘ Source: listings_history table (triggers on properties + properties_extension) + one-shot
backfill from property_details.listing_events for pre-trigger history.
Climate risk First Street
- Flood 1/10 Low FEMA zone X (unshaded) · 0% chance over 30 yrs
- Wildfire 1/10 Low
- Heat 2/10 Low 8 d/yr ≥89°F today · 18 d/yr by 30 yrs out
- Wind 1/10 Low
- Air quality 1/10 Low 0 unhealthy d/yr today · 0 by 30 yrs out
Nearby sold comps map
Loading sold comps map…
Walkable amenities ~0.75 mi
Loading nearby amenities…
Taxation est. · year 1
- Rental income
- $40,284
- − Mortgage interest
- −$11,203
- − Property taxes
- −$3,000
- − Insurance
- −$1,000
- − Repairs & maintenance
- −$3,223
- − Management
- −$3,223
- − Depreciation
- −$5,818
- Taxable income
- $12,817
- Est. tax owed @ 24.0%
- −$3,076
- After-tax cash flow
- $12,162/yr
For passive investors: Depreciation is non-cash, so a rental often shows a tax loss while cash-flowing — sheltering income. Rental losses are passive: they offset passive income freely, and up to $25,000/yr can offset ordinary (W-2) income if you actively participate and your MAGI is under $100k (phasing out to $0 by $150k); unused losses carry forward. On sale, claimed depreciation is recaptured at up to 25%, and gains may owe capital-gains tax (a 1031 exchange can defer both). Figures are a year-1 estimate at your 24.0% rate — not tax advice; consult a CPA.
Condition & rehab AI · 2 photos
This multi-family property is in good condition with recent renovations, offering a solid investment opportunity with potential for minor cosmetic improvements to enhance its curb appeal and value.
Value-add opportunities
- Both Painting the exterior — Enhances curb appeal and property value
- Both Landscaping the front yard — Improves curb appeal and enhances property value
- Both Reassessing the roof for any hidden damage — Ensures long-term structural integrity
Renovation cost estimate screening
Value-add ROI direction
- Both Painting the exterior — Enhances curb appeal and property value ↑
- Both Landscaping the front yard — Improves curb appeal and enhances property value ↑
- Both Reassessing the roof for any hidden damage — Ensures long-term structural integrity ↑
ⓘ Cost ranges are severity-bucket heuristics (US national rule-of-thumb). Get contractor quotes + a written scope before underwriting a rehab budget.
Schools (NCES district)
- District
- Bradford Area SD
- NCES district ID
- 4204020
- Math proficiency
- 41% ▼ -5.00%
- Reading proficiency
- 60% ▼ -4.00%
- Median HH income
- $41,477
- Composite
- 42.31/100
- National rank
- #3261
- State rank
- #187 of 539 in PA
Livability — Bradford
- Score
- 69/100
- State rank
- #814
- US rank
- #8325
Category grades
Schools grade is shown separately in the Schools card above.
Census & demographics
- Census place
- Bradford, PA
- Population (ZIP)
- 16,584
Population outlook (McKean County) Hauer SSP2
- Today (2025)
- 40,518 people
- By 2030
- 39,290 · -3.0%
- By 2040
- 36,438 · -10.1%
- By 2050
- 33,556 · -17.2%
- By 2075
- 27,682 · -31.7%
- By 2100
- 21,726 · -46.4%
Race, ethnicity, and origin ACS 2023
- Neighborhood character
- Predominantly White (93%)
- Race & ethnicity
- White 93% Two or more races 3% Hispanic / Latino 2% Black 1%
- Common ancestry
- Romanian 4% Slovak 2% Iranian 2%
- Foreign-born
- 2% · Canada, China
- Languages at home
- 97% English-only · Spanish 1%
Political lean MEDSL · McKean
- 2024 margin
- Solid R (+47.2) · D 26.0% · R 73.2%
- 2008→2024 swing
- -29.9pp toward R · 2008: -17.3pp · 2024: -47.2pp
- All cycles
- 2024: R+47.2 2020: R+46.2 2016: R+47.2 2012: R+28.2 2008: R+17.3
Not yet ingested
- Civics
- —
Market trends
- HPI YoY
- ▼ -32.54%
- Current HPI
- 149.3686
- Rent YoY
- —
- Metro
- —
- State GDP YoY
- ▲ 1.68%
- F500 in state
- 34
Industry mix (Fortune 500 HQ in PA)
| Industry | F500 HQs | Revenue |
|---|---|---|
| Healthcare | 2 | $309B |
|
||
| Insurance | 2 | $27B |
|
||
| Telecommunications / Media | 1 | $124B |
|
||
| Industrial Distribution | 1 | $22B |
|
||
| Financial Services | 1 | $20B |
|
||
| Chemicals / Materials | 1 | $18B |
|
||
Price history
+189.9% since first listed4 events — show timeline
- 2026-05-13 Pending — UNYREIS
- 2026-05-08 Listed $200,000 UNYREIS
- 2017-09-06 Sold (MLS) $65,000 UNYREIS
- 2017-04-27 Listed $69,000 UNYREIS
Cash-flow waterfall
monthlySold comps — $/sqft
last 12 mo · ≤1 miLoading sold comps…