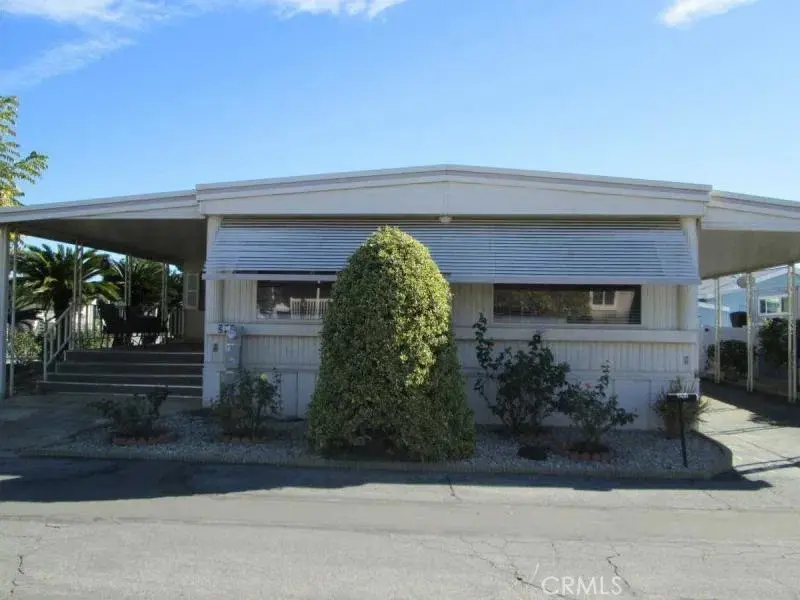
3530 Damien Ave #241 · La Verne, CA
Flood risk 4/10 · Minor
- FEMA flood zone
- X (unshaded)
- Chance of flooding over 30 yrs
- 0.22%
- Est. flood insurance / yr
- $507 – $1,088
Fire risk 8/10 · Major
- Est. fire insurance / yr
- $659 – $1,223
Heat risk 7/10 · Major
- Hot days now (above 98°F)
- 7 days/yr
- Hot days in 30 yrs
- 19 days/yr
Wind risk 1/10 · Minimal
- Chance of severe wind over 30 yrs
- —
Air-quality risk 8/10 · Major
- Unhealthy air days now
- 17 days/yr
- Unhealthy air days in 30 yrs
- 21 days/yr
Risk factors via First Street. Map © Google.
Why this score? — see what drove the A- grade
The composite is a weighted blend of 9 inputs, each scored 0–100. Each bar is that input's sub-score; the figure is the points it added to the 100-point composite (weight × sub-score).
- Cash flow +30.0/30.0
- ARV discount +15.0/15.0
- 1% rule +10.0/10.0
- DSCR +10.0/10.0
- Schools +5.9/10.0
- Livability +3.8/5.0
- Rent growth +3.1/5.0
- Condition / age +2.5/5.0
- Appreciation +0.0/10.0
$109,900
🖨 Deal sheet 📄 Offer letter ✓ Due diligence
Listing remarks MLS
Welcome to The Fountains 55+ Mobile Home Community located in La Verne. Priced to sell and full of potential! This approximately 1,440 sq. ft. home features 2 bedrooms and 2 bathrooms and is ready for your personal touch. The nicely sized living room flows into the dining area, which opens to the kitchen—creating a functional and inviting layout. The primary bedroom includes an adjoining bathroom, while the guest bedroom is conveniently located near the guest bathroom. A dedicated laundry room offers hook-ups for a full-size washer and dryer. Additional features include central air and heating. Bring your ideas and make this home your own!
Key facts
- Community pool
- Built 1970
- Listed 159 days
Neighborhood map
What this means for you Summary
Snapshot
- This is a 2-bed/2.0-bath manufactured listed at $110k.
Deal economics
- At list price, monthly cash flow is $2k ($20k/yr) — positive.
- The deal already cash-flows at list — no discount required.
- Meets the 1% rule at list price ($3k rent vs $110k).
- Recommended offer: $97k (12.0% below list) — sets the bar for market timing.
- Cap rate 24.3% vs local median 3.0% in La Verne — top-decile yield for the area; either an underpriced asset or a hidden risk that comps aren't pricing in. Stress-test before assuming the spread holds.
Location & tenants
- Location reads 75/100 on livability (#110 in CA, #3,858 nationally) — a middle-class / working-renter tenant base. Strengths: amenities A+, employment A+, commute A; Watch: cost of living F, health & safety F.
- Bonita Unified (suburban): math 59% / reading 70% proficiency, ranked #151 of 1,400 in CA (top 11%) — acceptable for families but not a draw, mixed tenant base, ~2y average lease.
- Market conditions: Rents rising (+2.4%/yr); 94 active listings in the ZIP; 20 comparable units currently listed for rent nearby; rentals at typical pace (median 25d on market — plan ~3-4 weeks tenant-placement turnaround); 45% of comp listings sitting > 30 days — soft ceiling on asking rent; solid renter incomes; 19,697 units permitted in Los Angeles County in 2024 (9,426 in 5+ unit buildings).
- This rent runs 35% of the median local income ($104k/yr) — at the standard rent-burdened threshold; future hikes will face affordability resistance.
Forward outlook
- Local home prices are declining (-3.0%/yr); year-one equity from $760 of loan paydown is wiped out by about $3k of value loss. Plan a longer hold.
- Los Angeles County population projected at +9% by 2050 — modest demand growth; plan on rents tracking national, not racing it.
- At projected returns (-3.0% appreciation + 2.4% rent growth), your $31k cash investment doubles in ~2 years — after that, you're playing with house money.
Negotiation context
- It's been on market 160 days — a 12% lower offer ($97k) is reasonable based on typical stale-listing flexibility.
- 2 sale attempts since 15y ago; this cycle's ask has dropped $40k (27%) from the opening price — seller is motivated, your offer sets the floor, not the list.
Risks & watch-outs
- Climate carrying-cost: severe wildfire risk; extreme-heat days projected 7→19/yr by 2055 (HVAC capex compounding) — expect insurance premiums to compound above CPI over the hold.
Questions for the listing agent
- It's been on market 160 days. Have you received any prior offers? Is the seller open to a 12% concession, seller financing, or rate buy-down credit?
- Built in 1970 — when were the roof, HVAC, electrical panel, plumbing, and water heater last replaced?
- Why hasn't it sold? Are there any deal-killer items the seller is aware of (foundation, flood, title, zoning, code violations)?
- Is there a deadline driving the sale (1031 exchange, divorce, estate, relocation)? That informs how much negotiation room exists.
- Schools are A-rated — typically a magnet for longer-tenancy family renters. What's the average tenant stay here, and is there a school-zone premium baked into asking?
- What's the average days-on-market for RENTAL listings here right now (not sales)? A rising rental-DOM trend means longer vacancies and softer asking-rent achievability than the comps imply.
- What's the recent tenant-quality profile in this submarket — average credit score on applications, eviction rate, late-payment / NSF rate, and stable-employment percentage? A property-management company in the area should have these aggregated.
- How much new for-sale + rental construction is in the pipeline within 1–3 miles? Heavy new supply typically softens prices + rents 12–24 months out; constrained supply supports both.
Investment metrics
- 1% rule
- 2.77% ✓
- Cap rate
- 24.28%
- Cash-on-cash
- 64.24%
- DSCR
- 3.86
- GRM
- 3.0
CMA / ARV
- ARV (median comp)
- $192,251
- List price
- $109,900
- Delta
- -42.84%
- Verdict
- UNDERPRICED
- Comps
- 20 within 1.0 mi
Show comp detail 12 sales within ~0.75 mi
| Address | Dist | Beds/Ba | Sqft | Sold | Price | $/sf | Match |
|---|---|---|---|---|---|---|---|
| 3620 Moreno Ave #64 | 0.12mi | 3/2.0 (+1) | 1,440 (0%) | 1mo | $255,000 | $177 | 88 |
| 3620 Moreno # 47 | 0.23mi | 2/2.0 | 1,440 (0%) | 2mo | $227,000 | $158 | 88 |
| 3530 Damien Ave #88 | 0.18mi | 2/2.0 | 1,440 (0%) | 7mo | $91,000 | $63 | 86 |
| 3620 Moreno Ave #139 | 0.12mi | 2/2.0 | 1,440 (0%) | 12mo | $163,000 | $113 | 84 |
| 3530 Damien #176 | 0.18mi | 3/2.0 (+1) | 1,434 (-0%) | 2mo | $240,000 | $167 | 84 |
| 3620 Moreno Ave #127 | 0.12mi | 2/2.0 | 1,440 (0%) | 14mo | $200,000 | $139 | 83 |
| 3530 Damien Ave #44 | 0.03mi | 2/2.0 | 1,594 (+11%) | 1mo | $249,900 | $157 | 80 |
| 3530 Damien #83 | 0.18mi | 3/2.0 (+1) | 1,480 (+3%) | 4mo | $242,000 | $164 | 79 |
| 3530 Damien #202 | 0.18mi | 2/2.0 | 1,344 (-7%) | 6mo | $192,000 | $143 | 76 |
| 3530 Damien Ave #109 | 0.03mi | 3/2.0 (+1) | 1,610 (+12%) | 5mo | $260,000 | $161 | 70 |
| 3530 Damien Ave #194 | 0.01mi | 3/2.0 (+1) | 1,620 (+12%) | 12mo | $250,000 | $154 | 63 |
| 3530 Damien Ave #152 | 0.18mi | 3/2.0 (+1) | 1,248 (-13%) | 8mo | $192,000 | $154 | 58 |
Match score weights: distance 35% · size 25% · config 20% · recency 20%. Top-matched comps best support the ARV.
Projected returns pro-forma
-3.0% appreciation · 2.35% rent growth · sell at horizon
- IRR
- 62.6%
- Equity multiple
- 3.77×
- Total profit
- $85,177
- Equity at exit
- $16,386
- IRR
- 66.9%
- Equity multiple
- 7.55×
- Total profit
- $201,439
- Equity at exit
- $9,502
Cash invested: $30,772 (down + closing). Projections, not guarantees.
Landlord ↔ Tenant lean methodology
- Overall (STATE)
- 18 Strongly Tenant-Friendly
- State California
- 18 Strongly Tenant-Friendly · D+13
- County
- — inherits STATE
- City
- — inherits STATE
ZIP-level market 91750
- Rents YoY
- 2.4%
- Active inventory
- 94
- Price-to-rent
- 3.0×
Monthly cashflow live
- Estimated rent
- $3,047 high interval (Pro) →
- Mortgage (P&I)
- −$576
- Tax est. 1.5%
- −$137 /mo · $1,648/yr
- Insurance
- −$46
- HOA
- −$0
- Vacancy / Maint / Mgmt
- −$640
- Net cashflow
- $1,647
Break-even live
UW: 25.0% down · 7.5% · 30yr · 1.5% tax · 5.0% vac · 8.0% maint · 8.0% mgmt
Financing live
Cash to close
- Down payment
- $27,475
- Closing costs
- $3,297
- Reserves months
- —
- Total cash needed
- —
Loan-product check · same deal, 3 products live
Conventional
25% down · 7.5% · 30yr
- Down + closing
- —
- Monthly P&I
- —
- Monthly cashflow
- —
- DSCR
- —
- Eligible?
- —
Personal DTI + credit; lowest rate.
DSCR
20% down · 8.5% · 30yr
- Down + closing
- —
- Monthly P&I
- —
- Monthly cashflow
- —
- DSCR
- —
- Eligible?
- —
No personal income docs; deal must DSCR.
Hard money
10% down · 12.0% · 12mo
- Down + closing
- —
- Monthly P&I
- —
- Monthly cashflow
- —
- DSCR
- —
- Eligible?
- —
Short-term bridge; refi at stabilization.
Rent comps 20 comps
| Address | Beds | Baths | Sqft | Rent | $/sqft | DOM | Units | Dist |
|---|---|---|---|---|---|---|---|---|
| 3807 Abbey Way La Verne, CA | 3.0 | 2.0 | 1159 | $3,150 | $2.72 | 43d | 1 | 0.57mi |
| 1623 Heather Dr La Verne, CA | 3.0 | 1.5 | 1121 | $3,250 | $2.90 | 18d | 1 | 0.60mi |
| 637 E Gaillard St San Dimas, CA | 3.0 | 2.0 | 1324 | $3,500 | $2.64 | 43d | 1 | 0.66mi |
| 1825 Foothill Blvd La Verne, CA | 1.0–2.0 | 1.0–2.0 | 878 | $2,861 | $3.26 | 1d | 15 | 0.77mi |
| 836 Maria Ave Unit 836 La Verne, CA | 2.0 | 1.5 | 1200 | $2,675 | $2.23 | 43d | 1 | 0.79mi |
| 834 Maria Ave Unit 834 La Verne, CA | 2.0 | 1.5 | 1200 | $2,700 | $2.25 | 43d | 1 | 0.79mi |
| 2411 Pattiglen Ave Unit 2409 La Verne, CA | 2.0 | 2.0 | 960 | $2,595 | $2.70 | 17d | 1 | 0.83mi |
| 205 N San Dimas Canyon Rd San Dimas, CA | 2.0 | 1.0–2.5 | 994 | $3,875 | $3.90 | 1d | 1 | 0.91mi |
| 2002 Canopy Ln La Verne, CA | 3.0 | 3.0 | 1759 | $3,450 | $1.96 | 44d | 1 | 0.92mi |
| 923 Lotus Cir San Dimas, CA | 2.0 | 2.0 | 1187 | $3,200 | $2.70 | 24d | 1 | 0.93mi |
| 2132 Blossom Ln La Verne, CA | 1.0–2.0 | 1.0 | 729 | $2,380 | $3.26 | 2d | 3 | 0.99mi |
| 2063 Evergreen St La Verne, CA | 3.0 | 2.0 | 1300 | $3,200 | $2.46 | 43d | 1 | 1.02mi |
| 2064 Evergreen St La Verne, CA | 2.0 | 2.0 | 960 | $2,400 | $2.50 | 17d | 1 | 1.03mi |
| 477 E Bonita Ave San Dimas, CA | 3.0 | 1.0 | 950 | $2,325 | $2.45 | 2d | 1 | 1.14mi |
| 325 S San Dimas Canyon Rd San Dimas, CA | 4.0 | 1.0–2.0 | 1036 | $2,465 | $2.38 | 4d | 1 | 1.14mi |
| 3748 Verdana Cir La Verne, CA | 3.0 | 3.0 | 1493 | $4,500 | $3.01 | 15d | 1 | 1.25mi |
| 3836 Verdana Cir La Verne, CA | 2.0 | 2.5 | 1243 | $3,500 | $2.82 | 43d | 1 | 1.28mi |
| 168 E Baseline Rd San Dimas, CA | 3.0 | 2.5 | 1366 | $3,000 | $2.20 | 43d | 1 | 1.30mi |
| 3816 Verdana Cir La Verne, CA | 2.0 | 2.5 | 1243 | $3,300 | $2.65 | 18d | 1 | 1.33mi |
| 2013 Walnut St Unit B La Verne, CA | 2.0 | 1.0 | 900 | $2,800 | $3.11 | 43d | 1 | 1.46mi |
Listing history 18 events
-
2026-06-18days on market $109,900 Active 160 DOM
-
2026-06-17days on market $109,900 Active 159 DOM
-
2026-06-16days on market $109,900 Active 158 DOM
-
2026-06-15days on market $109,900 Active 157 DOM
-
2026-06-13days on market $109,900 Active 155 DOM
-
2026-06-13days on market $109,900 Active 154 DOM
-
2026-06-09days on market $109,900 Active 151 DOM
-
2026-06-08days on market $109,900 Active 150 DOM
-
2026-06-07days on market $109,900 Active 149 DOM
-
2026-06-04days on market $109,900 Active 146 DOM
-
2026-06-03days on market $109,900 Active 145 DOM
-
2026-06-02days on market $109,900 Active 144 DOM
-
2026-06-01days on market $109,900 Active 143 DOM
-
2026-05-31days on market $109,900 Active 142 DOM
-
2026-04-15price $129,900 653-char remark
Show marketing remark (653 chars)
Welcome to The Fountains 55+ Mobile Home Community located in La Verne. Priced to sell and full of potential! This approximately 1,440 sq. ft. home features 2 bedrooms and 2 bathrooms and is ready for your personal touch. The nicely sized living room flows into the dining area, which opens to the kitchen—creating a functional and inviting layout. The primary bedroom includes an adjoining bathroom, while the guest bedroom is conveniently located near the guest bathroom. A dedicated laundry room offers hook-ups for a full-size washer and dryer. Additional features include central air and heating. Bring your ideas and make this home your own!
-
2026-01-09$149,900 Active 653-char remark
Show marketing remark (653 chars)
Welcome to The Fountains 55+ Mobile Home Community located in La Verne. Priced to sell and full of potential! This approximately 1,440 sq. ft. home features 2 bedrooms and 2 bathrooms and is ready for your personal touch. The nicely sized living room flows into the dining area, which opens to the kitchen—creating a functional and inviting layout. The primary bedroom includes an adjoining bathroom, while the guest bedroom is conveniently located near the guest bathroom. A dedicated laundry room offers hook-ups for a full-size washer and dryer. Additional features include central air and heating. Bring your ideas and make this home your own!
-
2011-11-03historical Hold
-
2011-07-19$32,900 Active
ⓘ Source: listings_history table (triggers on properties + properties_extension) + one-shot
backfill from property_details.listing_events for pre-trigger history.
Climate risk First Street
- Flood 4/10 Moderate FEMA zone X (unshaded) · 22% chance over 30 yrs
- Wildfire 8/10 Severe
- Heat 7/10 Severe 7 d/yr ≥98°F today · 19 d/yr by 30 yrs out
- Wind 1/10 Low
- Air quality 8/10 Severe 17 unhealthy d/yr today · 21 by 30 yrs out
Nearby sold comps map
Loading sold comps map…
Walkable amenities ~0.75 mi
Loading nearby amenities…
Taxation est. · year 1
- Rental income
- $36,559
- − Mortgage interest
- −$6,156
- − Property taxes
- −$1,648
- − Insurance
- −$550
- − Repairs & maintenance
- −$2,925
- − Management
- −$2,925
- − Depreciation
- −$3,197
- Taxable income
- $19,159
- Est. tax owed @ 24.0%
- −$4,598
- After-tax cash flow
- $15,170/yr
For passive investors: Depreciation is non-cash, so a rental often shows a tax loss while cash-flowing — sheltering income. Rental losses are passive: they offset passive income freely, and up to $25,000/yr can offset ordinary (W-2) income if you actively participate and your MAGI is under $100k (phasing out to $0 by $150k); unused losses carry forward. On sale, claimed depreciation is recaptured at up to 25%, and gains may owe capital-gains tax (a 1031 exchange can defer both). Figures are a year-1 estimate at your 24.0% rate — not tax advice; consult a CPA.
Schools (NCES district)
- District
- Bonita Unified
- NCES district ID
- 0605610
- Math proficiency
- 59% ▲ 3.00%
- Reading proficiency
- 70% ▬ 0.00%
- Median HH income
- $76,196
- Composite
- 58.71/100
- National rank
- #2001
- State rank
- #151 of 1400 in CA
Livability — La Verne
- Score
- 75/100
- State rank
- #110
- US rank
- #3858
Category grades
Schools grade is shown separately in the Schools card above.
Census & demographics
- Census place
- La Verne, CA
- County
- Los Angeles County · 9,444,647 people
- City population
- 32,692
- Metro
- Los Angeles-Long Beach-Anaheim, CA
- Population (ZIP)
- 32,692
- Household income
- $104,195
- Rent vs Own
- Severe rent burden
- 872.0
Population outlook (Los Angeles County) Hauer SSP2
- Today (2025)
- 10,940,515 people
- By 2030
- 11,256,481 · +2.9%
- By 2040
- 11,729,929 · +7.2%
- By 2050
- 11,948,407 · +9.2%
- By 2075
- 11,818,114 · +8.0%
- By 2100
- 10,842,928 · -0.9%
Race, ethnicity, and origin ACS 2023
- Neighborhood character
- Diverse neighborhood (Simpson 0.67)
- Race & ethnicity
- White 44% Hispanic / Latino 36% Two or more races 20% Asian 10% Black 4%
- Hispanic origin (detail)
- Mexican 31%
- Common ancestry
- Lithuanian 3% Slovak 2% Romanian 1%
- Foreign-born
- 17% · Canada, China, South Korea
- Languages at home
- 75% English-only · Spanish 12% Chinese 3% Other Indo-European 3%
Political lean MEDSL · Los Angeles
- 2024 margin
- Solid D (+32.9) · D 64.8% · R 31.9% · Other 3.3%
- 2008→2024 swing
- -7.4pp toward R · 2008: 40.4pp · 2024: 32.9pp
- All cycles
- 2024: D+32.9 2020: D+44.2 2016: D+48.0 2012: D+40.0 2008: D+40.4
Not yet ingested
- Civics
- —
Market trends
- HPI YoY
- ▼ -729.79%
- Current HPI
- 373.7761
- Rent YoY
- ▲ 2.35%
- Metro
- Los Angeles-Long Beach-Anaheim, CA
- State GDP YoY
- ▲ 3.21%
- F500 in state
- 116
Industry mix (Fortune 500 HQ in CA)
| Industry | F500 HQs | Revenue |
|---|---|---|
| Technology | 27 | $1,492B |
|
||
| Financial Services | 3 | $174B |
|
||
| Retail | 3 | $44B |
|
||
| Insurance | 3 | $26B |
|
||
| Media / Entertainment | 2 | $115B |
|
||
| Pharmaceuticals / Biotech | 2 | $62B |
|
||
Price history
+294.8% since first listed4 events — show timeline
- 2026-04-15 Price Changed $129,900 CRMLS
- 2026-01-09 Listed $149,900 CRMLS
- 2011-11-03 Delisted — CRMLS
- 2011-07-19 Listed $32,900 CRMLS
Cash-flow waterfall
monthlySold comps — $/sqft
last 12 mo · ≤1 miLoading sold comps…