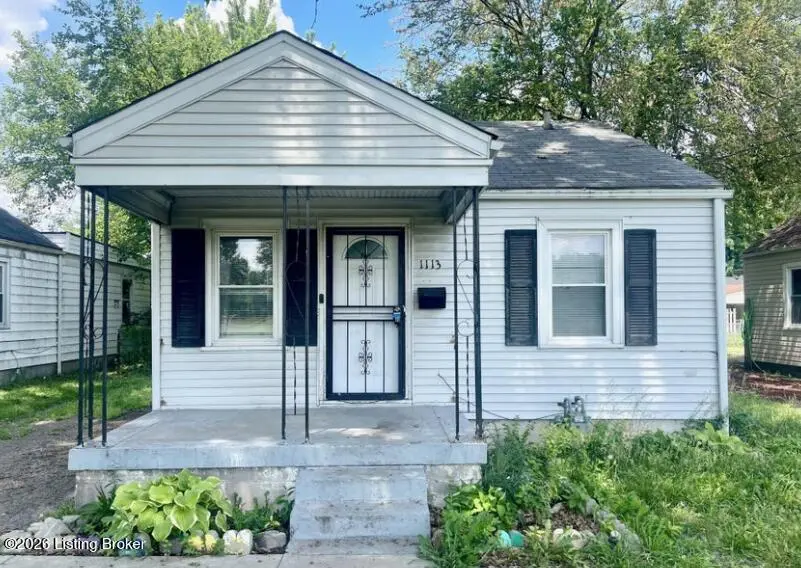
1113 Beecher St · Louisville, KY
Flood risk 7/10 · Major
- FEMA flood zone
- X (unshaded)
- Chance of flooding over 30 yrs
- 0.76%
- Est. flood insurance / yr
- $507 – $1,088
Fire risk 1/10 · Minimal
- Est. fire insurance / yr
- $839 – $1,559
Heat risk 5/10 · Moderate
- Hot days now (above 104°F)
- 7 days/yr
- Hot days in 30 yrs
- 19 days/yr
Wind risk 2/10 · Minimal
- Chance of severe wind over 30 yrs
- 1.0%
Air-quality risk 2/10 · Minimal
- Unhealthy air days now
- 1 days/yr
- Unhealthy air days in 30 yrs
- 3 days/yr
Risk factors via First Street. Map © Google.
Why this score? — see what drove the B grade
The composite is a weighted blend of 9 inputs, each scored 0–100. Each bar is that input's sub-score; the figure is the points it added to the 100-point composite (weight × sub-score).
- Cash flow +27.6/30.0
- ARV discount +15.0/15.0
- DSCR +9.7/10.0
- 1% rule +6.9/10.0
- Rent growth +3.8/5.0
- Livability +3.2/5.0
- Condition / age +2.5/5.0
- Schools +2.3/10.0
- Appreciation +0.0/10.0
$89,900
🖨 Deal sheet 📄 Offer letter ✓ Due diligence
Listing remarks MLS
Centrally located in the Oak Park Subdivision, investors take notice! Currently rented to long term tenants. This home is primed and ready for those looking for secondary income! Within walking distance of restaurants, shopping and the newly updated Wyandotte Park, this home is a perfect fit for any investment portfolio. You'll love the covered front porch, good sized backyard, 2 bedrooms, bath, eat-in-kitchen and separate laundry. Easy maintenance, hardwood flooring in bedrooms and living room. Minutes from Churchill Downs, University of Louisville and Papa Johns Stadium. Motivated Seller, all offers will be considered! Call today for your private viewing!
Key facts
- Updated furnace
- Hardwood floors
- 4,905 sq ft lot
Tags
Property features AI
Finance
- HOA & community: No association fee
Exterior
- Parking: Driveway
- Utilities: Electricity connected; Natural gas available; One HVAC unit
- Home design: Single-family ranch home; One story
- Construction: Built in 1947; Wood frame construction; Shingle roof; Crawl space foundation
- Exterior features: Sidewalk
Interior
- Kitchen: Kitchen on the first floor
- Bedrooms: Two bedrooms, both on the first floor
- Bathrooms: One full bathroom on the first floor
- Heating & cooling: Forced air heating (natural gas); Central air conditioning
- Interior features: Four total rooms; Living room on the first floor; First-floor laundry
- Laundry & utility: First-floor laundry
Neighborhood map
What this means for you Summary
Snapshot
- This is a 2-bed/1.0-bath single-family listed at $90k.
Deal economics
- At list price, monthly cash flow is $202 ($2k/yr) — positive.
- The deal already cash-flows at list — no discount required.
- Meets the 1% rule at list price ($1k rent vs $90k).
- Recommended offer: $87k (3.0% below list) — sets the bar for market timing.
- Cap rate 9.9% vs local median 5.0% in Louisville — top-decile yield for the area; either an underpriced asset or a hidden risk that comps aren't pricing in. Stress-test before assuming the spread holds.
Location & tenants
- Location reads 63/100 on livability (#333 in KY) — a middle-class / working-renter tenant base. Strengths: cost of living A+, housing A+; Watch: employment C-, health & safety D+, schools D-.
- Jefferson County (urban): math 19% / reading 35% proficiency, ranked #121 of 165 in KY (top 73%) — low school quality limits family demand, transient renter base, plan for 1-2y turnover.
- Market conditions: Rents rising fast (+5.2%/yr); 121 active listings in the ZIP; 22 comparable units currently listed for rent nearby; rentals at typical pace (median 16d on market — plan ~3-4 weeks tenant-placement turnaround); lower-income renter base — watch delinquency; 2,836 units permitted in Jefferson County in 2024 (1,558 in 5+ unit buildings).
Forward outlook
- Local home prices are declining (-3.0%/yr); year-one equity from $622 of loan paydown is wiped out by about $3k of value loss. Plan a longer hold.
- Jefferson County population projected at +13% by 2050 — modest demand growth; plan on rents tracking national, not racing it.
- At projected returns (-3.0% appreciation + 5.2% rent growth), your $25k cash investment doubles in ~9 years — after that, you're playing with house money.
Negotiation context
- It's been on market 35 days — a 3% lower offer ($87k) is reasonable based on typical stale-listing flexibility.
- 10 sale attempts since 24y ago with the ask held roughly flat each time — persistent listings suggest the price (not the market) is what's stuck; bring a comps-based counter.
- Current owner paid $49k; list at $90k implies a 83% gain — meaningful room to come down on a strong offer.
Risks & watch-outs
- Watch-outs: flood insurance adds $66/mo; built in 1947 — expect roof / HVAC / electrical / plumbing capex.
- Climate carrying-cost: major flood risk; extreme-heat days projected 7→19/yr by 2055 (HVAC capex compounding) — expect insurance premiums to compound above CPI over the hold.
Questions for the listing agent
- It's been on market 35 days. Have you received any prior offers? Is the seller open to a 3% concession, seller financing, or rate buy-down credit?
- Built in 1947 — when were the roof, HVAC, electrical panel, plumbing, and water heater last replaced?
- What's the actual annual flood-insurance premium (NFIP or private), and is the property in a SFHA with mandatory coverage?
- Is there a deadline driving the sale (1031 exchange, divorce, estate, relocation)? That informs how much negotiation room exists.
- Schools are D-rated, which usually means shorter tenancies and higher turnover. Who's the typical renter profile here, and what's been the actual vacancy rate?
- Crime grade is F in this area — have there been break-ins, vandalism, or insurance claims at this property in the last 3 years? What carrier currently insures it and at what premium?
- What's the average days-on-market for RENTAL listings here right now (not sales)? A rising rental-DOM trend means longer vacancies and softer asking-rent achievability than the comps imply.
- What's the recent tenant-quality profile in this submarket — average credit score on applications, eviction rate, late-payment / NSF rate, and stable-employment percentage? A property-management company in the area should have these aggregated.
- How much new for-sale + rental construction is in the pipeline within 1–3 miles? Heavy new supply typically softens prices + rents 12–24 months out; constrained supply supports both.
Investment metrics
- 1% rule
- 1.19% ✓
- Cap rate
- 9.87%
- Cash-on-cash
- 12.79%
- DSCR
- 1.57
- GRM
- 7.0
CMA / ARV
- ARV (on-the-fly)
- $128,148
- Comps found
- 12
Show comp detail 12 sales within ~0.75 mi
| Address | Dist | Beds/Ba | Sqft | Sold | Price | $/sf | Match |
|---|---|---|---|---|---|---|---|
| 1118 W Whitney Ave | 0.08mi | 3/1.0 (+1) | 771 (+9%) | 3mo | $120,000 | $156 | 74 |
| 4007 Mapleton Ave | 0.45mi | 2/1.0 | 743 (+5%) | 2mo | $151,000 | $203 | 70 |
| 3813 Powell Ave | 0.65mi | 2/1.0 | 706 (-0%) | 2mo | $145,000 | $205 | 67 |
| 4607 Picadilly Ave | 0.61mi | 2/1.0 | 672 (-5%) | 1mo | $117,000 | $174 | 62 |
| 3420 Powell Ave | 0.72mi | 2/1.0 | 720 (+2%) | 2mo | $137,500 | $191 | 62 |
| 3723 Center St | 0.37mi | 2/1.0 | 625 (-12%) | 3mo | $95,500 | $153 | 60 |
| 621 Beecher St | 0.44mi | 2/1.0 | 785 (+11%) | 2mo | $165,000 | $210 | 60 |
| 715 W Evelyn Ave | 0.59mi | 2/1.0 | 780 (+10%) | 1mo | $130,800 | $168 | 54 |
| 4000 Woodruff Ave | 0.48mi | 2/1.0 | 810 (+14%) | 3mo | $147,000 | $181 | 51 |
| 1510 Clara Ave | 0.65mi | 2/1.0 | 793 (+12%) | 1mo | $136,000 | $172 | 49 |
| 4612 Bellevue Ave | 0.57mi | 2/1.0 | 806 (+14%) | 3mo | $200,000 | $248 | 48 |
| 1525 Sale Ave | 0.64mi | 2/1.0 | 808 (+14%) | 4mo | $105,000 | $130 | 44 |
Match score weights: distance 35% · size 25% · config 20% · recency 20%. Top-matched comps best support the ARV.
Projected returns pro-forma
-3.0% appreciation · 5.16% rent growth · sell at horizon
- IRR
- 0.7%
- Equity multiple
- 1.03×
- Total profit
- $681
- Equity at exit
- $13,404
- IRR
- 12.5%
- Equity multiple
- 2.09×
- Total profit
- $27,417
- Equity at exit
- $7,773
Cash invested: $25,172 (down + closing). Projections, not guarantees.
Landlord ↔ Tenant lean methodology
- Overall (STATE)
- 83 Strongly Landlord-Friendly
- State Kentucky
- 83 Strongly Landlord-Friendly · R+16
- County
- — inherits STATE
- City
- — inherits STATE
ZIP-level market 40215
- Home prices YoY
- -34.4%
- Rents YoY
- 5.2%
- Active inventory
- 121
- Price-to-rent
- 7.0×
Monthly cashflow live
- Estimated rent
- $1,067 high interval (Pro) →
- Mortgage (P&I)
- −$471
- Tax from tax record
- −$66 /mo · $790/yr
- Insurance
- −$37
- Flood insurance flood zone
- −$66 /mo · $798/yr
- HOA
- −$0
- Vacancy / Maint / Mgmt
- −$224
- Net cashflow
- $202
Break-even live
UW: 25.0% down · 7.5% · 30yr · 1.5% tax · 5.0% vac · 8.0% maint · 8.0% mgmt
Financing live
Cash to close
- Down payment
- $22,475
- Closing costs
- $2,697
- Reserves months
- —
- Total cash needed
- —
Loan-product check · same deal, 3 products live
Conventional
25% down · 7.5% · 30yr
- Down + closing
- —
- Monthly P&I
- —
- Monthly cashflow
- —
- DSCR
- —
- Eligible?
- —
Personal DTI + credit; lowest rate.
DSCR
20% down · 8.5% · 30yr
- Down + closing
- —
- Monthly P&I
- —
- Monthly cashflow
- —
- DSCR
- —
- Eligible?
- —
No personal income docs; deal must DSCR.
Hard money
10% down · 12.0% · 12mo
- Down + closing
- —
- Monthly P&I
- —
- Monthly cashflow
- —
- DSCR
- —
- Eligible?
- —
Short-term bridge; refi at stabilization.
Rent comps 22 comps
| Address | Beds | Baths | Sqft | Rent | $/sqft | DOM | Units | Dist |
|---|---|---|---|---|---|---|---|---|
| 1105 Beecher St Louisville, KY | 2.0 | 1.0 | 708 | $1,150 | $1.62 | 16d | 1 | 0.01mi |
| 1022 Stanley Ave Louisville, KY | 2.0 | 1.0 | 700 | $1,200 | $1.71 | 21d | 1 | 0.23mi |
| 1111 Dresden Ave Louisville, KY | 2.0 | 1.0 | 680 | $1,100 | $1.62 | 16d | 1 | 0.36mi |
| 554 Camden Ave Louisville, KY | 1.0 | 1.0 | 661 | $875 | $1.32 | 23d | 1 | 0.48mi |
| 623 Dresden Ave Louisville, KY | 2.0 | 1.0 | 750 | $975 | $1.30 | 16d | 1 | 0.61mi |
| 4501 S 6th St #82 Louisville, KY | 1.0 | 1.0 | 538 | $775 | $1.44 | 17d | 1 | 0.63mi |
| 4012 Southern Pkwy Unit 5 Louisville, KY | 1.0 | 1.0 | 600 | $795 | $1.32 | 23d | 1 | 0.74mi |
| 4012 Southern Pkwy Unit 8 Louisville, KY | 1.0 | 1.0 | 600 | $795 | $1.32 | 14d | 1 | 0.74mi |
| 309 W Whitney Ave Louisville, KY | 1.0 | 1.0 | 700 | $875 | $1.25 | 23d | 1 | 0.80mi |
| 1709 Valley Forge Way Unit 2 Louisville, KY | 2.0 | 1.0 | 750 | $895 | $1.19 | 21d | 1 | 0.83mi |
| 4122 Craig Ave Louisville, KY | 2.0 | 1.0 | 705 | $1,051 | $1.49 | 11d | 1 | 0.84mi |
| 3524 Georgetown Cir Louisville, KY | 1.0–3.0 | 1.0 | 684 | $1,108 | $1.62 | 23d | 2 | 0.89mi |
| 3524 Georgetown Cir Louisville, KY | 1.0–3.0 | 1.0 | 684 | $1,108 | $1.62 | 14d | 4 | 0.89mi |
| 3524 Georgetown Cir Unit 3522-1 Louisville, KY | 1.0 | 1.0 | 482 | $865 | $1.79 | 3d | 1 | 0.89mi |
| 3524 Georgetown Cir Louisville, KY | 2.0 | 1.0 | 734 | $1,050 | $1.43 | 3d | 1 | 0.89mi |
| 4626 Southern Pkwy Louisville, KY | 1.0–2.0 | 1.0 | 809 | $895 | $1.11 | 14d | 3 | 0.89mi |
| 4704 Southern Pkwy Unit A1 Louisville, KY | 1.0 | 1.0 | 750 | $775 | $1.03 | 17d | 1 | 0.92mi |
| 4619 Southern Pkwy Unit 3 Louisville, KY | 1.0 | 1.0 | 700 | $975 | $1.39 | 2d | 1 | 0.94mi |
| 1122 Larchmont Ave Unit B Louisville, KY | 1.0 | 1.0 | 700 | $750 | $1.07 | 17d | 1 | 1.01mi |
| 4228 Allmond Ave Unit 2 Louisville, KY | 1.0 | 1.0 | 650 | $700 | $1.08 | 3d | 1 | 1.14mi |
| 1637 Thornberry Ave Louisville, KY | 2.0 | 1.0 | 700 | $1,250 | $1.79 | 3d | 1 | 1.31mi |
| 2805 S 4th St #1 Louisville, KY | 1.0 | 1.0 | 750 | $725 | $0.97 | 21d | 1 | 1.42mi |
Listing history 32 events
-
2026-05-09historical Active Under Contract
-
2026-04-24$89,900 Active
-
2026-02-05historical $895
-
2026-02-03price $895
-
2025-11-08price $995
-
2025-10-17$1,050
-
2024-08-07historical $995
-
2024-07-12price $995
-
2024-07-04price $1,095
-
2024-06-18price $1,150
-
2024-06-12price $1,195
-
2024-05-21$1,295
-
2022-12-11historical
-
2018-08-14soldstatus $49,000 Closed 673-char remark
Show marketing remark (673 chars)
Centrally located in the Oak Park Subdivision, investors take notice! Currently rented to long term tenants. This home is primed and ready for those looking for secondary income! Within walking distance of restaurants, shopping and the newly updated Wyandotte Park, this home is a perfect fit for any investment portfolio. You'll love the covered front porch, good sized backyard, 2 bedrooms, bath, eat-in-kitchen and separate laundry. Easy maintenance, hardwood flooring in bedrooms and living room. Minutes from Churchill Downs, University of Louisville and Papa Johns Stadium. Motivated Seller, all offers will be considered! Call today for your private viewing!
-
2018-06-22status Pending 673-char remark
Show marketing remark (673 chars)
Centrally located in the Oak Park Subdivision, investors take notice! Currently rented to long term tenants. This home is primed and ready for those looking for secondary income! Within walking distance of restaurants, shopping and the newly updated Wyandotte Park, this home is a perfect fit for any investment portfolio. You'll love the covered front porch, good sized backyard, 2 bedrooms, bath, eat-in-kitchen and separate laundry. Easy maintenance, hardwood flooring in bedrooms and living room. Minutes from Churchill Downs, University of Louisville and Papa Johns Stadium. Motivated Seller, all offers will be considered! Call today for your private viewing!
-
2018-05-08$59,998 Active 673-char remark
Show marketing remark (673 chars)
Centrally located in the Oak Park Subdivision, investors take notice! Currently rented to long term tenants. This home is primed and ready for those looking for secondary income! Within walking distance of restaurants, shopping and the newly updated Wyandotte Park, this home is a perfect fit for any investment portfolio. You'll love the covered front porch, good sized backyard, 2 bedrooms, bath, eat-in-kitchen and separate laundry. Easy maintenance, hardwood flooring in bedrooms and living room. Minutes from Churchill Downs, University of Louisville and Papa Johns Stadium. Motivated Seller, all offers will be considered! Call today for your private viewing!
-
2018-05-08price $59,998 673-char remark
Show marketing remark (673 chars)
Centrally located in the Oak Park Subdivision, investors take notice! Currently rented to long term tenants. This home is primed and ready for those looking for secondary income! Within walking distance of restaurants, shopping and the newly updated Wyandotte Park, this home is a perfect fit for any investment portfolio. You'll love the covered front porch, good sized backyard, 2 bedrooms, bath, eat-in-kitchen and separate laundry. Easy maintenance, hardwood flooring in bedrooms and living room. Minutes from Churchill Downs, University of Louisville and Papa Johns Stadium. Motivated Seller, all offers will be considered! Call today for your private viewing!
-
2016-03-18historical
-
2015-09-18$53,000 Active
-
2015-09-18price $49,000
-
2015-05-15historical
-
2015-04-02$67,500 Active
-
2014-10-20price $64,950
-
2007-07-31historical
-
2007-02-15$70,100
-
2006-11-16historical
-
2006-07-13$67,900
-
2004-12-31soldstatus $63,500
-
2004-12-28soldstatus $63,500
-
2004-10-12$69,831
-
2002-08-09soldstatus $54,000
-
2002-02-28$59,900
ⓘ Source: listings_history table (triggers on properties + properties_extension) + one-shot
backfill from property_details.listing_events for pre-trigger history.
Tax reassessment forecast KY · Resets to sale price
- Current annual tax
- $790 · $66/mo
- Projected year-2 tax
- $790 · $66/mo
- Expected delta
- $0/yr ($0/mo · 0.0%)
ⓘ Screening estimate from a state-policy table — verify with the county assessor before closing.
Climate risk First Street
- Flood 7/10 Severe FEMA zone X (unshaded) · 76% chance over 30 yrs
- Wildfire 1/10 Low
- Heat 5/10 Major 7 d/yr ≥104°F today · 19 d/yr by 30 yrs out
- Wind 2/10 Low 100% chance of damaging wind over 30 yrs
- Air quality 2/10 Low 1 unhealthy d/yr today · 3 by 30 yrs out
Nearby sold comps map
Loading sold comps map…
Walkable amenities ~0.75 mi
Loading nearby amenities…
Taxation est. · year 1
- Rental income
- $12,805
- − Mortgage interest
- −$5,036
- − Property taxes
- −$790
- − Insurance
- −$1,247
- − Repairs & maintenance
- −$1,024
- − Management
- −$1,024
- − Depreciation
- −$2,615
- Taxable income
- $1,068
- Est. tax owed @ 24.0%
- −$256
- After-tax cash flow
- $2,165/yr
For passive investors: Depreciation is non-cash, so a rental often shows a tax loss while cash-flowing — sheltering income. Rental losses are passive: they offset passive income freely, and up to $25,000/yr can offset ordinary (W-2) income if you actively participate and your MAGI is under $100k (phasing out to $0 by $150k); unused losses carry forward. On sale, claimed depreciation is recaptured at up to 25%, and gains may owe capital-gains tax (a 1031 exchange can defer both). Figures are a year-1 estimate at your 24.0% rate — not tax advice; consult a CPA.
Schools (NCES district)
- District
- Jefferson County
- NCES district ID
- 2102990
- Math proficiency
- 19% ▼ -17.00%
- Reading proficiency
- 35% ▼ -11.00%
- Median HH income
- $47,885
- Composite
- 23.45/100
- National rank
- #7884
- State rank
- #121 of 165 in KY
Livability — Louisville
- Score
- 63/100
- State rank
- #333
- US rank
- #15887
Category grades
Schools grade is shown separately in the Schools card above.
Census & demographics
- Census place
- Louisville, KY
- County
- Jefferson County · 790,184 people
- City population
- 769,292
- Metro
- Louisville/Jefferson County, KY-IN
- Population (ZIP)
- 20,532
- Household income
- $43,725
- Rent vs Own
- Severe rent burden
- 997.0
Population outlook (Jefferson County) Hauer SSP2
- Today (2025)
- 823,112 people
- By 2030
- 849,343 · +3.2%
- By 2040
- 895,696 · +8.8%
- By 2050
- 933,630 · +13.4%
- By 2075
- 1,028,262 · +24.9%
- By 2100
- 1,072,675 · +30.3%
Race, ethnicity, and origin ACS 2023
- Neighborhood character
- Diverse neighborhood (Simpson 0.63)
- Race & ethnicity
- White 51% Black 33% Two or more races 11% Hispanic / Latino 6% Asian 2%
- Hispanic origin (detail)
- Mexican 2% Cuban 3%
- Common ancestry
- Slovak 1% Romanian 1% Serbian 1%
- Foreign-born
- 9% · Canada, Vietnam
- Languages at home
- 88% English-only · Spanish 5% Other Indo-European 2% Arabic 1%
Political lean MEDSL · Jefferson
- 2024 margin
- D (+16.6) · D 57.4% · R 40.9% · Other 1.7%
- 2008→2024 swing
- +4.5pp toward D · 2008: 12.0pp · 2024: 16.6pp
- All cycles
- 2024: D+16.6 2020: D+20.1 2016: D+13.3 2012: D+11.1 2008: D+12.0
Not yet ingested
- Civics
- —
Market trends
- HPI YoY
- ▼ -119.35%
- Current HPI
- 227.8248
- Rent YoY
- ▲ 5.16%
- Metro
- Louisville/Jefferson County, KY-IN
- State GDP YoY
- ▲ 1.81%
- F500 in state
- 4
Industry mix (Fortune 500 HQ in KY)
| Industry | F500 HQs | Revenue |
|---|---|---|
| Healthcare | 1 | $118B |
|
||
| Food / Beverage | 1 | $7B |
|
||
Price history
+50.1% since first listed32 events — show timeline
- 2026-05-09 Contingent — Metro Search MLS
- 2026-04-24 Listed $89,900 Metro Search MLS
- 2026-02-05 Rental Removed $895 MSMLS
- 2026-02-03 Price Changed $895 MSMLS
- 2025-11-08 Price Changed $995 MSMLS
- 2025-10-17 Listed for Rent $1,050 MSMLS
- 2024-08-07 Rental Removed $995 MSMLS
- 2024-07-12 Price Changed $995 MSMLS
- 2024-07-04 Price Changed $1,095 MSMLS
- 2024-06-18 Price Changed $1,150 MSMLS
- 2024-06-12 Price Changed $1,195 MSMLS
- 2024-05-21 Listed for Rent $1,295 MSMLS
- 2022-12-11 Rental Removed — RENT.
- 2018-08-14 Sold (MLS) $49,000 Metro Search MLS
- 2018-06-22 Pending — Metro Search MLS
- 2018-05-08 Price Changed $59,998 Metro Search MLS
- 2018-05-08 Listed $59,998 Metro Search MLS
- 2016-03-18 Listing Removed — Metro Search MLS
- 2015-09-18 Listed $53,000 Metro Search MLS
- 2015-09-18 Price Changed $49,000 Metro Search MLS
- 2015-05-15 Listing Removed — Metro Search MLS
- 2015-04-02 Listed $67,500 Metro Search MLS
- 2014-10-20 Price Changed $64,950 Metro Search MLS
- 2007-07-31 Listing Removed — Metro Search MLS
- 2007-02-15 Listed $70,100 Metro Search MLS
- 2006-11-16 Listing Removed — Metro Search MLS
- 2006-07-13 Listed $67,900 Metro Search MLS
- 2004-12-31 Sold (Public Records) $63,500 Public Records
- 2004-12-28 Sold (MLS) $63,500 Metro Search MLS
- 2004-10-12 Listed $69,831 Metro Search MLS
- 2002-08-09 Sold (MLS) $54,000 Metro Search MLS
- 2002-02-28 Listed $59,900 Metro Search MLS
Property tax history
+1.6%/yrLatest (2025): $790 · -1.9% YoY. Source: county tax records.
Cash-flow waterfall
monthlySold comps — $/sqft
last 12 mo · ≤1 miLoading sold comps…