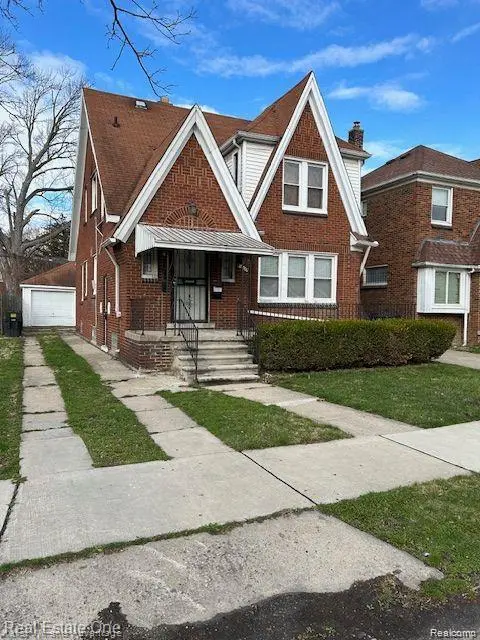
8607 Northlawn St · Detroit, MI
Flood risk 3/10 · Minor
- FEMA flood zone
- X (unshaded)
- Chance of flooding over 30 yrs
- 0.2%
- Est. flood insurance / yr
- $473 – $860
Fire risk 1/10 · Minimal
- Est. fire insurance / yr
- $784 – $1,456
Heat risk 3/10 · Minor
- Hot days now (above 96°F)
- 7 days/yr
- Hot days in 30 yrs
- 15 days/yr
Wind risk 2/10 · Minimal
- Chance of severe wind over 30 yrs
- —
Air-quality risk 3/10 · Minor
- Unhealthy air days now
- 2 days/yr
- Unhealthy air days in 30 yrs
- 5 days/yr
Risk factors via First Street. Map © Google.
Why this score? — see what drove the B grade
The composite is a weighted blend of 9 inputs, each scored 0–100. Each bar is that input's sub-score; the figure is the points it added to the 100-point composite (weight × sub-score).
- Cash flow +26.7/30.0
- Appreciation +10.0/10.0
- DSCR +9.2/10.0
- 1% rule +7.2/10.0
- ARV discount +7.1/15.0
- Livability +3.7/5.0
- Rent growth +2.5/5.0
- Condition / age +2.5/5.0
- Schools +1.3/10.0
$119,900
🖨 Deal sheet 📄 Offer letter ✓ Due diligence
Listing remarks MLS
Brick 2 Family 1st Floor unit has 2 bedrooms, living & large dining rm. , kitchen & bath. 2nd Floor unit offers has 2 bedroom, living rm. , kitchen & two storage rooms (walk-in's). Home offers large, divided basement. Owner was collecting $1000.00 downstairs $900.00 upstairs monthly Rent. The House very clean and ready for move in
Key facts
- Large dining
- 2 family
- Two storage rooms
Tags
Property features AI
Finance
- Other: Zoned for multifamily use; Lot dimensions approximately 35 x 103 (0.08 acres)
- Financial info: Annual tax amount: $4,579
Exterior
- Utilities: Public water; Public sewer
- Home design: Residential income, multifamily property; One and one-half stories; Brick construction
- Construction: Brick exterior; Block foundation; Built area above grade: 1,542 (finished)
- Exterior features: Paved road access; Pets not allowed
Interior
- Bathrooms: 2 full bathrooms
- Heating & cooling: Forced air heating (natural gas); No central air
- Interior features: Full, unfinished basement
Neighborhood map
What this means for you Summary
Snapshot
- This is a 4-bed/1.5-bath single-family listed at $120k.
Deal economics
- At list price, monthly cash flow is $324 ($4k/yr) — positive.
- The deal already cash-flows at list — no discount required.
- Meets the 1% rule at list price ($1k rent vs $120k).
Location & tenants
- Location reads 73/100 on livability (#218 in MI) — a middle-class / working-renter tenant base. Strengths: amenities A+, commute A+, cost of living A+; Watch: schools F, crime F, employment F.
- Detroit Public Schools Community District (urban): math 10% / reading 24% proficiency, ranked #499 of 540 in MI (top 92%) — low school quality limits family demand, transient renter base, plan for 1-2y turnover; 90% free/reduced lunch — lower-income household profile, screen leases tightly.
- Market conditions: 244 active listings in the ZIP; 11 comparable units currently listed for rent nearby; rentals at typical pace (median 20d on market — plan ~3-4 weeks tenant-placement turnaround); 45% of comp listings sitting > 30 days — soft ceiling on asking rent; lower-income renter base — watch delinquency; 2,639 units permitted in Wayne County in 2024 (1,216 in 5+ unit buildings).
- At $1,459/mo this rent would consume 51% of the median local household income ($34k/yr) (locally 1418% of renters already pay >50% of income on rent) — very limited rent-growth headroom before tenants either downsize or default.
Forward outlook
- In year one you build about $13k of equity ($829 loan paydown + $12k appreciation (10.0% local appreciation)).
- Wayne County population projected at -17% by 2050 — secular population decline; favor cash flow + early exit over multi-decade hold.
- At projected returns (10.0% appreciation + 3.0% rent growth), your $34k cash investment doubles in ~2 years — after that, you're playing with house money.
- By year 3, paydown + projected appreciation supports a ~$32k cash-out refi (75% LTV) — recoverable capital for the next deal without selling this one.
Negotiation context
- Only 7 days on market — expect competitive offers; lowballing is unlikely to land.
- 9 sale attempts since 24y ago with the ask held roughly flat each time — persistent listings suggest the price (not the market) is what's stuck; bring a comps-based counter.
- Current owner paid $43k; list at $120k implies a 179% gain — meaningful room to come down on a strong offer.
Risks & watch-outs
- Watch-outs: built in 1931 — expect roof / HVAC / electrical / plumbing capex.
Questions for the listing agent
- Built in 1931 — when were the roof, HVAC, electrical panel, plumbing, and water heater last replaced?
- Is there a deadline driving the sale (1031 exchange, divorce, estate, relocation)? That informs how much negotiation room exists.
- Schools are F-rated, which usually means shorter tenancies and higher turnover. Who's the typical renter profile here, and what's been the actual vacancy rate?
- Crime grade is F in this area — have there been break-ins, vandalism, or insurance claims at this property in the last 3 years? What carrier currently insures it and at what premium?
- What's the average days-on-market for RENTAL listings here right now (not sales)? A rising rental-DOM trend means longer vacancies and softer asking-rent achievability than the comps imply.
- What's the recent tenant-quality profile in this submarket — average credit score on applications, eviction rate, late-payment / NSF rate, and stable-employment percentage? A property-management company in the area should have these aggregated.
- How much new for-sale + rental construction is in the pipeline within 1–3 miles? Heavy new supply typically softens prices + rents 12–24 months out; constrained supply supports both.
Investment metrics
- 1% rule
- 1.22% ✓
- Cap rate
- 9.54%
- Cash-on-cash
- 11.59%
- DSCR
- 1.52
- GRM
- 6.8
CMA / ARV
- ARV (on-the-fly)
- $118,734
- Comps found
- 12
Show comp detail 12 sales within ~0.75 mi
| Address | Dist | Beds/Ba | Sqft | Sold | Price | $/sf | Match |
|---|---|---|---|---|---|---|---|
| 8301 Northlawn St | 0.17mi | 3/2.5 (-1) | 1,636 (+6%) | 2mo | $115,000 | $70 | 71 |
| 8607 Indiana St | 0.18mi | 3/1.5 (-1) | 1,457 (-6%) | 9mo | $100,000 | $69 | 70 |
| 8354 Wyoming Ave | 0.30mi | 3/1.0 (-1) | 1,620 (+5%) | 7mo | $125,000 | $77 | 64 |
| 9015 Cloverlawn St | 0.21mi | 4/2.0 | 1,390 (-10%) | 11mo | $50,000 | $36 | 63 |
| 8010 Normile St | 0.53mi | 3/2.0 (-1) | 1,600 (+4%) | 6mo | $219,999 | $137 | 56 |
| 5801 Oakman Blvd | 0.64mi | 4/1.5 | 1,451 (-6%) | 5mo | $160,000 | $110 | 56 |
| 8205 Normile St | 0.44mi | 5/1.5 (+1) | 1,648 (+7%) | 10mo | $76,000 | $46 | 55 |
| 8044 E Morrow Cir | 0.59mi | 3/1.5 (-1) | 1,505 (-2%) | 12mo | $225,000 | $150 | 54 |
| 9181 Pinehurst St | 0.74mi | 4/2.0 | 1,500 (-3%) | 12mo | $50,000 | $33 | 49 |
| 8127 American St | 0.51mi | 4/1.0 | 1,317 (-15%) | 8mo | $29,000 | $22 | 44 |
| 8043 E Morrow Circle St E | 0.62mi | 3/2.0 (-1) | 1,398 (-9%) | 8mo | $155,000 | $111 | 42 |
| 8304 Pinehurst St | 0.67mi | 3/1.0 (-1) | 1,344 (-13%) | 9mo | $123,500 | $92 | 33 |
Match score weights: distance 35% · size 25% · config 20% · recency 20%. Top-matched comps best support the ARV.
Projected returns pro-forma
10.0% appreciation · 3.0% rent growth · sell at horizon
- IRR
- 32.8%
- Equity multiple
- 3.56×
- Total profit
- $85,970
- Equity at exit
- $108,015
- IRR
- 28.3%
- Equity multiple
- 8.06×
- Total profit
- $236,974
- Equity at exit
- $232,939
Cash invested: $33,572 (down + closing). Projections, not guarantees.
Landlord ↔ Tenant lean methodology
- Overall (STATE)
- 62 Landlord-Friendly
- State Michigan
- 62 Landlord-Friendly · EVEN
- County
- — inherits STATE
- City
- — inherits STATE
ZIP-level market 48204
- Home prices YoY
- 18.5%
- Active inventory
- 244
- Price-to-rent
- 6.8×
Monthly cashflow live
- Estimated rent
- $1,459 high interval (Pro) →
- Mortgage (P&I)
- −$629
- Tax est. 1.5%
- −$150 /mo · $1,798/yr
- Insurance
- −$50
- HOA
- −$0
- Vacancy / Maint / Mgmt
- −$306
- Net cashflow
- $324
Break-even live
UW: 25.0% down · 7.5% · 30yr · 1.5% tax · 5.0% vac · 8.0% maint · 8.0% mgmt
Financing live
Cash to close
- Down payment
- $29,975
- Closing costs
- $3,597
- Reserves months
- —
- Total cash needed
- —
Loan-product check · same deal, 3 products live
Conventional
25% down · 7.5% · 30yr
- Down + closing
- —
- Monthly P&I
- —
- Monthly cashflow
- —
- DSCR
- —
- Eligible?
- —
Personal DTI + credit; lowest rate.
DSCR
20% down · 8.5% · 30yr
- Down + closing
- —
- Monthly P&I
- —
- Monthly cashflow
- —
- DSCR
- —
- Eligible?
- —
No personal income docs; deal must DSCR.
Hard money
10% down · 12.0% · 12mo
- Down + closing
- —
- Monthly P&I
- —
- Monthly cashflow
- —
- DSCR
- —
- Eligible?
- —
Short-term bridge; refi at stabilization.
Rent comps 11 comps
| Address | Beds | Baths | Sqft | Rent | $/sqft | DOM | Units | Dist |
|---|---|---|---|---|---|---|---|---|
| 8320 Northlawn St Detroit, MI | 3.0 | 1.0 | 1737 | $1,550 | $0.89 | 20d | 1 | 0.14mi |
| 8230 Ohio St Detroit, MI | 3.0 | 1.0 | 1350 | $1,200 | $0.89 | 16d | 1 | 0.23mi |
| 8143 Wisconsin St Detroit, MI | 4.0 | 1.0 | 1370 | $1,800 | $1.31 | 1d | 1 | 0.31mi |
| 9209 Pinehurst St Detroit, MI | 3.0 | 1.0 | 1589 | $1,500 | $0.94 | 43d | 1 | 0.77mi |
| 7424 Wykes St Detroit, MI | 3.0 | 1.0 | 1200 | $1,100 | $0.92 | 43d | 1 | 0.89mi |
| 10002 Manor Unit 2 Detroit, MI | 3.0 | 1.0 | 1100 | $1,150 | $1.05 | 43d | 1 | 1.13mi |
| 9355 Ward St Detroit, MI | 3.0 | 1.0 | 1200 | $1,327 | $1.11 | 43d | 1 | 1.17mi |
| 5315 Spokane St Detroit, MI | 3.0 | 1.0 | 2110 | $1,200 | $0.57 | 16d | 1 | 1.24mi |
| 12144 Washburn St Detroit, MI | 3.0 | 1.0 | 1200 | $1,200 | $1.00 | 14d | 1 | 1.43mi |
| 12303 Cloverlawn St Detroit, MI | 3.0 | 1.5 | 1454 | $1,400 | $0.96 | 43d | 1 | 1.46mi |
| 4915 Maplewood St Detroit, MI | 3.0 | 1.0 | 1324 | $1,100 | $0.83 | 16d | 1 | 1.49mi |
Listing history 7 events
-
2026-06-10status $119,900 Pending 7 DOM
-
2026-06-09days on market $119,900 Active 7 DOM
-
2026-06-08days on market $119,900 Active 6 DOM
-
2026-06-07days on market $119,900 Active 5 DOM
-
2026-06-04days on market $119,900 Active 2 DOM
-
2026-06-02remarks 340-char remark
Show marketing remark (350 chars)
Brick 2 Family 1st Floor unit has 2 bedrooms, living & large dining rm. , kitchen & bath. 2nd Floor unit offers has 2 bedroom, living rm. , kitchen & two storage rooms (walk-in's). Home offers large, divided basement. Owner was collecting $1000.00 downstairs $900.00 upstairs monthly Rent. The House very clean and ready for move in
-
2026-06-02$119,900 Active 1 DOM
Show marketing remark (350 chars)
Brick 2 Family 1st Floor unit has 2 bedrooms, living & large dining rm. , kitchen & bath. 2nd Floor unit offers has 2 bedroom, living rm. , kitchen & two storage rooms (walk-in's). Home offers large, divided basement. Owner was collecting $1000.00 downstairs $900.00 upstairs monthly Rent. The House very clean and ready for move in
ⓘ Source: listings_history table (triggers on properties + properties_extension) + one-shot
backfill from property_details.listing_events for pre-trigger history.
Climate risk First Street
- Flood 3/10 Moderate FEMA zone X (unshaded) · 20% chance over 30 yrs
- Wildfire 1/10 Low
- Heat 3/10 Moderate 7 d/yr ≥96°F today · 15 d/yr by 30 yrs out
- Wind 2/10 Low
- Air quality 3/10 Moderate 2 unhealthy d/yr today · 5 by 30 yrs out
Nearby sold comps map
Loading sold comps map…
Walkable amenities ~0.75 mi
Loading nearby amenities…
Taxation est. · year 1
- Rental income
- $17,511
- − Mortgage interest
- −$6,716
- − Property taxes
- −$1,798
- − Insurance
- −$600
- − Repairs & maintenance
- −$1,401
- − Management
- −$1,401
- − Depreciation
- −$3,488
- Taxable income
- $2,107
- Est. tax owed @ 24.0%
- −$506
- After-tax cash flow
- $3,385/yr
For passive investors: Depreciation is non-cash, so a rental often shows a tax loss while cash-flowing — sheltering income. Rental losses are passive: they offset passive income freely, and up to $25,000/yr can offset ordinary (W-2) income if you actively participate and your MAGI is under $100k (phasing out to $0 by $150k); unused losses carry forward. On sale, claimed depreciation is recaptured at up to 25%, and gains may owe capital-gains tax (a 1031 exchange can defer both). Figures are a year-1 estimate at your 24.0% rate — not tax advice; consult a CPA.
Schools (NCES district)
- District
- Detroit Public Schools Community District
- NCES district ID
- 2601103
- Math proficiency
- 10% ▼ -2.00%
- Reading proficiency
- 24% ▲ 6.00%
- Median HH income
- $25,815
- Composite
- 13.06/100
- National rank
- #9564
- State rank
- #499 of 540 in MI
Livability — Detroit
- Score
- 73/100
- State rank
- #218
- US rank
- #5427
Category grades
Schools grade is shown separately in the Schools card above.
Census & demographics
- Census place
- Detroit, MI
- County
- Wayne County · 1,562,939 people
- City population
- 572,865
- Metro
- Detroit-Warren-Dearborn, MI
- Population (ZIP)
- 20,696
- Household income
- $34,468
- Rent vs Own
- Severe rent burden
- 1418.0
Population outlook (Wayne County) Hauer SSP2
- Today (2025)
- 1,675,273 people
- By 2030
- 1,620,300 · -3.3%
- By 2040
- 1,502,341 · -10.3%
- By 2050
- 1,384,039 · -17.4%
- By 2075
- 1,124,592 · -32.9%
- By 2100
- 881,193 · -47.4%
Race, ethnicity, and origin ACS 2023
- Neighborhood character
- Predominantly Black (86%)
- Race & ethnicity
- Black 86% Two or more races 7% Hispanic / Latino 5% White 4% Native American 2%
- Hispanic origin (detail)
- Mexican 4%
- Common ancestry
- Hispanic 1% Romanian 1%
- Foreign-born
- 2% · Canada
- Languages at home
- 95% English-only · Spanish 4%
Political lean MEDSL · Wayne
- 2024 margin
- Strong D (+29.0) · D 62.7% · R 33.7% · Other 3.6%
- 2008→2024 swing
- -20.5pp toward R · 2008: 49.5pp · 2024: 29.0pp
- All cycles
- 2024: D+29.0 2020: D+38.1 2016: D+37.3 2012: D+46.9 2008: D+49.5
Not yet ingested
- Civics
- —
Market trends
- HPI YoY
- ▲ 36.51%
- Current HPI
- 234.0465
- Rent YoY
- —
- Metro
- Detroit-Warren-Dearborn, MI
- State GDP YoY
- ▲ 1.37%
- F500 in state
- 28
Industry mix (Fortune 500 HQ in MI)
| Industry | F500 HQs | Revenue |
|---|---|---|
| Automotive Parts | 3 | $48B |
|
||
| Automotive | 2 | $372B |
|
||
| Chemicals | 1 | $45B |
|
||
| Automotive Retail | 1 | $29B |
|
||
| Healthcare / Medical Devices | 1 | $23B |
|
||
| Automotive Technology | 1 | $20B |
|
||
Price history
+19.9% since first listed21 events — show timeline
- 2026-06-02 Listed $119,900 MiRealSource-MiMLS
- 2026-06-02 Listed $119,900 REALCOMP
- 2026-05-01 Listing Removed — MiRealSource-MiMLS
- 2026-05-01 Listing Removed — REALCOMP
- 2026-04-27 Price Changed $119,000 MiRealSource-MiMLS
- 2026-04-27 Price Changed $119,000 REALCOMP
- 2026-01-08 Listed $119,900 MiRealSource-MiMLS
- 2026-01-08 Listed $119,900 REALCOMP
- 2024-07-03 Sold (MLS) $43,000 MiRealSource-MiMLS
- 2024-07-03 Sold (MLS) $43,000 REALCOMP
- 2024-06-26 Pending — MiRealSource-MiMLS
- 2024-06-26 Pending — REALCOMP
- 2024-06-21 Contingent — REALCOMP
- 2024-06-21 Contingent — MiRealSource-MiMLS
- 2024-06-13 Listed $40,000 MiRealSource-MiMLS
- 2024-06-13 Listed $40,000 REALCOMP
- 2006-08-23 Listing Removed — MiRealSource-MiMLS
- 2006-04-21 Listed $94,950 MiRealSource-MiMLS
- 2002-12-30 Listing Removed — MiRealSource-MiMLS
- 2002-08-30 Listed $100,000 REALCOMP
- 2002-08-30 Listed $100,000 MiRealSource-MiMLS
Property tax history
+16.4%/yrLatest (2025): $6,586 · +728.5% YoY. Source: county tax records.
Cash-flow waterfall
monthlySold comps — $/sqft
last 12 mo · ≤1 miLoading sold comps…