30 Grimes Rd · Muddy, IL
Flood risk 1/10 · Minimal
- FEMA flood zone
- X (unshaded)
- Chance of flooding over 30 yrs
- 0.0%
- Est. flood insurance / yr
- $473 – $860
Fire risk 1/10 · Minimal
- Est. fire insurance / yr
- $804 – $1,492
Heat risk 4/10 · Minor
- Hot days now (above 108°F)
- 7 days/yr
- Hot days in 30 yrs
- 19 days/yr
Wind risk 2/10 · Minimal
- Chance of severe wind over 30 yrs
- 4.0%
Air-quality risk 2/10 · Minimal
- Unhealthy air days now
- 0 days/yr
- Unhealthy air days in 30 yrs
- 1 days/yr
Risk factors via First Street. Map © Google.
Why this score? — see what drove the B- grade
The composite is a weighted blend of 9 inputs, each scored 0–100. Each bar is that input's sub-score; the figure is the points it added to the 100-point composite (weight × sub-score).
- Cash flow +30.0/30.0
- 1% rule +10.0/10.0
- DSCR +10.0/10.0
- ARV discount +7.5/15.0
- Rent growth +2.5/5.0
- Condition / age +2.5/5.0
- Livability +2.1/5.0
- Schools +1.2/10.0
- Appreciation +0.0/10.0
$25,000
🖨 Deal sheet 📄 Offer letter ✓ Due diligence
Listing remarks MLS
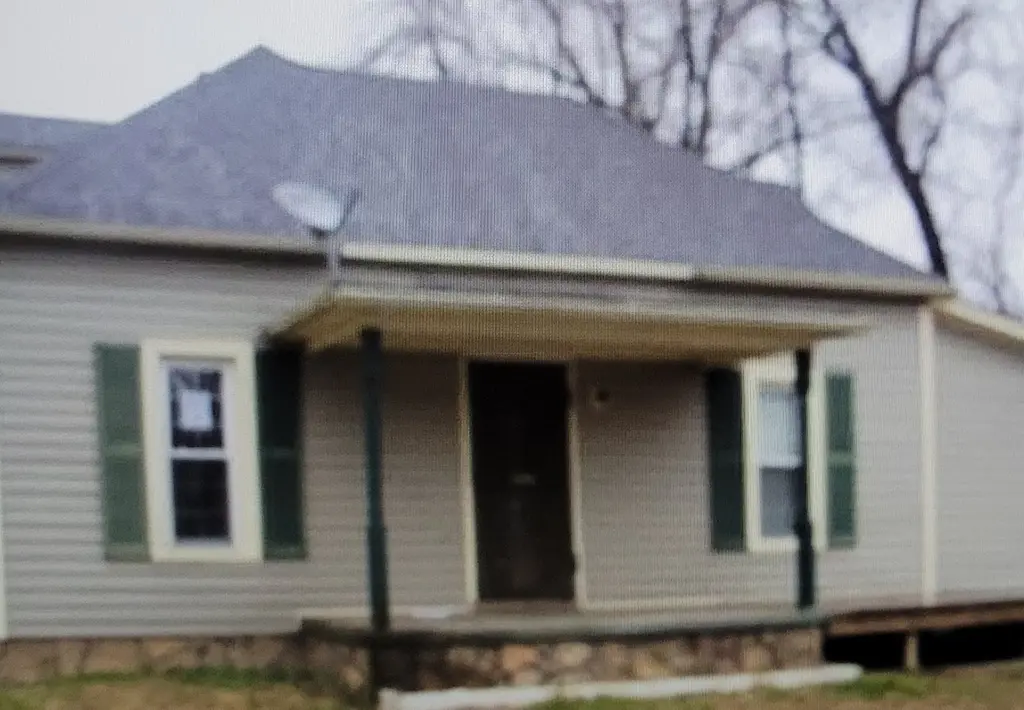
Home needs some TLC. Needs drywall finished and painted etc. Was started remodeling but never finished. None
Key facts
- 0.25 acre lot
- Garage
- Built 1960
Property features AI
Finance
- Other: Located in an unincorporated area (Township: Raleigh); Directions: Hwy 45 N from Harrisburg to Eldorado, left on Wasson Rd, right on Grimes; Immediate possession available
- HOA & community: No master association fee required
Exterior
- Parking: Attached garage (1 garage space); Total 2 parking spaces
- Utilities: Public water
- Home design: Detached single-family home; One-story; Fee simple ownership; Built before 1978
- Construction: Vinyl siding; House age approximately 61–70 years; Not rebuilt or rehabbed
- Exterior features: Lot approximately 0.25–0.49 acre; Lot dimensions about 50 x 200
Interior
- Kitchen: Kitchen on main level (approximately 8 x 10)
- Bedrooms: 1 bedroom (master bedroom on main level); Additional bedroom spaces listed (Bedroom 2, Bedroom 3, Bedroom 4)
- Bathrooms: 1 full bathroom
- Heating & cooling: Window air conditioning units
- Interior features: Estimated living area; 4 total rooms
- Laundry & utility: Laundry room
Neighborhood map
What this means for you Summary
Snapshot
- This is a 1-bed/1.0-bath single-family listed at $25k.
Deal economics
- At list price, monthly cash flow is $547 ($7k/yr) — positive.
- The deal already cash-flows at list — no discount required.
- Meets the 1% rule at list price ($911 rent vs $25k).
- Recommended offer: $24k (3.0% below list) — sets the bar for market timing.
Location & tenants
- Location reads 41/100 on livability (#1,360 in IL) — a working-class tenant base; expect higher turnover. Strengths: cost of living A+, crime A; Watch: schools F, amenities F, commute F.
- Eldorado CUSD 4 (town): math 11% / reading 19% proficiency, ranked #526 of 620 in IL (top 85%) — low school quality limits family demand, transient renter base, plan for 1-2y turnover.
- Market conditions: 73 active listings in the ZIP.
Forward outlook
- Local home prices are declining (-3.0%/yr); year-one equity from $173 of loan paydown is wiped out by about $750 of value loss. Plan a longer hold.
- Saline County population projected at -16% by 2050 — secular population decline; favor cash flow + early exit over multi-decade hold.
- At projected returns (-3.0% appreciation + 3.0% rent growth), your $7k cash investment doubles in ~2 years — after that, you're playing with house money.
Negotiation context
- It's been on market 53 days — a 3% lower offer ($24k) is reasonable based on typical stale-listing flexibility.
- 2 sale attempts since 14y ago; this cycle's ask is 150% above the opening price — seller raised mid-cycle; expect resistance to lowballs.
- Current owner paid $7k; list at $25k implies a 238% gain — meaningful room to come down on a strong offer.
Questions for the listing agent
- It's been on market 53 days. Have you received any prior offers? Is the seller open to a 3% concession, seller financing, or rate buy-down credit?
- Built in 1960 — when were the roof, HVAC, electrical panel, plumbing, and water heater last replaced?
- Is there a deadline driving the sale (1031 exchange, divorce, estate, relocation)? That informs how much negotiation room exists.
- Schools are F-rated, which usually means shorter tenancies and higher turnover. Who's the typical renter profile here, and what's been the actual vacancy rate?
- What's the average days-on-market for RENTAL listings here right now (not sales)? A rising rental-DOM trend means longer vacancies and softer asking-rent achievability than the comps imply.
- What's the recent tenant-quality profile in this submarket — average credit score on applications, eviction rate, late-payment / NSF rate, and stable-employment percentage? A property-management company in the area should have these aggregated.
- How much new for-sale + rental construction is in the pipeline within 1–3 miles? Heavy new supply typically softens prices + rents 12–24 months out; constrained supply supports both.
Investment metrics
- 1% rule
- 3.64% ✓
- Cap rate
- 32.54%
- Cash-on-cash
- 93.75%
- DSCR
- 5.17
- GRM
- 2.3
CMA / ARV
No comps found within radius.
Projected returns pro-forma
-3.0% appreciation · 3.0% rent growth · sell at horizon
- IRR
- 94.6%
- Equity multiple
- 5.40×
- Total profit
- $30,792
- Equity at exit
- $3,728
- IRR
- 97.3%
- Equity multiple
- 11.25×
- Total profit
- $71,718
- Equity at exit
- $2,162
Cash invested: $7,000 (down + closing). Projections, not guarantees.
Landlord ↔ Tenant lean methodology
- Overall (STATE)
- 43 Moderately Tenant-Leaning
- State Illinois
- 43 Moderately Tenant-Leaning · D+7
- County
- — inherits STATE
- City
- — inherits STATE
ZIP-level market 62946
- Active inventory
- 73
- Price-to-rent
- 2.3×
Monthly cashflow live
- Estimated rent
- $911 medium interval (Pro) →
- Mortgage (P&I)
- −$131
- Tax est. 1.5%
- −$31 /mo · $375/yr
- Insurance
- −$10
- HOA
- −$0
- Vacancy / Maint / Mgmt
- −$191
- Net cashflow
- $547
Break-even live
UW: 25.0% down · 7.5% · 30yr · 1.5% tax · 5.0% vac · 8.0% maint · 8.0% mgmt
Financing live
Cash to close
- Down payment
- $6,250
- Closing costs
- $750
- Reserves months
- —
- Total cash needed
- —
Loan-product check · same deal, 3 products live
Conventional
25% down · 7.5% · 30yr
- Down + closing
- —
- Monthly P&I
- —
- Monthly cashflow
- —
- DSCR
- —
- Eligible?
- —
Personal DTI + credit; lowest rate.
DSCR
20% down · 8.5% · 30yr
- Down + closing
- —
- Monthly P&I
- —
- Monthly cashflow
- —
- DSCR
- —
- Eligible?
- —
No personal income docs; deal must DSCR.
Hard money
10% down · 12.0% · 12mo
- Down + closing
- —
- Monthly P&I
- —
- Monthly cashflow
- —
- DSCR
- —
- Eligible?
- —
Short-term bridge; refi at stabilization.
Listing history 15 events
-
2026-06-18days on market $25,000 Active 53 DOM
-
2026-06-17days on market $25,000 Active 52 DOM
-
2026-06-16days on market $25,000 Active 51 DOM
-
2026-06-15days on market $25,000 Active 50 DOM
-
2026-06-13days on market $25,000 Active 48 DOM
-
2026-06-12days on market $25,000 Active 47 DOM
-
2026-06-09days on market $25,000 Active 44 DOM
-
2026-06-08days on market $25,000 Active 43 DOM
-
2026-06-07days on market $25,000 Active 42 DOM
-
2026-06-07days on market $25,000 Active 41 DOM
-
2026-06-04days on market $25,000 Active 38 DOM
-
2026-06-02days on market $25,000 Active 37 DOM
-
2026-06-01days on market $25,000 Active 36 DOM
-
2026-05-31days on market $25,000 Active 35 DOM
-
2026-05-31days on market $25,000 Active 34 DOM
ⓘ Source: listings_history table (triggers on properties + properties_extension) + one-shot
backfill from property_details.listing_events for pre-trigger history.
Climate risk First Street
- Flood 1/10 Low FEMA zone X (unshaded) · 0% chance over 30 yrs
- Wildfire 1/10 Low
- Heat 4/10 Moderate 7 d/yr ≥108°F today · 19 d/yr by 30 yrs out
- Wind 2/10 Low 4% chance of damaging wind over 30 yrs
- Air quality 2/10 Low 0 unhealthy d/yr today · 1 by 30 yrs out
Nearby sold comps map
Loading sold comps map…
Walkable amenities ~0.75 mi
Loading nearby amenities…
Taxation est. · year 1
- Rental income
- $10,931
- − Mortgage interest
- −$1,400
- − Property taxes
- −$375
- − Insurance
- −$125
- − Repairs & maintenance
- −$874
- − Management
- −$874
- − Depreciation
- −$727
- Taxable income
- $6,554
- Est. tax owed @ 24.0%
- −$1,573
- After-tax cash flow
- $4,989/yr
For passive investors: Depreciation is non-cash, so a rental often shows a tax loss while cash-flowing — sheltering income. Rental losses are passive: they offset passive income freely, and up to $25,000/yr can offset ordinary (W-2) income if you actively participate and your MAGI is under $100k (phasing out to $0 by $150k); unused losses carry forward. On sale, claimed depreciation is recaptured at up to 25%, and gains may owe capital-gains tax (a 1031 exchange can defer both). Figures are a year-1 estimate at your 24.0% rate — not tax advice; consult a CPA.
Schools (NCES district)
- District
- Eldorado CUSD 4
- NCES district ID
- 1713660
- Math proficiency
- 11% ▼ -10.00%
- Reading proficiency
- 19% ▼ -11.00%
- Median HH income
- $36,707
- Composite
- 12.47/100
- National rank
- #9627
- State rank
- #526 of 620 in IL
Livability — Muddy
- Score
- 41/100
- State rank
- #1360
- US rank
- #27127
Category grades
Schools grade is shown separately in the Schools card above.
Census & demographics
- City population
- 54
- Population (ZIP)
- 11,465
Population outlook (Saline County) Hauer SSP2
- Today (2025)
- 23,915 people
- By 2030
- 23,262 · -2.7%
- By 2040
- 21,775 · -8.9%
- By 2050
- 20,098 · -16.0%
- By 2075
- 15,234 · -36.3%
- By 2100
- 10,302 · -56.9%
Race, ethnicity, and origin ACS 2023
- Neighborhood character
- Predominantly White (93%)
- Race & ethnicity
- White 93% Two or more races 4% Black 3%
- Common ancestry
- Italian 2% Slovak 2% Serbian 2%
- Foreign-born
- 0%
Political lean MEDSL · Saline
- 2024 margin
- Solid R (+49.0) · D 24.8% · R 73.8% · Other 1.3%
- 2008→2024 swing
- -40.1pp toward R · 2008: -8.9pp · 2024: -49.0pp
- All cycles
- 2024: R+49.0 2020: R+47.9 2016: R+50.7 2012: R+29.0 2008: R+8.9
Not yet ingested
- Civics
- —
Market trends
- HPI YoY
- ▼ -61.20%
- Current HPI
- 102.6962
- Rent YoY
- —
- Metro
- —
- State GDP YoY
- ▲ 1.59%
- F500 in state
- 60
Industry mix (Fortune 500 HQ in IL)
| Industry | F500 HQs | Revenue |
|---|---|---|
| Insurance | 4 | $201B |
|
||
| Consumer Goods | 4 | $87B |
|
||
| Industrial Machinery | 3 | $64B |
|
||
| Healthcare | 2 | $55B |
|
||
| Retail / Pharmacy | 1 | $148B |
|
||
| Agriculture / Food | 1 | $86B |
|
||
Price history
-26.0% since first listed4 events — show timeline
- 2012-04-05 Sold (MLS) $7,400 MRED as Distributed by MLS Grid
- 2012-04-05 Sold (MLS) $7,400 RMLSA as Distributed by MLS Grid
- 2012-02-15 Listed $10,000 MRED as Distributed by MLS Grid
- 2012-02-15 Listed $10,000 RMLSA as Distributed by MLS Grid
Property tax history
-17.3%/yrLatest (2024): $45 · -4.9% YoY. Source: county tax records.
Cash-flow waterfall
monthlySold comps — $/sqft
last 12 mo · ≤1 miLoading sold comps…