 Fourplex
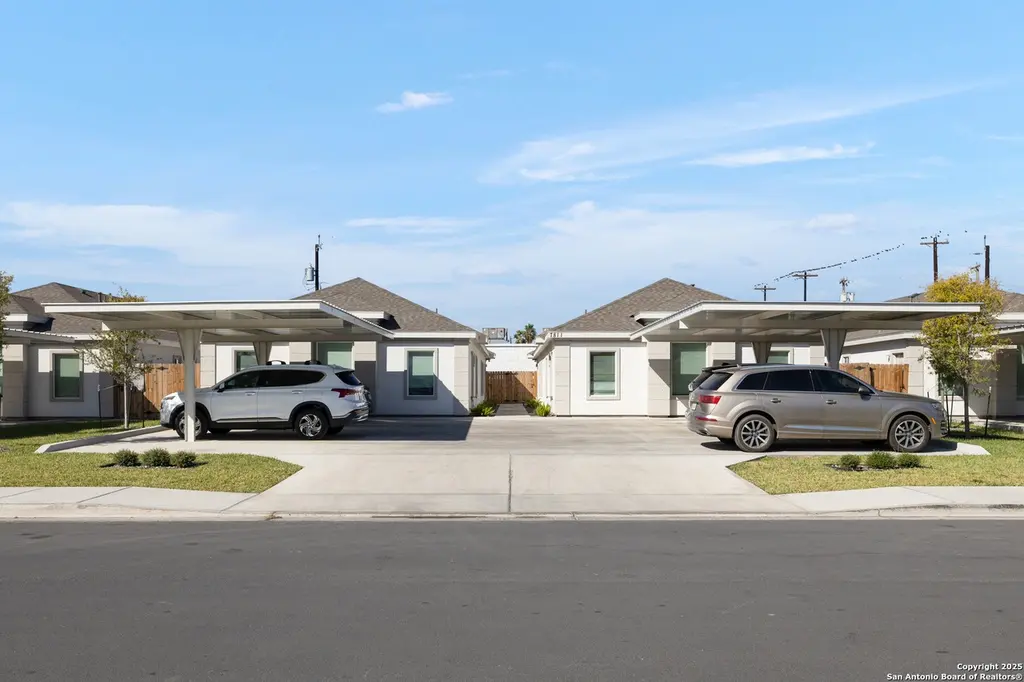
7811 58th Ln · Alton, TX
Flood risk No data
- FEMA flood zone
- —
- Chance of flooding over 30 yrs
- —
- Est. flood insurance / yr
- —
Fire risk No data
- Est. fire insurance / yr
- —
Heat risk No data
- Hot days now (above threshold)
- —
- Hot days in 30 yrs
- —
Wind risk No data
- Chance of severe wind over 30 yrs
- —
Air-quality risk No data
- Unhealthy air days now
- —
- Unhealthy air days in 30 yrs
- —
Risk factors via First Street. Map © Google.
Why this score? — see what drove the C+ grade
The composite is a weighted blend of 9 inputs, each scored 0–100. Each bar is that input's sub-score; the figure is the points it added to the 100-point composite (weight × sub-score).
- Cash flow +17.6/30.0
- ARV discount +10.6/15.0
- Appreciation +10.0/10.0
- DSCR +5.5/10.0
- 1% rule +4.9/10.0
- Condition / age +4.0/5.0
- Schools +3.4/10.0
- Rent growth +3.1/5.0
- Livability +2.9/5.0
$490,000
🖨 Deal sheet 📄 Offer letter ✓ Due diligence
Multi-family units
County records classify this as Multi-Family (2-4 Unit). Listing-text estimate: 4 units. confirmed
Listing remarks MLS
FULLY LEASED FOURPLEX ON SHARY RD AND MILE 5! Don’t miss this well-maintained, contemporary-style 4-unit property featuring a sleek, modern exterior that offers strong curb appeal. The building includes a mix of spacious 3-bedroom/2-bath and 2-bedroom/2-bath units—ideal for attracting a wide range of tenants. Each unit is designed for comfort and convenience, with two full bathrooms per unit. This is a solid income-producing opportunity in a desirable location, perfect for investors looking to expand their portfolio with a reliable, low-maintenance property.
Key facts
- 8 parking spots
- Built 2024
- Listed 192 days
Neighborhood map
What this means for you Summary
Snapshot
- This is a 2×2bd/2.0ba + 2×3bd/2.0ba units multifamily listed at $490k. Condition is rated good.
Deal economics
- At list price, monthly cash flow is $384 ($5k/yr) — positive. Per door: $96/mo.
- The deal already cash-flows at list — no discount required.
- To meet the 1% rule (rent ≥ 1% of price), the offer needs to be $485k (1.0% below list).
- Recommended offer: $431k (12.0% below list) — sets the bar for market timing.
- Cap rate 7.2% vs local median 2.6% in Alton — top-decile yield for the area; either an underpriced asset or a hidden risk that comps aren't pricing in. Stress-test before assuming the spread holds.
Location & tenants
- Location reads 58/100 on livability (#1,230 in TX) — a working-class tenant base; expect higher turnover. Strengths: cost of living A+, housing A; Watch: schools F, crime F, amenities F.
- Sharyland ISD (urban): math 34% / reading 44% proficiency, ranked #406 of 826 in TX (top 49%) — families likely to look elsewhere, expect single-tenant / working-renter base with shorter leases.
- Market conditions: Rents rising (+2.5%/yr); 623 active listings in the ZIP; 7,378 units permitted in Hidalgo County in 2024 (641 in 5+ unit buildings).
- At $4,852/mo this rent would consume 106% of the median local household income ($55k/yr) (locally 855% of renters already pay >50% of income on rent) — very limited rent-growth headroom before tenants either downsize or default.
Forward outlook
- In year one you build about $52k of equity ($3k loan paydown + $49k appreciation (10.0% local appreciation)).
- Hidalgo County population projected at +28% by 2050 — long-run rental-demand tailwind backs the buy-and-hold thesis.
- At projected returns (10.0% appreciation + 2.5% rent growth), your $137k cash investment doubles in ~3 years — after that, you're playing with house money.
- By year 2, paydown + projected appreciation supports a ~$84k cash-out refi (75% LTV) — recoverable capital for the next deal without selling this one.
Negotiation context
- It's been on market 192 days — a 12% lower offer ($431k) is reasonable based on typical stale-listing flexibility.
- 2 sale attempts with the ask held roughly flat each time — persistent listings suggest the price (not the market) is what's stuck; bring a comps-based counter.
Questions for the listing agent
- It's been on market 192 days. Have you received any prior offers? Is the seller open to a 12% concession, seller financing, or rate buy-down credit?
- Can we see the unit-by-unit rent roll, current vacancy, and any below-market leases? What's the average tenancy length?
- What capital expenditures (roof, boiler, parking lot, exteriors) have been made in the last 5 years, and what's planned in the next 2?
- What does the HOA fee cover, when was the last increase, and are there any pending special assessments or reserve-fund shortfalls?
- Why hasn't it sold? Are there any deal-killer items the seller is aware of (foundation, flood, title, zoning, code violations)?
- Is there a deadline driving the sale (1031 exchange, divorce, estate, relocation)? That informs how much negotiation room exists.
- Schools are F-rated, which usually means shorter tenancies and higher turnover. Who's the typical renter profile here, and what's been the actual vacancy rate?
- Crime grade is F in this area — have there been break-ins, vandalism, or insurance claims at this property in the last 3 years? What carrier currently insures it and at what premium?
- What's the average days-on-market for RENTAL listings here right now (not sales)? A rising rental-DOM trend means longer vacancies and softer asking-rent achievability than the comps imply.
- What's the recent tenant-quality profile in this submarket — average credit score on applications, eviction rate, late-payment / NSF rate, and stable-employment percentage? A property-management company in the area should have these aggregated.
- How much new apartment / multifamily construction is in the pipeline within 1–3 miles? Heavy new supply (>2% of stock underway) typically softens rents 12–24 months out; light construction supports rent growth.
Investment metrics
- 1% rule
- 0.99% ✗
- Cap rate
- 7.23%
- Cash-on-cash
- 3.36%
- DSCR
- 1.15
- GRM
- 8.4
CMA / ARV
- ARV (median comp)
- $526,804
- List price
- $490,000
- Delta
- -6.99%
- Verdict
- FAIR
- Comps
- 20 within 1.0 mi
Projected returns pro-forma
10.0% appreciation · 2.45% rent growth · sell at horizon
- IRR
- 26.5%
- Equity multiple
- 3.10×
- Total profit
- $288,753
- Equity at exit
- $441,431
- IRR
- 23.1%
- Equity multiple
- 7.02×
- Total profit
- $826,030
- Equity at exit
- $951,962
Cash invested: $137,200 (down + closing). Projections, not guarantees.
Landlord ↔ Tenant lean methodology
- Overall (STATE)
- 87 Strongly Landlord-Friendly
- State Texas
- 87 Strongly Landlord-Friendly · R+5
- County
- — inherits STATE
- City
- — inherits STATE
ZIP-level market 78573
- Home prices YoY
- 8.0%
- Rents YoY
- 2.5%
- Active inventory
- 623
- Price-to-rent
- 34.6×
Monthly cashflow live
- Estimated rent
- $4,852 high interval (Pro) →
- Mortgage (P&I)
- −$2,570
- Tax est. 1.5%
- −$612 /mo · $7,350/yr
- Insurance
- −$204
- HOA
- −$63
- Vacancy / Maint / Mgmt
- −$1,019
- Net cashflow
- $384
Break-even live
4-unit breakdown (identical units grouped — click to expand)
| Units | Beds | Baths | Est. rent |
|---|---|---|---|
| 2× units | 2 | 2 | $2,360 |
| #1 | 2 | 2 | $1,180 |
| #2 | 2 | 2 | $1,180 |
| 2× units | 3 | 2 | $2,492 |
| #3 | 3 | 2 | $1,246 |
| #4 | 3 | 2 | $1,246 |
| Total (4 units) | $4,852 | ||
UW: 25.0% down · 7.5% · 30yr · 1.5% tax · 5.0% vac · 8.0% maint · 8.0% mgmt
Financing live
Cash to close
- Down payment
- $122,500
- Closing costs
- $14,700
- Reserves months
- —
- Total cash needed
- —
Loan-product check · same deal, 3 products live
Conventional
25% down · 7.5% · 30yr
- Down + closing
- —
- Monthly P&I
- —
- Monthly cashflow
- —
- DSCR
- —
- Eligible?
- —
Personal DTI + credit; lowest rate.
DSCR
20% down · 8.5% · 30yr
- Down + closing
- —
- Monthly P&I
- —
- Monthly cashflow
- —
- DSCR
- —
- Eligible?
- —
No personal income docs; deal must DSCR.
Hard money
10% down · 12.0% · 12mo
- Down + closing
- —
- Monthly P&I
- —
- Monthly cashflow
- —
- DSCR
- —
- Eligible?
- —
Short-term bridge; refi at stabilization.
HOA detail
- Monthly dues
- $63 · $756/yr
Listing history 17 events
-
2026-06-18days on market $490,000 Active 192 DOM
-
2026-06-17days on market $490,000 Active 191 DOM
-
2026-06-16days on market $490,000 Active 190 DOM
-
2026-06-15days on market $490,000 Active 189 DOM
-
2026-06-14days on market $490,000 Active 187 DOM
-
2026-06-10days on market $490,000 Active 184 DOM
-
2026-06-09days on market $490,000 Active 183 DOM
-
2026-06-08days on market $490,000 Active 182 DOM
-
2026-06-07days on market $490,000 Active 181 DOM
-
2026-06-03days on market $490,000 Active 177 DOM
-
2026-06-02days on market $490,000 Active 176 DOM
-
2026-06-01days on market $490,000 Active 175 DOM
-
2026-05-31days on market $490,000 Active 174 DOM
-
2026-05-31days on market $490,000 Active 173 DOM
-
2025-12-08price $490,000 576-char remark
Show marketing remark (564 chars)
FULLY LEASED FOURPLEX ON SHARY RD AND MILE 5! Don't miss this well-maintained, contemporary-style 4-unit property featuring a sleek, modern exterior that offers strong curb appeal. The building includes a mix of spacious 3-bedroom/2-bath and 2-bedroom/2-bath units-ideal for attracting a wide range of tenants. Each unit is designed for comfort and convenience, with two full bathrooms per unit. This is a solid income-producing opportunity in a desirable location, perfect for investors looking to expand their portfolio with a reliable, low-maintenance property.
-
2025-12-08$490,000 Price Change 564-char remark
Show marketing remark (564 chars)
FULLY LEASED FOURPLEX ON SHARY RD AND MILE 5! Don't miss this well-maintained, contemporary-style 4-unit property featuring a sleek, modern exterior that offers strong curb appeal. The building includes a mix of spacious 3-bedroom/2-bath and 2-bedroom/2-bath units-ideal for attracting a wide range of tenants. Each unit is designed for comfort and convenience, with two full bathrooms per unit. This is a solid income-producing opportunity in a desirable location, perfect for investors looking to expand their portfolio with a reliable, low-maintenance property.
-
2025-11-13$500,000 Active 576-char remark
Show marketing remark (576 chars)
FULLY LEASED FOURPLEX ON SHARY RD AND MILE 5! Don’t miss this well-maintained, contemporary-style 4-unit property featuring a sleek, modern exterior that offers strong curb appeal. The building includes a mix of spacious 3-bedroom/2-bath and 2-bedroom/2-bath units—ideal for attracting a wide range of tenants. Each unit is designed for comfort and convenience, with two full bathrooms per unit. This is a solid income-producing opportunity in a desirable location, perfect for investors looking to expand their portfolio with a reliable, low-maintenance property.
ⓘ Source: listings_history table (triggers on properties + properties_extension) + one-shot
backfill from property_details.listing_events for pre-trigger history.
Nearby sold comps map
Loading sold comps map…
Walkable amenities ~0.75 mi
Loading nearby amenities…
Taxation est. · year 1
- Rental income
- $58,224
- − Mortgage interest
- −$27,448
- − Property taxes
- −$7,350
- − Insurance
- −$2,450
- − Repairs & maintenance
- −$4,658
- − Management
- −$4,658
- − HOA
- −$756
- − Depreciation
- −$14,255
- Taxable loss
- −$3,350
- Est. tax savings @ 24.0%
- +$804
- After-tax cash flow
- $5,410/yr
For passive investors: Depreciation is non-cash, so a rental often shows a tax loss while cash-flowing — sheltering income. Rental losses are passive: they offset passive income freely, and up to $25,000/yr can offset ordinary (W-2) income if you actively participate and your MAGI is under $100k (phasing out to $0 by $150k); unused losses carry forward. On sale, claimed depreciation is recaptured at up to 25%, and gains may owe capital-gains tax (a 1031 exchange can defer both). Figures are a year-1 estimate at your 24.0% rate — not tax advice; consult a CPA.
Condition & rehab AI · 4 photos
This fully leased fourplex is in good condition with a modern exterior and well-maintained landscaping. It offers a solid income-producing opportunity with a mix of 3-bedroom/2-bath and 2-bedroom/2-bath units.
Value-add opportunities
- Both Paint exterior — Enhances curb appeal and value
- Both Upgrade landscaping — Improves curb appeal and rental appeal
- Both Install smart home features — Attracts tech-savvy tenants and buyers
- Both Add energy-efficient windows — Reduces energy costs and enhances curb appeal
Renovation cost estimate screening
Value-add ROI direction
- Both Paint exterior — Enhances curb appeal and value ↑
- Both Upgrade landscaping — Improves curb appeal and rental appeal ↑
- Both Install smart home features — Attracts tech-savvy tenants and buyers ↑
- Both Add energy-efficient windows — Reduces energy costs and enhances curb appeal ↑
ⓘ Cost ranges are severity-bucket heuristics (US national rule-of-thumb). Get contractor quotes + a written scope before underwriting a rehab budget.
Schools (NCES district)
- District
- Sharyland ISD
- NCES district ID
- 4839930
- Math proficiency
- 34% ▼ -35.00%
- Reading proficiency
- 44% ▼ -15.00%
- Median HH income
- $57,792
- Composite
- 34.38/100
- National rank
- #5214
- State rank
- #406 of 826 in TX
Livability — Alton
- Score
- 58/100
- State rank
- #1230
- US rank
- #21479
Category grades
Schools grade is shown separately in the Schools card above.
Census & demographics
- County
- Hidalgo County · 623,128 people
- City population
- 144,650
- Metro
- McAllen-Edinburg-Mission, TX
- Population (ZIP)
- 44,809
- Household income
- $55,000
- Rent vs Own
- Severe rent burden
- 855.0
Population outlook (Hidalgo County) Hauer SSP2
- Today (2025)
- 955,232 people
- By 2030
- 1,009,774 · +5.7%
- By 2040
- 1,120,332 · +17.3%
- By 2050
- 1,225,036 · +28.2%
- By 2075
- 1,439,189 · +50.7%
- By 2100
- 1,533,429 · +60.5%
Race, ethnicity, and origin ACS 2023
- Neighborhood character
- Predominantly Hispanic (96%)
- Race & ethnicity
- Hispanic / Latino 96% Two or more races 63% White 3%
- Hispanic origin (detail)
- Mexican 94%
- Foreign-born
- 28% · Canada
- Languages at home
- 12% English-only · Spanish 88%
Political lean MEDSL · Hidalgo
- 2024 margin
- Toss-up / Even · D 48.1% · R 51.0%
- 2008→2024 swing
- -41.6pp toward R · 2008: 38.7pp · 2024: -2.9pp
- All cycles
- 2024: R+2.9 2020: D+17.1 2016: D+40.5 2012: D+41.8 2008: D+38.7
Not yet ingested
- Civics
- —
Market trends
- HPI YoY
- ▲ 17.95%
- Current HPI
- 242.0711
- Rent YoY
- ▲ 2.45%
- Metro
- McAllen-Edinburg-Mission, TX
- State GDP YoY
- ▲ 3.95%
- F500 in state
- 110
Industry mix (Fortune 500 HQ in TX)
| Industry | F500 HQs | Revenue |
|---|---|---|
| Energy | 16 | $1,198B |
|
||
| Technology | 5 | $198B |
|
||
| Engineering / Construction | 4 | $72B |
|
||
| Energy Services | 3 | $60B |
|
||
| Utilities | 3 | $41B |
|
||
| Healthcare | 2 | $330B |
|
||
Price history
-2.0% since first listed3 events — show timeline
- 2025-12-08 Price Changed $490,000 MCALLENMLS
- 2025-12-08 Listed $490,000 LERA
- 2025-11-13 Listed $500,000 MCALLENMLS
Cash-flow waterfall
monthlySold comps — $/sqft
last 12 mo · ≤1 miLoading sold comps…